
|
|||||
|
 | |
| |
| |
| |
| |
| |
|
Gene: FAM107B |
Gene summary for FAM107B |
| Gene information | Species | Human | Gene symbol | FAM107B | Gene ID | 83641 |
| Gene name | family with sequence similarity 107 member B | |
| Gene Alias | C10orf45 | |
| Cytomap | 10p13 | |
| Gene Type | protein-coding | GO ID | NA | UniProtAcc | Q9H098 |
Top |
Malignant transformation analysis |
| Identification of the aberrant gene expression in precancerous and cancerous lesions by comparing the gene expression of stem-like cells in diseased tissues with normal stem cells |
| Entrez ID | Symbol | Replicates | Species | Organ | Tissue | Adj P-value | Log2FC | Malignancy |
| 83641 | FAM107B | GSM4909285 | Human | Breast | IDC | 5.45e-07 | -2.38e-01 | 0.21 |
| 83641 | FAM107B | GSM4909293 | Human | Breast | IDC | 7.75e-27 | 5.59e-01 | 0.1581 |
| 83641 | FAM107B | GSM4909296 | Human | Breast | IDC | 4.68e-04 | -2.08e-01 | 0.1524 |
| 83641 | FAM107B | GSM4909297 | Human | Breast | IDC | 1.39e-02 | -1.79e-01 | 0.1517 |
| 83641 | FAM107B | GSM4909311 | Human | Breast | IDC | 2.72e-06 | -2.31e-01 | 0.1534 |
| 83641 | FAM107B | GSM4909312 | Human | Breast | IDC | 1.54e-03 | -1.99e-01 | 0.1552 |
| 83641 | FAM107B | GSM4909319 | Human | Breast | IDC | 2.14e-09 | -2.05e-01 | 0.1563 |
| 83641 | FAM107B | GSM4909321 | Human | Breast | IDC | 1.01e-06 | -2.06e-01 | 0.1559 |
| 83641 | FAM107B | M1 | Human | Breast | IDC | 3.22e-04 | 2.93e-01 | 0.1577 |
| 83641 | FAM107B | M2 | Human | Breast | IDC | 4.17e-02 | 2.92e-01 | 0.21 |
| 83641 | FAM107B | M5 | Human | Breast | IDC | 3.72e-03 | 1.56e-01 | 0.1598 |
| 83641 | FAM107B | NCCBC14 | Human | Breast | DCIS | 4.77e-02 | 3.42e-02 | 0.2021 |
| 83641 | FAM107B | NCCBC5 | Human | Breast | DCIS | 1.77e-02 | -8.45e-02 | 0.2046 |
| 83641 | FAM107B | P1 | Human | Breast | IDC | 4.30e-08 | 2.05e-02 | 0.1527 |
| 83641 | FAM107B | P2 | Human | Breast | IDC | 4.50e-04 | 3.25e-01 | 0.21 |
| 83641 | FAM107B | DCIS2 | Human | Breast | DCIS | 2.02e-54 | 5.16e-01 | 0.0085 |
| 83641 | FAM107B | HTA11_2487_2000001011 | Human | Colorectum | SER | 7.05e-03 | 4.05e-01 | -0.1808 |
| 83641 | FAM107B | HTA11_78_2000001011 | Human | Colorectum | AD | 1.54e-09 | 6.63e-01 | -0.1088 |
| 83641 | FAM107B | HTA11_347_2000001011 | Human | Colorectum | AD | 6.83e-10 | 5.23e-01 | -0.1954 |
| 83641 | FAM107B | HTA11_83_2000001011 | Human | Colorectum | SER | 7.97e-04 | 5.66e-01 | -0.1526 |
| Page: 1 2 3 4 5 6 7 8 9 |
| Tissue | Expression Dynamics | Abbreviation |
| Breast | 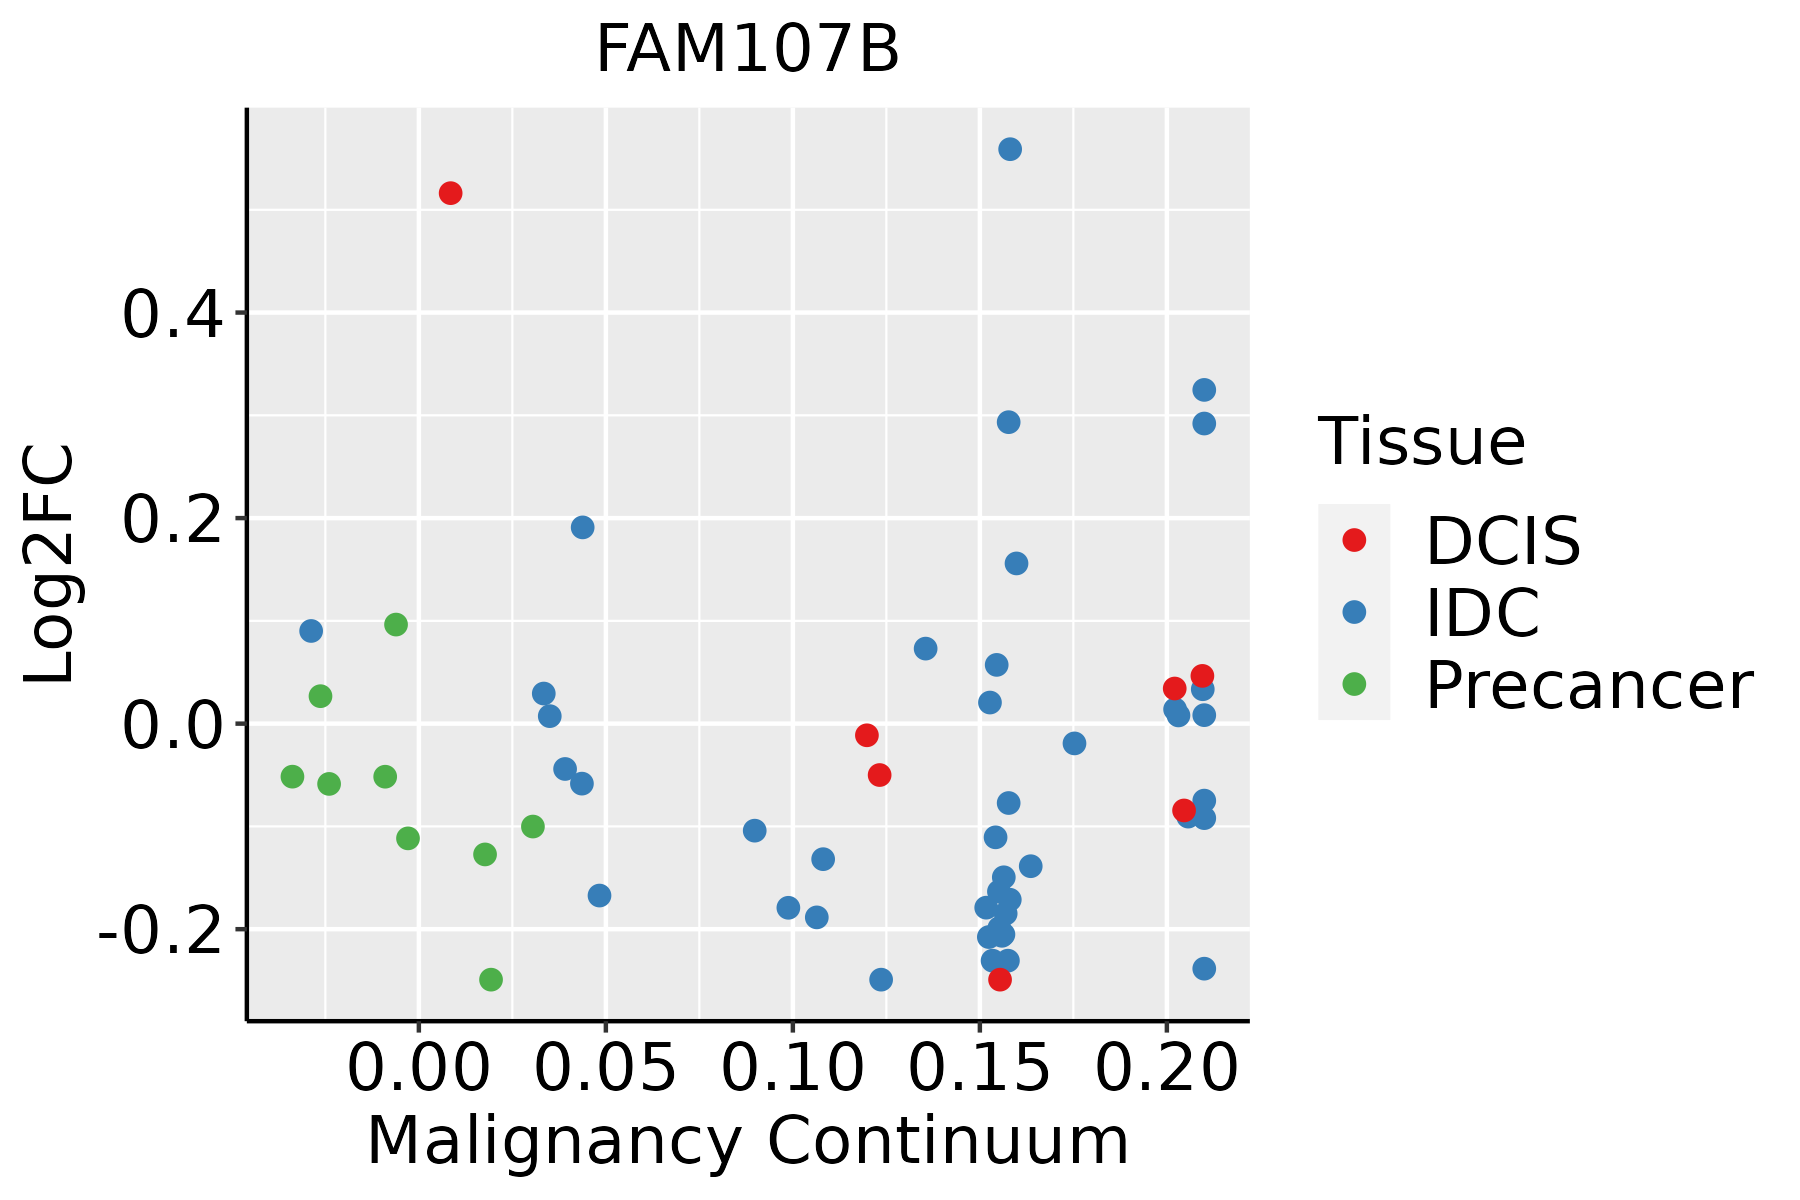 | IDC: Invasive ductal carcinoma |
| DCIS: Ductal carcinoma in situ | ||
| Precancer(BRCA1-mut): Precancerous lesion from BRCA1 mutation carriers | ||
| Colorectum (GSE201348) |  | FAP: Familial adenomatous polyposis |
| CRC: Colorectal cancer | ||
| Colorectum (HTA11) |  | AD: Adenomas |
| SER: Sessile serrated lesions | ||
| MSI-H: Microsatellite-high colorectal cancer | ||
| MSS: Microsatellite stable colorectal cancer | ||
| Endometrium |  | AEH: Atypical endometrial hyperplasia |
| EEC: Endometrioid Cancer | ||
| Esophagus | 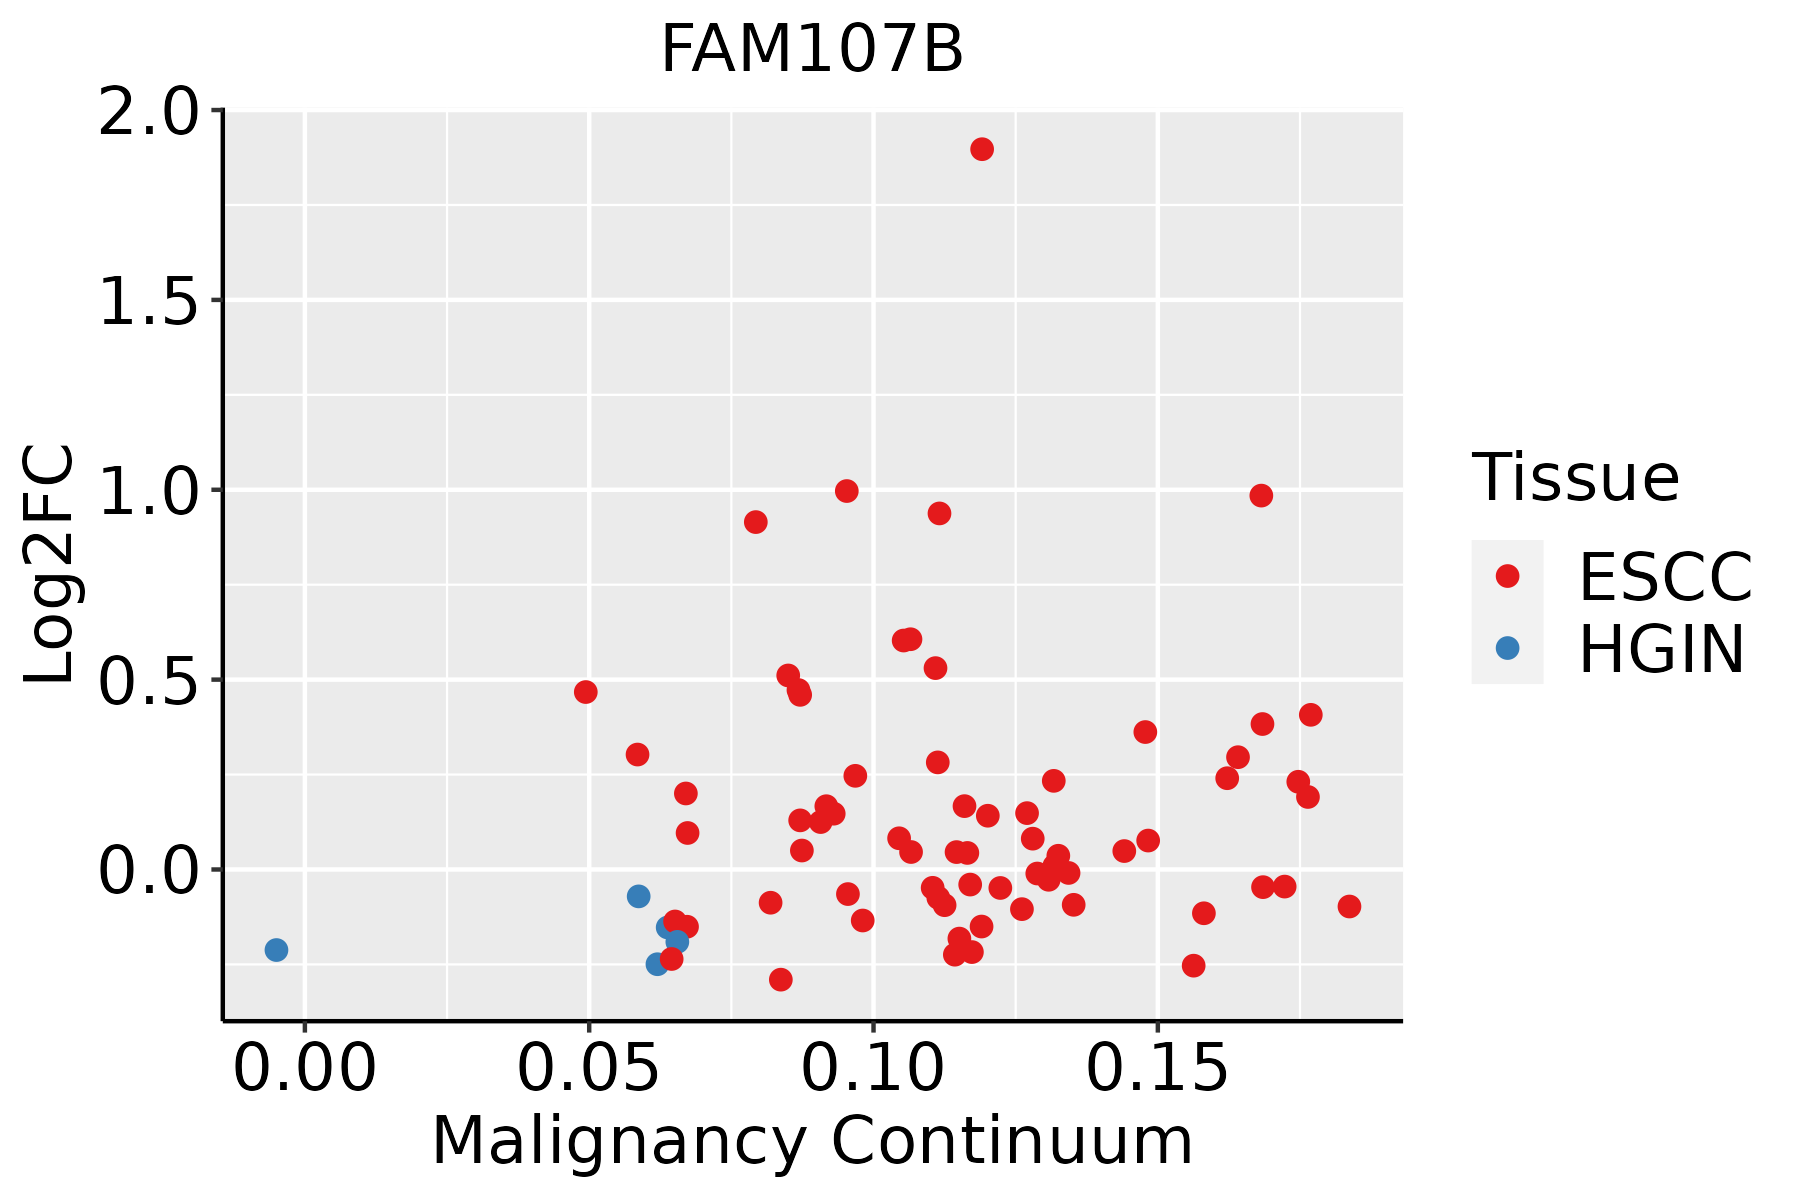 | ESCC: Esophageal squamous cell carcinoma |
| HGIN: High-grade intraepithelial neoplasias | ||
| LGIN: Low-grade intraepithelial neoplasias | ||
| GC | 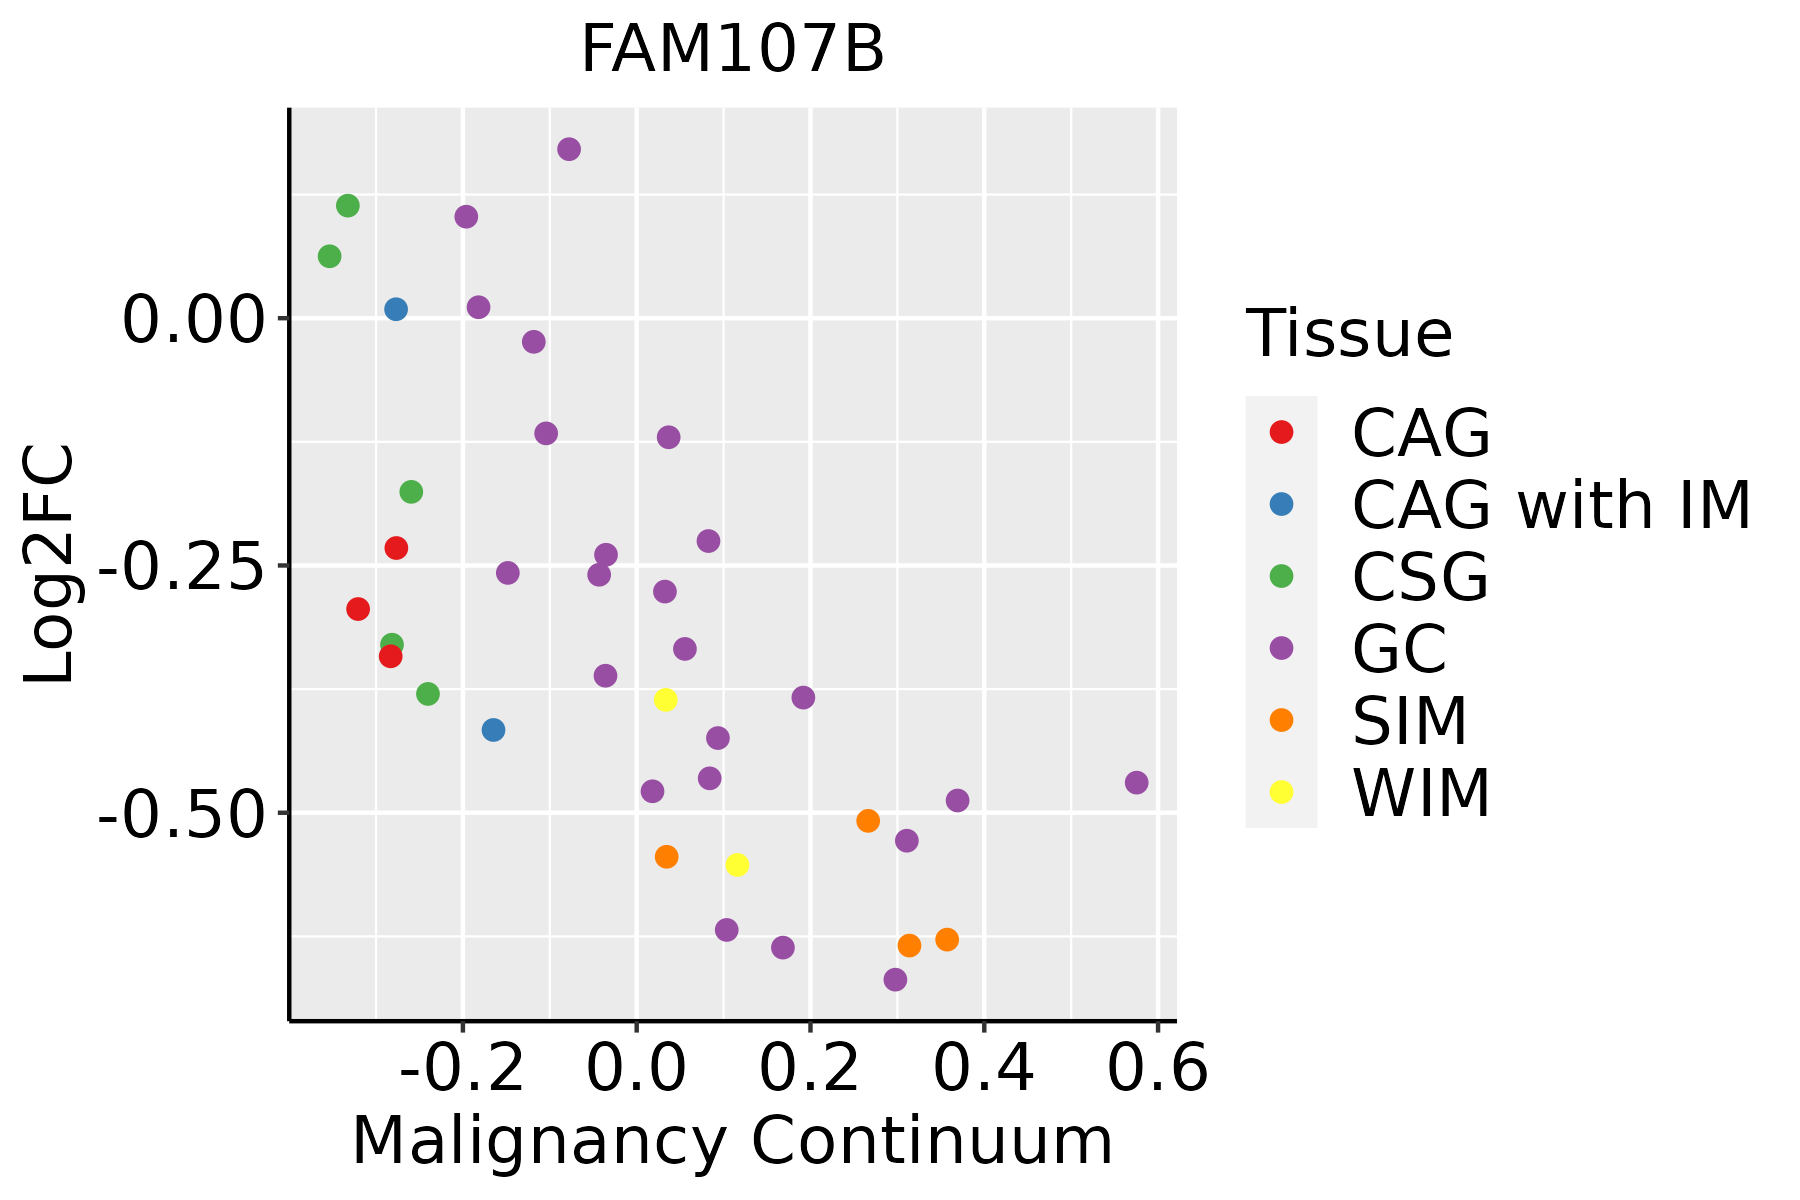 | CAG: Chronic atrophic gastritis |
| CAG with IM: Chronic atrophic gastritis with intestinal metaplasia | ||
| CSG: Chronic superficial gastritis | ||
| GC: Gastric cancer | ||
| SIM: Severe intestinal metaplasia | ||
| WIM: Wild intestinal metaplasia | ||
| Liver |  | HCC: Hepatocellular carcinoma |
| NAFLD: Non-alcoholic fatty liver disease | ||
| Lung | 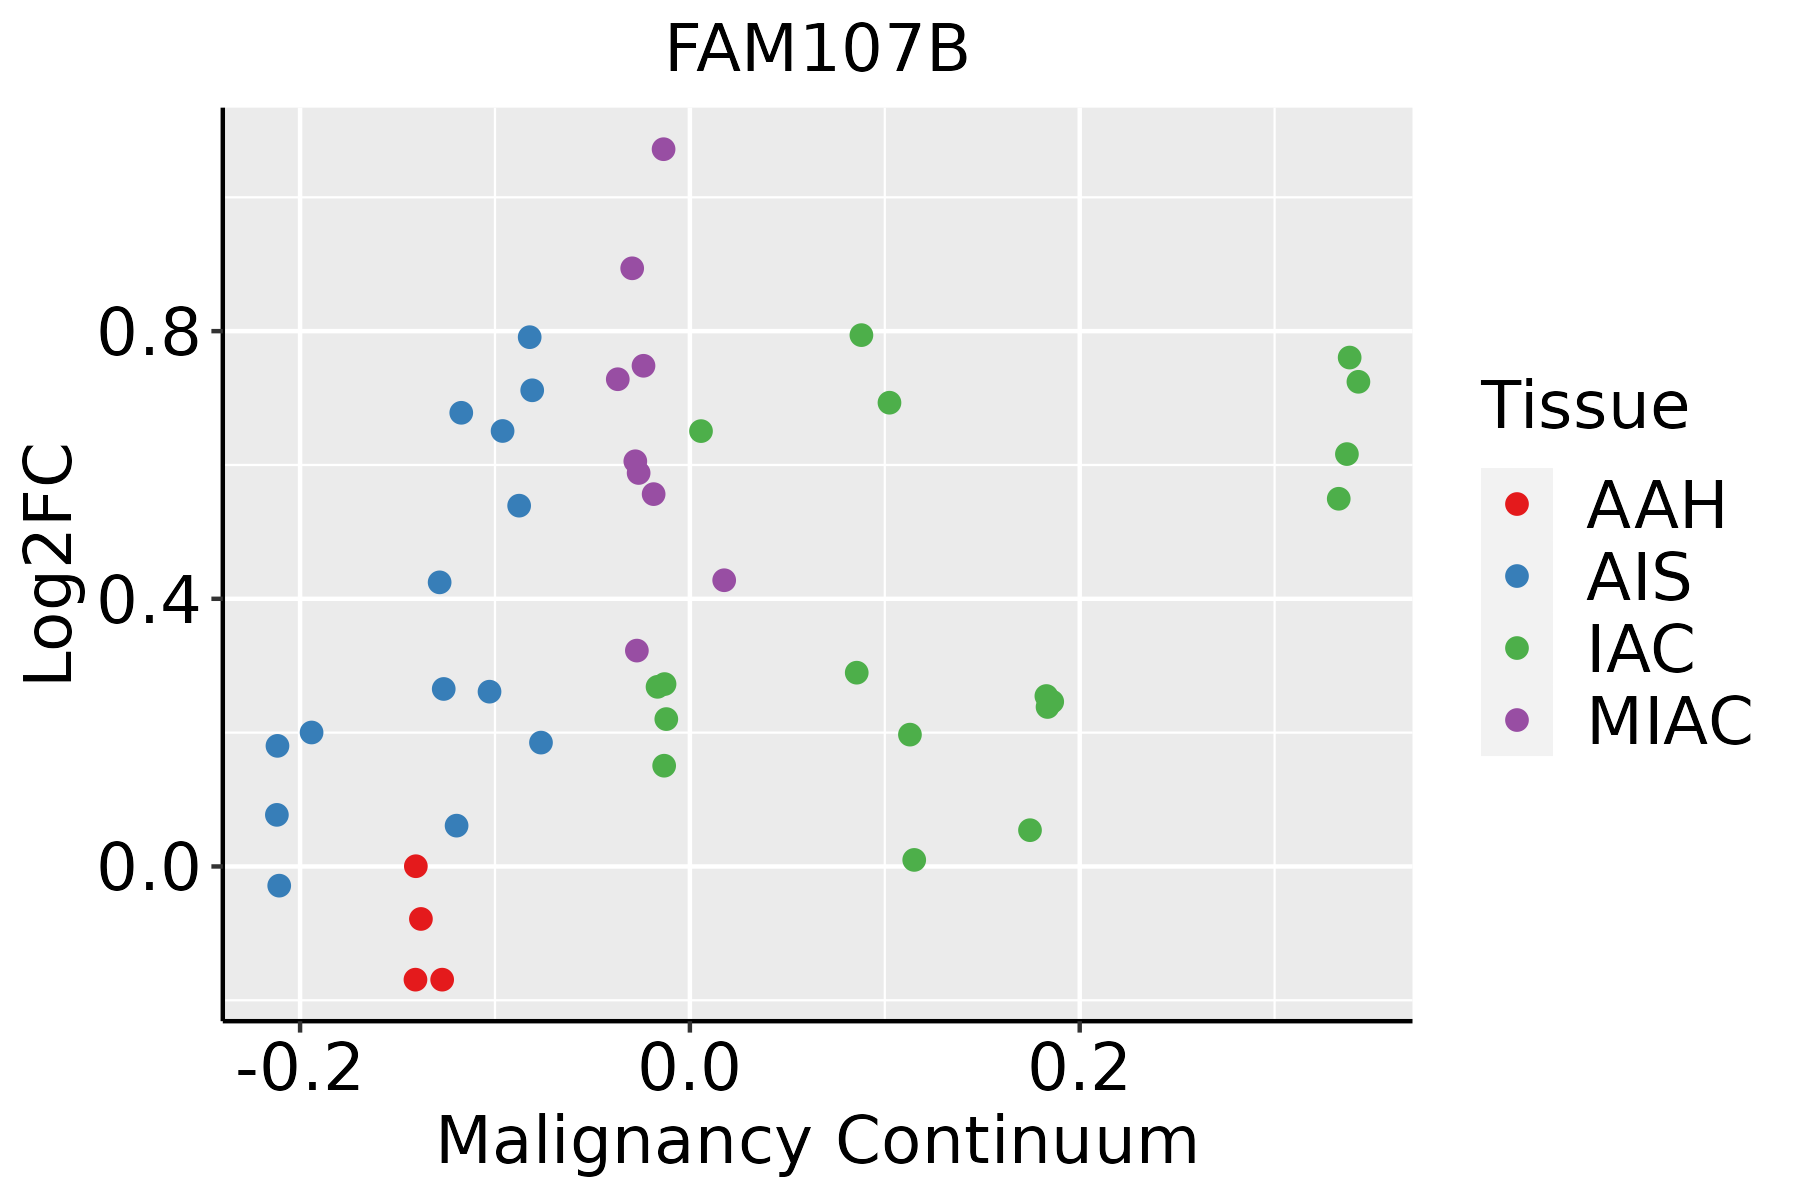 | AAH: Atypical adenomatous hyperplasia |
| AIS: Adenocarcinoma in situ | ||
| IAC: Invasive lung adenocarcinoma | ||
| MIA: Minimally invasive adenocarcinoma | ||
| Prostate |  | BPH: Benign Prostatic Hyperplasia |
| ∗log2FC in expression of this searched gene in stem-like cells from each diseased tissue sample relative to stem-like cells in normal samples in each tissue plotted against the malignancy continuum. Samples are colored based on if they are from different disease stage. |
Top |
Malignant transformation related pathway analysis |
| Find out the enriched GO biological processes and KEGG pathways involved in transition from healthy to precancer to cancer |
| Tissue | Disease Stage | Enriched GO biological Processes |
| Colorectum | AD |  |
| Colorectum | SER |  |
| Colorectum | MSS |  |
| Colorectum | MSI-H |  |
| Colorectum | FAP |  |
| ∗Top 15 enriched GO BP terms are showed in the bar plot of each disease state in each tissue. Each row represents a significant GO biological process which is colored according to the -log10(p.adjust). |
| Page: 1 2 3 4 5 6 7 8 9 |
| GO ID | Tissue | Disease Stage | Description | Gene Ratio | Bg Ratio | pvalue | p.adjust | Count |
| Page: 1 |
| Pathway ID | Tissue | Disease Stage | Description | Gene Ratio | Bg Ratio | pvalue | p.adjust | qvalue | Count |
| Page: 1 |
Top |
Cell-cell communication analysis |
| Identification of potential cell-cell interactions between two cell types and their ligand-receptor pairs for different disease states |
| Ligand | Receptor | LRpair | Pathway | Tissue | Disease Stage |
| Page: 1 |
Top |
Single-cell gene regulatory network inference analysis |
| Find out the significant the regulons (TFs) and the target genes of each regulon across cell types for different disease states |
| TF | Cell Type | Tissue | Disease Stage | Target Gene | RSS | Regulon Activity |
| ∗The dot plots of a searched regulon are shown for all cell subpopulations in each disease state of each tissue based on the regulon specific score inferred using pySCENIC and by calculating the average expression. |
| Page: 1 |
Top |
Somatic mutation of malignant transformation related genes |
| Annotation of somatic variants for genes involved in malignant transformation |
| Hugo Symbol | Variant Class | Variant Classification | dbSNP RS | HGVSc | HGVSp | HGVSp Short | SWISSPROT | BIOTYPE | SIFT | PolyPhen | Tumor Sample Barcode | Tissue | Histology | Sex | Age | Stage | Therapy Types | Drugs | Outcome |
| FAM107B | SNV | Missense_Mutation | c.358N>T | p.Ala120Ser | p.A120S | Q9H098 | protein_coding | tolerated_low_confidence(0.11) | benign(0.007) | TCGA-A2-A04R-01 | Breast | breast invasive carcinoma | Female | <65 | I/II | Chemotherapy | taxol | SD | |
| FAM107B | SNV | Missense_Mutation | novel | c.370C>T | p.His124Tyr | p.H124Y | Q9H098 | protein_coding | deleterious_low_confidence(0.01) | benign(0.037) | TCGA-BH-A0EE-01 | Breast | breast invasive carcinoma | Female | >=65 | I/II | Chemotherapy | docetaxel | SD |
| FAM107B | insertion | Frame_Shift_Ins | novel | c.320_321insGCTAAGC | p.Asp107GlufsTer10 | p.D107Efs*10 | Q9H098 | protein_coding | TCGA-A8-A07R-01 | Breast | breast invasive carcinoma | Female | >=65 | III/IV | Ancillary | zoledronic | SD | ||
| FAM107B | insertion | Frame_Shift_Ins | novel | c.318_319insTGGGCATCTATTCTAGTTCAAACACCGA | p.Asp107TrpfsTer17 | p.D107Wfs*17 | Q9H098 | protein_coding | TCGA-A8-A07R-01 | Breast | breast invasive carcinoma | Female | >=65 | III/IV | Ancillary | zoledronic | SD | ||
| FAM107B | insertion | In_Frame_Ins | novel | c.168_169insACAGGAGTGAGCCACCATGCCCGGCCAGTGCATATTCTTATG | p.Pro56_Val57insThrGlyValSerHisHisAlaArgProValHisIleLeuMet | p.P56_V57insTGVSHHARPVHILM | Q9H098 | protein_coding | TCGA-A8-A08H-01 | Breast | breast invasive carcinoma | Female | >=65 | I/II | Unknown | Unknown | SD | ||
| FAM107B | SNV | Missense_Mutation | novel | c.49A>G | p.Arg17Gly | p.R17G | Q9H098 | protein_coding | tolerated_low_confidence(0.64) | benign(0) | TCGA-FU-A57G-01 | Cervix | cervical & endocervical cancer | Female | <65 | I/II | Unknown | Unknown | SD |
| FAM107B | SNV | Missense_Mutation | c.462N>A | p.Met154Ile | p.M154I | Q9H098 | protein_coding | tolerated_low_confidence(0.25) | benign(0.015) | TCGA-IR-A3LK-01 | Cervix | cervical & endocervical cancer | Female | >=65 | I/II | Chemotherapy | cisplatin | PD | |
| FAM107B | SNV | Missense_Mutation | novel | c.319N>A | p.Asp107Asn | p.D107N | Q9H098 | protein_coding | tolerated_low_confidence(0.12) | benign(0.127) | TCGA-VS-A8EL-01 | Cervix | cervical & endocervical cancer | Female | <65 | I/II | Chemotherapy | cisplatin | CR |
| FAM107B | SNV | Missense_Mutation | c.169N>A | p.Val57Met | p.V57M | Q9H098 | protein_coding | tolerated_low_confidence(0.57) | benign(0.005) | TCGA-A6-A565-01 | Colorectum | colon adenocarcinoma | Female | <65 | III/IV | Unspecific | 5FU | PD | |
| FAM107B | SNV | Missense_Mutation | rs767708669 | c.203N>A | p.Ser68Asn | p.S68N | Q9H098 | protein_coding | tolerated_low_confidence(0.14) | benign(0.035) | TCGA-AA-3949-01 | Colorectum | colon adenocarcinoma | Female | >=65 | III/IV | Unknown | Unknown | SD |
| Page: 1 2 3 4 5 6 |
Top |
Related drugs of malignant transformation related genes |
| Identification of chemicals and drugs interact with genes involved in malignant transfromation |
| (DGIdb 4.0) |
| Entrez ID | Symbol | Category | Interaction Types | Drug Claim Name | Drug Name | PMIDs |
| Page: 1 |

Copyright 2023-Present -The University of Texas Health Science Center at Houston |