
|
|||||
|
 | |
| |
| |
| |
| |
| |
|
Gene: FAM102A |
Gene summary for FAM102A |
| Gene information | Species | Human | Gene symbol | FAM102A | Gene ID | 399665 |
| Gene name | family with sequence similarity 102 member A | |
| Gene Alias | C9orf132 | |
| Cytomap | 9q34.11 | |
| Gene Type | protein-coding | GO ID | GO:0003674 | UniProtAcc | Q5T9C2 |
Top |
Malignant transformation analysis |
| Identification of the aberrant gene expression in precancerous and cancerous lesions by comparing the gene expression of stem-like cells in diseased tissues with normal stem cells |
| Entrez ID | Symbol | Replicates | Species | Organ | Tissue | Adj P-value | Log2FC | Malignancy |
| 399665 | FAM102A | LZE4T | Human | Esophagus | ESCC | 1.15e-08 | 1.68e-01 | 0.0811 |
| 399665 | FAM102A | LZE7T | Human | Esophagus | ESCC | 1.64e-05 | 2.36e-01 | 0.0667 |
| 399665 | FAM102A | LZE8T | Human | Esophagus | ESCC | 2.23e-06 | 1.55e-01 | 0.067 |
| 399665 | FAM102A | LZE20T | Human | Esophagus | ESCC | 9.26e-05 | 1.81e-01 | 0.0662 |
| 399665 | FAM102A | LZE22D1 | Human | Esophagus | HGIN | 2.64e-03 | 1.60e-01 | 0.0595 |
| 399665 | FAM102A | LZE24T | Human | Esophagus | ESCC | 1.79e-21 | 7.45e-01 | 0.0596 |
| 399665 | FAM102A | LZE21T | Human | Esophagus | ESCC | 1.87e-06 | 7.23e-01 | 0.0655 |
| 399665 | FAM102A | P1T-E | Human | Esophagus | ESCC | 4.88e-12 | 7.79e-01 | 0.0875 |
| 399665 | FAM102A | P2T-E | Human | Esophagus | ESCC | 2.50e-14 | 2.48e-01 | 0.1177 |
| 399665 | FAM102A | P4T-E | Human | Esophagus | ESCC | 3.18e-22 | 3.34e-01 | 0.1323 |
| 399665 | FAM102A | P5T-E | Human | Esophagus | ESCC | 4.59e-14 | 5.65e-02 | 0.1327 |
| 399665 | FAM102A | P8T-E | Human | Esophagus | ESCC | 1.17e-19 | 6.47e-01 | 0.0889 |
| 399665 | FAM102A | P9T-E | Human | Esophagus | ESCC | 8.28e-08 | 1.40e-01 | 0.1131 |
| 399665 | FAM102A | P10T-E | Human | Esophagus | ESCC | 1.02e-09 | -8.83e-03 | 0.116 |
| 399665 | FAM102A | P11T-E | Human | Esophagus | ESCC | 2.60e-11 | 3.59e-01 | 0.1426 |
| 399665 | FAM102A | P12T-E | Human | Esophagus | ESCC | 1.20e-13 | 2.56e-01 | 0.1122 |
| 399665 | FAM102A | P15T-E | Human | Esophagus | ESCC | 1.08e-21 | 5.86e-01 | 0.1149 |
| 399665 | FAM102A | P16T-E | Human | Esophagus | ESCC | 1.53e-10 | 2.58e-01 | 0.1153 |
| 399665 | FAM102A | P19T-E | Human | Esophagus | ESCC | 3.14e-02 | 3.03e-01 | 0.1662 |
| 399665 | FAM102A | P20T-E | Human | Esophagus | ESCC | 4.60e-21 | 3.82e-01 | 0.1124 |
| Page: 1 2 3 4 5 |
| Tissue | Expression Dynamics | Abbreviation |
| Esophagus |  | ESCC: Esophageal squamous cell carcinoma |
| HGIN: High-grade intraepithelial neoplasias | ||
| LGIN: Low-grade intraepithelial neoplasias | ||
| Oral Cavity | 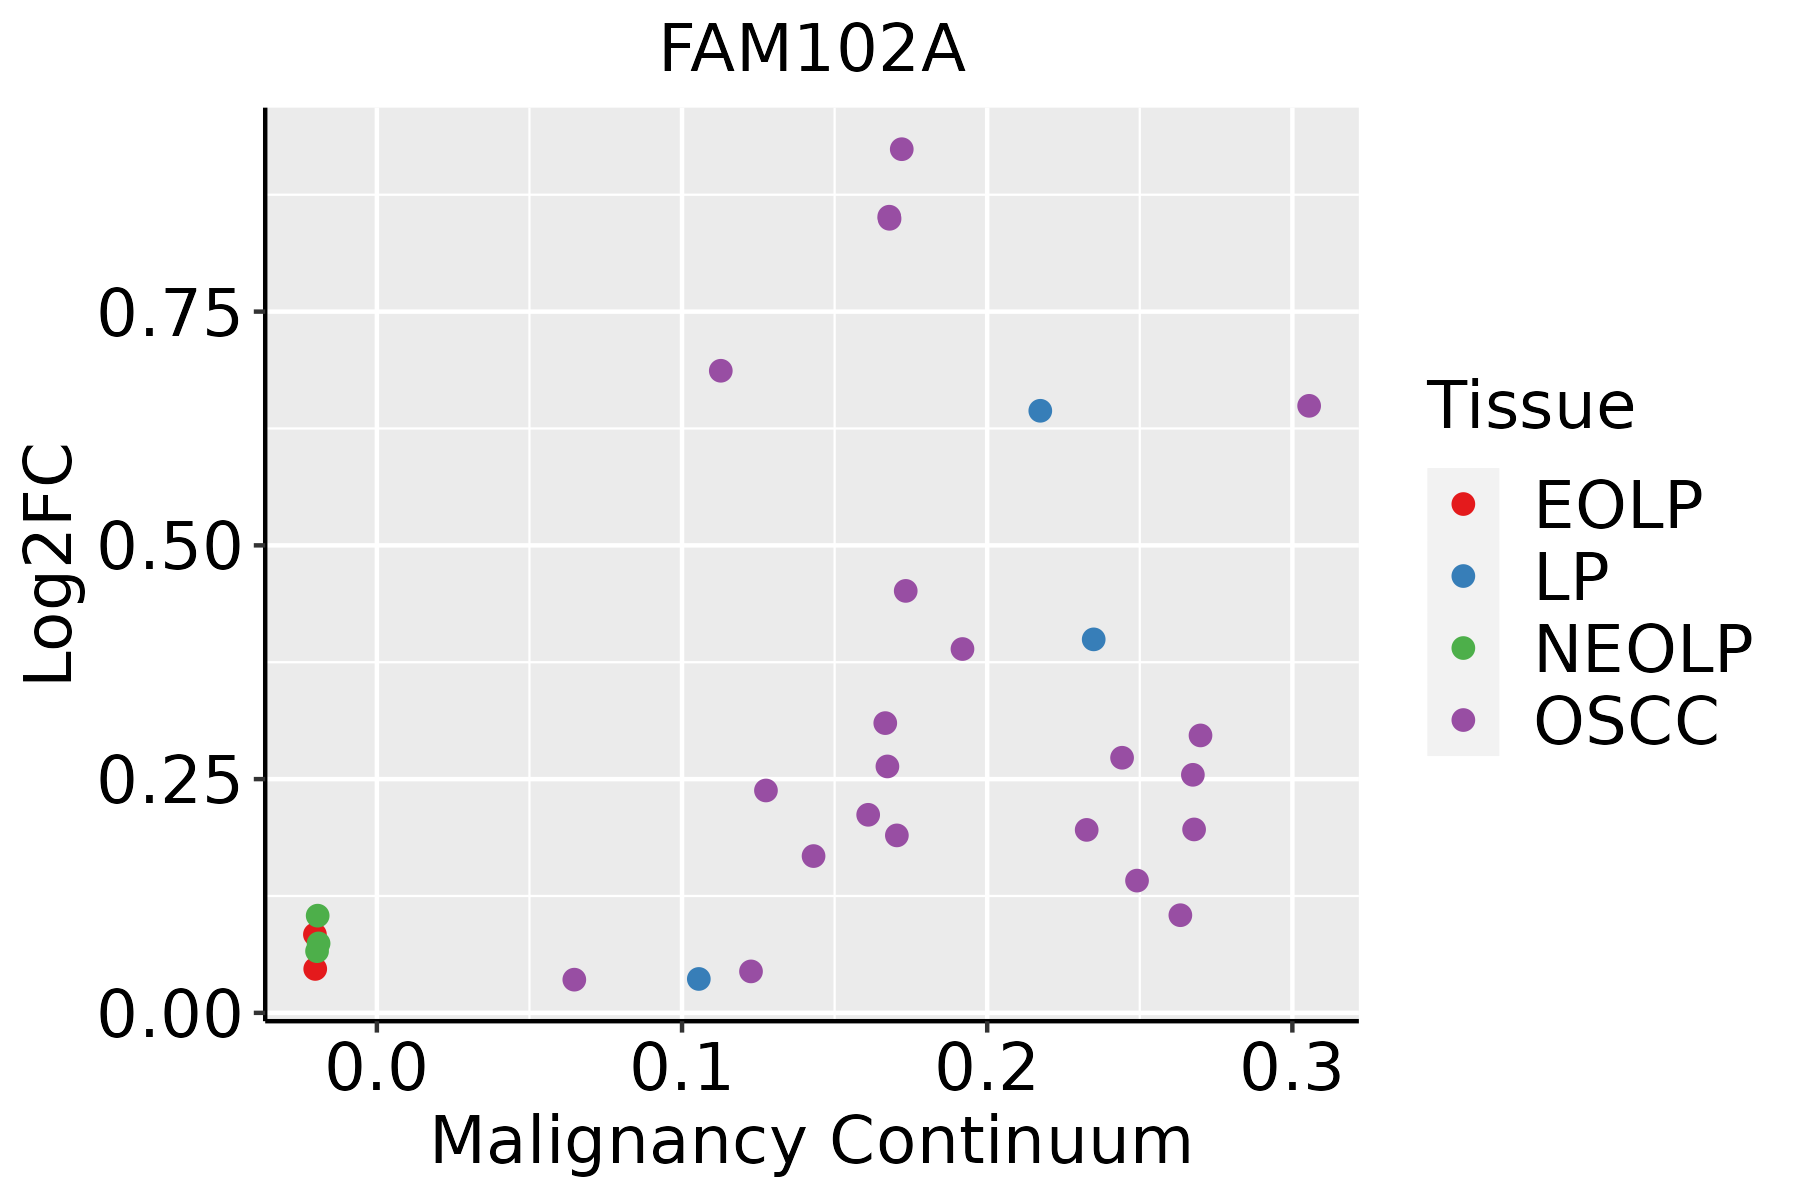 | EOLP: Erosive Oral lichen planus |
| LP: leukoplakia | ||
| NEOLP: Non-erosive oral lichen planus | ||
| OSCC: Oral squamous cell carcinoma | ||
| Thyroid | 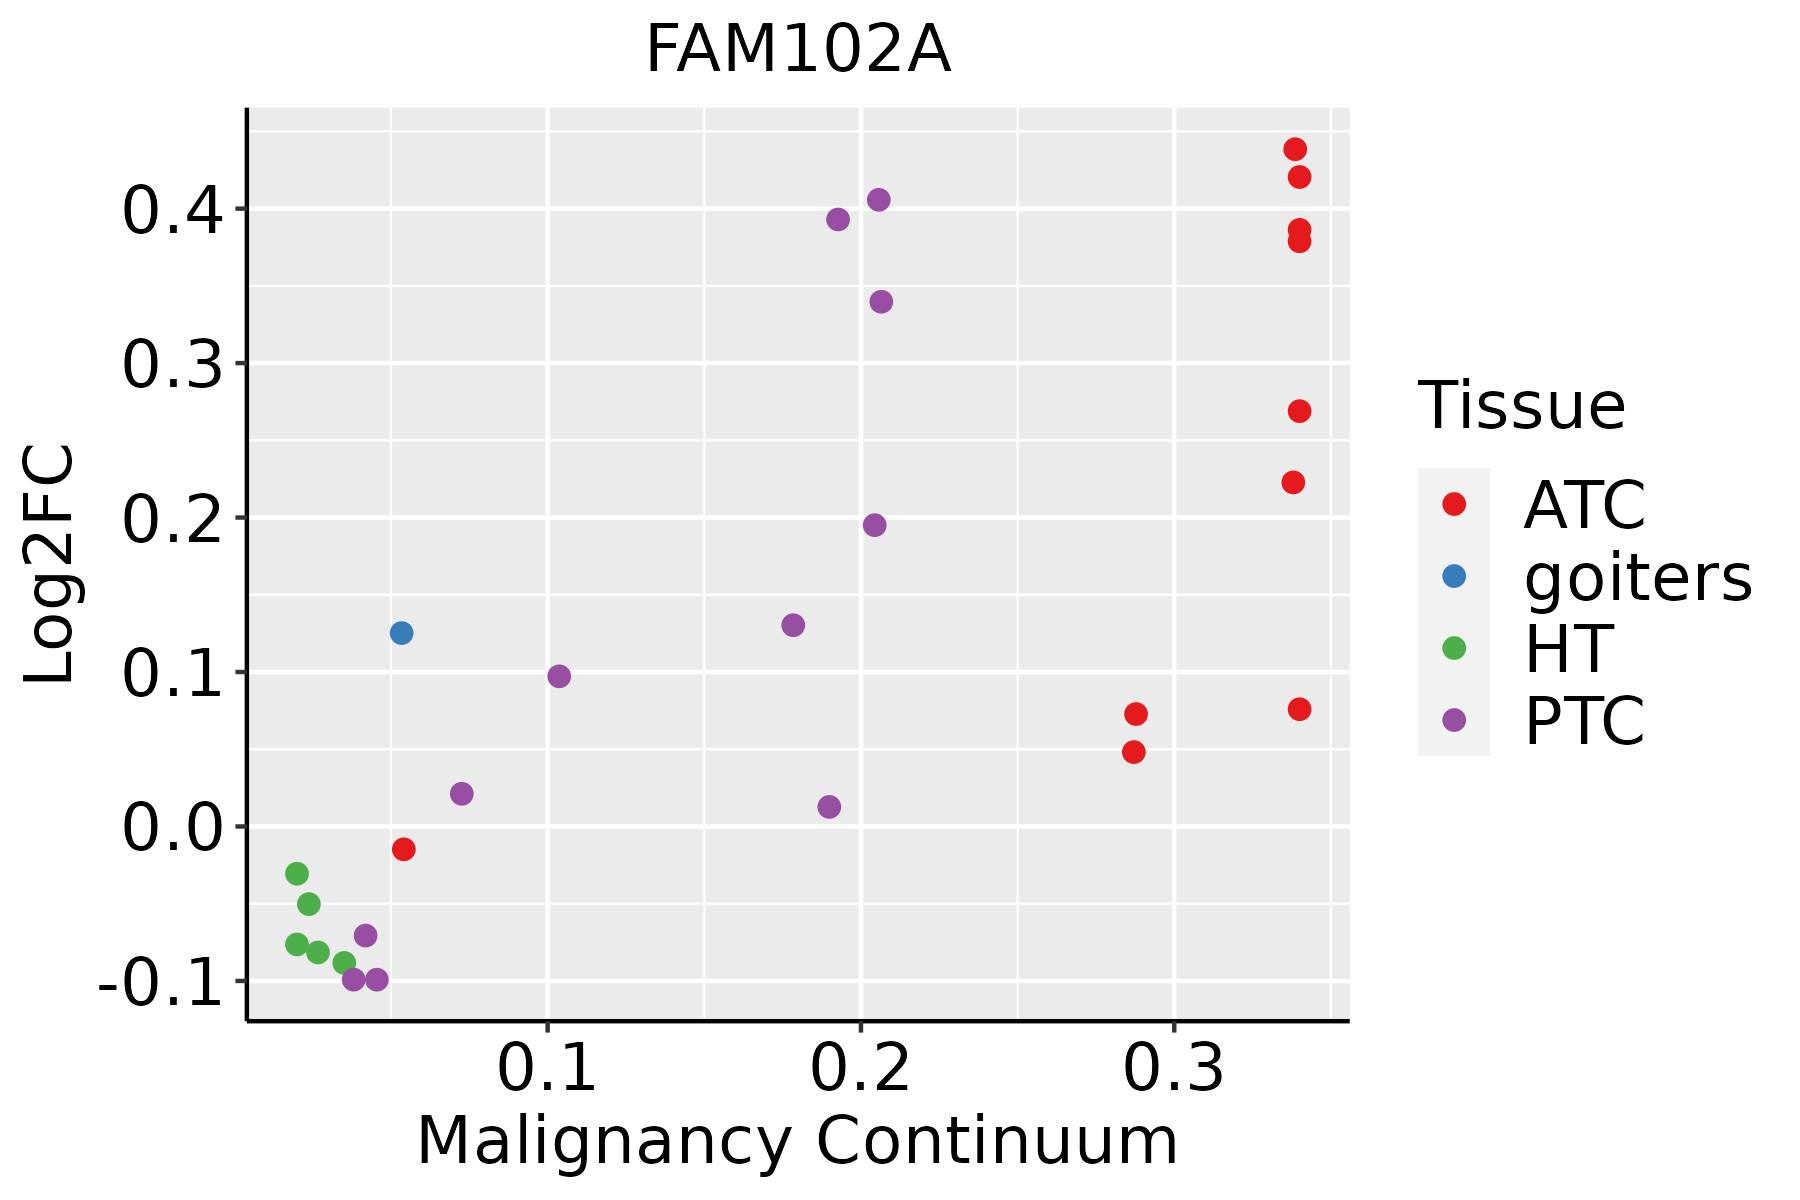 | ATC: Anaplastic thyroid cancer |
| HT: Hashimoto's thyroiditis | ||
| PTC: Papillary thyroid cancer |
| ∗log2FC in expression of this searched gene in stem-like cells from each diseased tissue sample relative to stem-like cells in normal samples in each tissue plotted against the malignancy continuum. Samples are colored based on if they are from different disease stage. |
Top |
Malignant transformation related pathway analysis |
| Find out the enriched GO biological processes and KEGG pathways involved in transition from healthy to precancer to cancer |
| Tissue | Disease Stage | Enriched GO biological Processes |
| Colorectum | AD |  |
| Colorectum | SER |  |
| Colorectum | MSS |  |
| Colorectum | MSI-H |  |
| Colorectum | FAP |  |
| ∗Top 15 enriched GO BP terms are showed in the bar plot of each disease state in each tissue. Each row represents a significant GO biological process which is colored according to the -log10(p.adjust). |
| Page: 1 2 3 4 5 6 7 8 9 |
| GO ID | Tissue | Disease Stage | Description | Gene Ratio | Bg Ratio | pvalue | p.adjust | Count |
| Page: 1 |
| Pathway ID | Tissue | Disease Stage | Description | Gene Ratio | Bg Ratio | pvalue | p.adjust | qvalue | Count |
| Page: 1 |
Top |
Cell-cell communication analysis |
| Identification of potential cell-cell interactions between two cell types and their ligand-receptor pairs for different disease states |
| Ligand | Receptor | LRpair | Pathway | Tissue | Disease Stage |
| Page: 1 |
Top |
Single-cell gene regulatory network inference analysis |
| Find out the significant the regulons (TFs) and the target genes of each regulon across cell types for different disease states |
| TF | Cell Type | Tissue | Disease Stage | Target Gene | RSS | Regulon Activity |
| ∗The dot plots of a searched regulon are shown for all cell subpopulations in each disease state of each tissue based on the regulon specific score inferred using pySCENIC and by calculating the average expression. |
| Page: 1 |
Top |
Somatic mutation of malignant transformation related genes |
| Annotation of somatic variants for genes involved in malignant transformation |
| Hugo Symbol | Variant Class | Variant Classification | dbSNP RS | HGVSc | HGVSp | HGVSp Short | SWISSPROT | BIOTYPE | SIFT | PolyPhen | Tumor Sample Barcode | Tissue | Histology | Sex | Age | Stage | Therapy Types | Drugs | Outcome |
| FAM102A | SNV | Missense_Mutation | c.326A>T | p.Glu109Val | p.E109V | Q5T9C2 | protein_coding | deleterious(0) | probably_damaging(0.999) | TCGA-A1-A0SE-01 | Breast | breast invasive carcinoma | Female | <65 | I/II | Unknown | Unknown | SD | |
| FAM102A | SNV | Missense_Mutation | rs372554454 | c.179N>A | p.Arg60Gln | p.R60Q | Q5T9C2 | protein_coding | tolerated(0.06) | benign(0.137) | TCGA-AN-A046-01 | Breast | breast invasive carcinoma | Female | >=65 | I/II | Unknown | Unknown | SD |
| FAM102A | SNV | Missense_Mutation | novel | c.179N>T | p.Arg60Leu | p.R60L | Q5T9C2 | protein_coding | deleterious(0.02) | benign(0.097) | TCGA-AO-A03R-01 | Breast | breast invasive carcinoma | Female | <65 | I/II | Chemotherapy | doxorubicin | SD |
| FAM102A | SNV | Missense_Mutation | c.775C>A | p.Arg259Ser | p.R259S | Q5T9C2 | protein_coding | deleterious(0.02) | probably_damaging(0.995) | TCGA-AO-A128-01 | Breast | breast invasive carcinoma | Female | <65 | I/II | Chemotherapy | doxorubicin | SD | |
| FAM102A | deletion | Frame_Shift_Del | c.939_964delNNNNNNNNNNNNNNNNNNNNNNNNNN | p.Glu313AspfsTer61 | p.E313Dfs*61 | Q5T9C2 | protein_coding | TCGA-A2-A0T0-01 | Breast | breast invasive carcinoma | Female | <65 | I/II | Chemotherapy | taxotere | SD | |||
| FAM102A | SNV | Missense_Mutation | c.819N>A | p.Met273Ile | p.M273I | Q5T9C2 | protein_coding | tolerated(0.45) | benign(0.01) | TCGA-C5-A3HE-01 | Cervix | cervical & endocervical cancer | Female | <65 | I/II | Unknown | Unknown | PD | |
| FAM102A | SNV | Missense_Mutation | rs532794999 | c.12G>C | p.Leu4Phe | p.L4F | Q5T9C2 | protein_coding | tolerated(0.15) | probably_damaging(0.92) | TCGA-DR-A0ZM-01 | Cervix | cervical & endocervical cancer | Female | <65 | III/IV | Unspecific | Cisplatin | SD |
| FAM102A | SNV | Missense_Mutation | rs776105165 | c.484N>G | p.Ile162Val | p.I162V | Q5T9C2 | protein_coding | tolerated(0.35) | benign(0.003) | TCGA-AA-3947-01 | Colorectum | colon adenocarcinoma | Female | <65 | I/II | Unknown | Unknown | SD |
| FAM102A | SNV | Missense_Mutation | rs746058791 | c.596G>A | p.Arg199Gln | p.R199Q | Q5T9C2 | protein_coding | tolerated(0.07) | benign(0.108) | TCGA-AA-A00N-01 | Colorectum | colon adenocarcinoma | Male | >=65 | I/II | Unknown | Unknown | PD |
| FAM102A | SNV | Missense_Mutation | c.62T>C | p.Leu21Pro | p.L21P | Q5T9C2 | protein_coding | deleterious(0) | probably_damaging(0.999) | TCGA-AD-6889-01 | Colorectum | colon adenocarcinoma | Male | >=65 | I/II | Chemotherapy | xeloda | PD |
| Page: 1 2 3 4 |
Top |
Related drugs of malignant transformation related genes |
| Identification of chemicals and drugs interact with genes involved in malignant transfromation |
| (DGIdb 4.0) |
| Entrez ID | Symbol | Category | Interaction Types | Drug Claim Name | Drug Name | PMIDs |
| Page: 1 |

Copyright 2023-Present -The University of Texas Health Science Center at Houston |