Schematic overview of the cellular and molecular mechanisms involved in the cancer progression, including the proposed cellular and molecular mechanisms in cancer cells trajectory. AT1: alveolar type 1 cells; AT2: alveolar type 2 cells; AAH: atypical adenomatous hyperplasia; AIS: adenocarcinoma in situ; MIA: minimally invasive adenocarcinoma; IA: invasive adenocarcinoma; EMT: epithelial-mesenchymal transition

Home

Download

Statistics

Help

Contact

Center for Computational Systems Medicine
leaf

Gene summary

leaf

Malignant transformation analysis

leaf

Malignant transformation related pathway analysis

leaf

Cell-cell communication analysis

leaf

Single-cell gene regulatory network inference analysis

leaf

Somatic mutation of malignant transformation related genes

leaf

Related drugs of malignant transformation related genes

Gene: FAIM

Gene summary for FAIM

check button Gene summary.

Gene informationSpeciesHuman
Gene symbol

FAIM

Gene ID

55179

Gene nameFas apoptotic inhibitory molecule
Gene AliasFAIM1
Cytomap3q22.3
Gene Typeprotein-coding
GO ID

GO:0006915

UniProtAcc

Q9NVQ4


Top

Malignant transformation analysis

check button Identification of the aberrant gene expression in precancerous and cancerous lesions by comparing the gene expression of stem-like cells in diseased tissues with normal stem cells
check button Malignant transformation involving gene list.
Entrez IDSymbolReplicatesSpeciesOrganTissueAdj P-valueLog2FCMalignancy
55179FAIMLZE2THumanEsophagusESCC4.26e-045.77e-010.082
55179FAIMLZE4THumanEsophagusESCC6.77e-082.97e-010.0811
55179FAIMLZE5THumanEsophagusESCC3.72e-022.33e-010.0514
55179FAIMLZE7THumanEsophagusESCC1.22e-034.31e-010.0667
55179FAIMLZE8THumanEsophagusESCC1.33e-082.01e-010.067
55179FAIMLZE20THumanEsophagusESCC5.60e-061.12e-010.0662
55179FAIMLZE22D1HumanEsophagusHGIN2.51e-021.26e-010.0595
55179FAIMLZE22THumanEsophagusESCC7.55e-053.40e-010.068
55179FAIMLZE24THumanEsophagusESCC1.21e-216.76e-010.0596
55179FAIMLZE6THumanEsophagusESCC6.11e-074.54e-010.0845
55179FAIMP1T-EHumanEsophagusESCC2.09e-042.56e-010.0875
55179FAIMP2T-EHumanEsophagusESCC1.98e-398.09e-010.1177
55179FAIMP4T-EHumanEsophagusESCC2.42e-278.64e-010.1323
55179FAIMP5T-EHumanEsophagusESCC7.37e-132.73e-010.1327
55179FAIMP8T-EHumanEsophagusESCC3.56e-336.95e-010.0889
55179FAIMP9T-EHumanEsophagusESCC9.75e-143.44e-010.1131
55179FAIMP10T-EHumanEsophagusESCC2.31e-438.13e-010.116
55179FAIMP11T-EHumanEsophagusESCC1.72e-157.52e-010.1426
55179FAIMP12T-EHumanEsophagusESCC2.51e-407.65e-010.1122
55179FAIMP15T-EHumanEsophagusESCC2.49e-205.38e-010.1149
Page: 1 2 3 4 5 6 

check button Transcriptomic changes along malignancy continuum.
TissueExpression DynamicsAbbreviation
EsophagusThe image shows the transcriptomic changes along malignancy continuum.log2FC in expression of this searched gene in stem-like cells from each diseased tissue sample relative to stem-like cells in normal samples in each tissue plotted against the malignancy continuum. Samples are colored based on if they are from different disease stage.
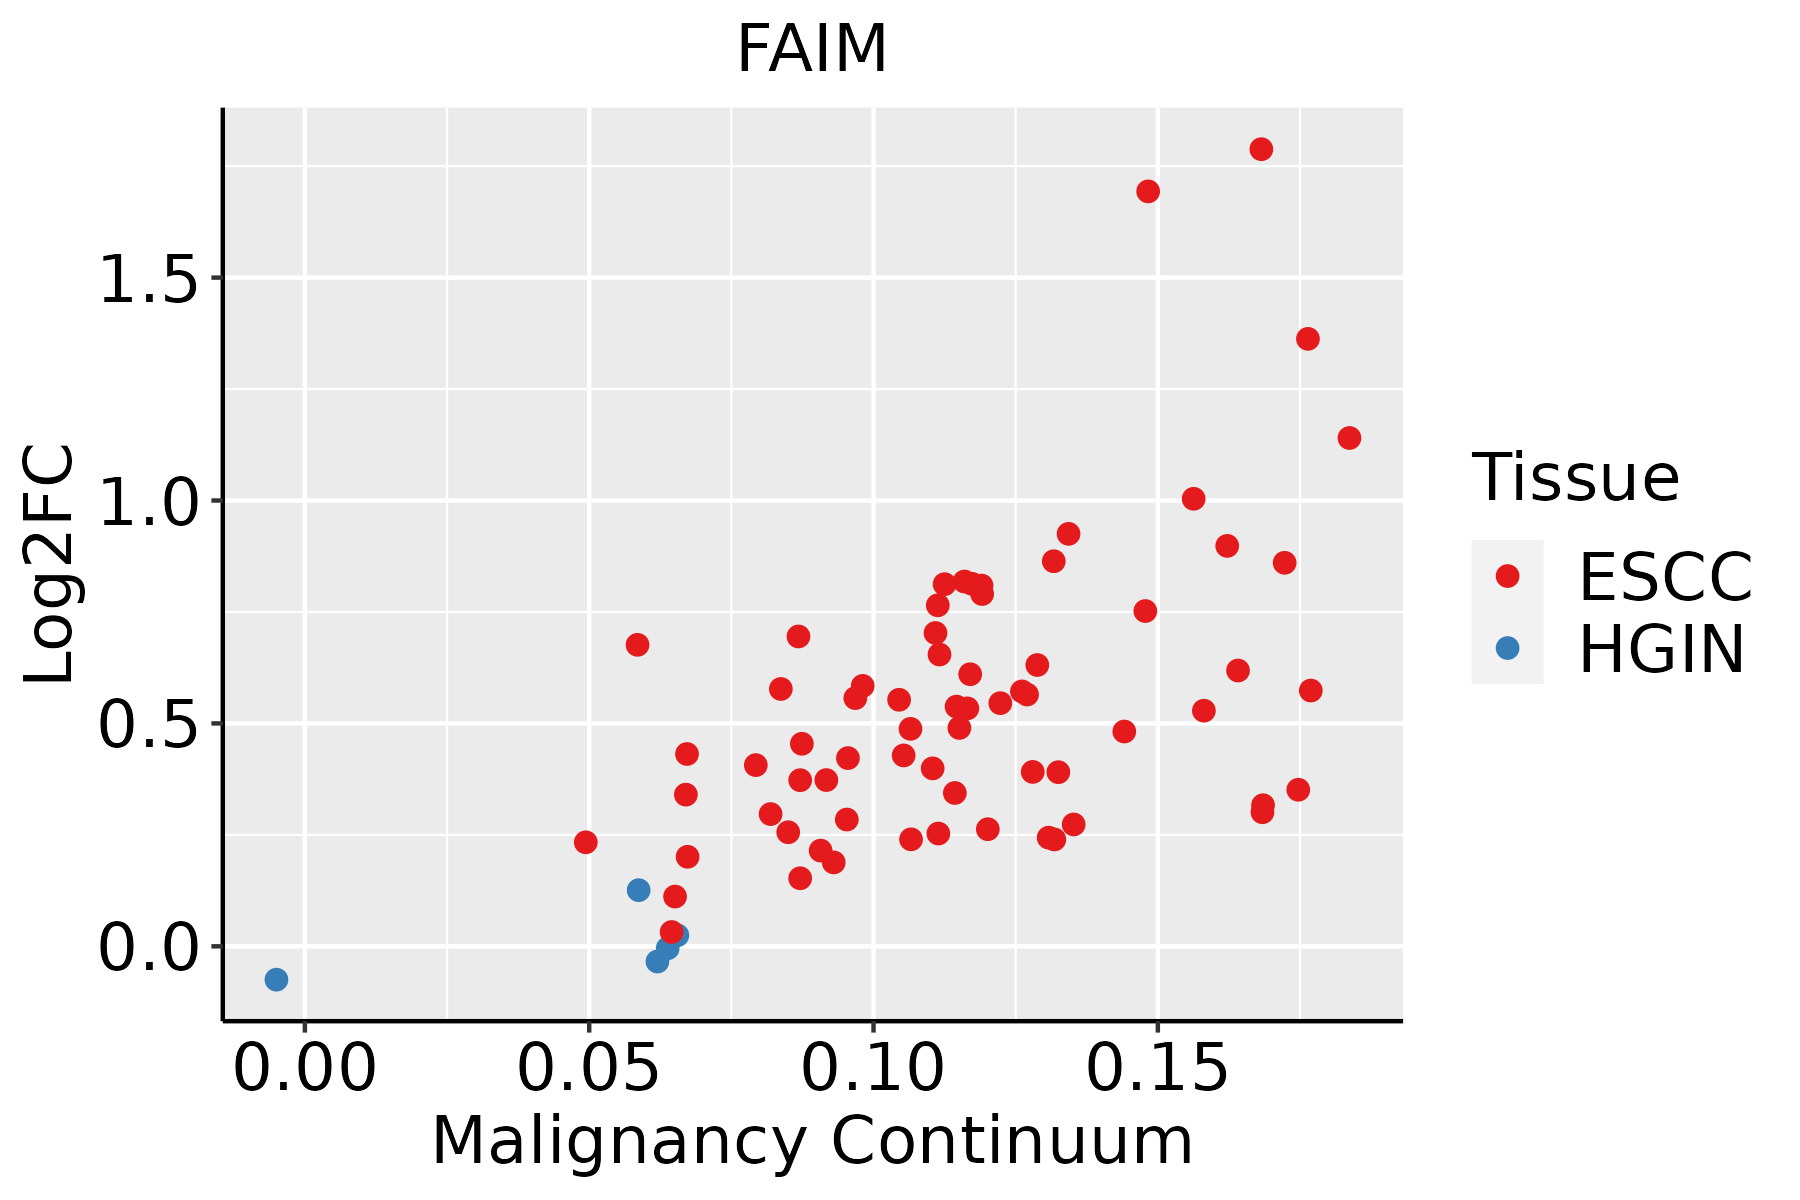
ESCC: Esophageal squamous cell carcinoma
HGIN: High-grade intraepithelial neoplasias
LGIN: Low-grade intraepithelial neoplasias
LiverThe image shows the transcriptomic changes along malignancy continuum.log2FC in expression of this searched gene in stem-like cells from each diseased tissue sample relative to stem-like cells in normal samples in each tissue plotted against the malignancy continuum. Samples are colored based on if they are from different disease stage.
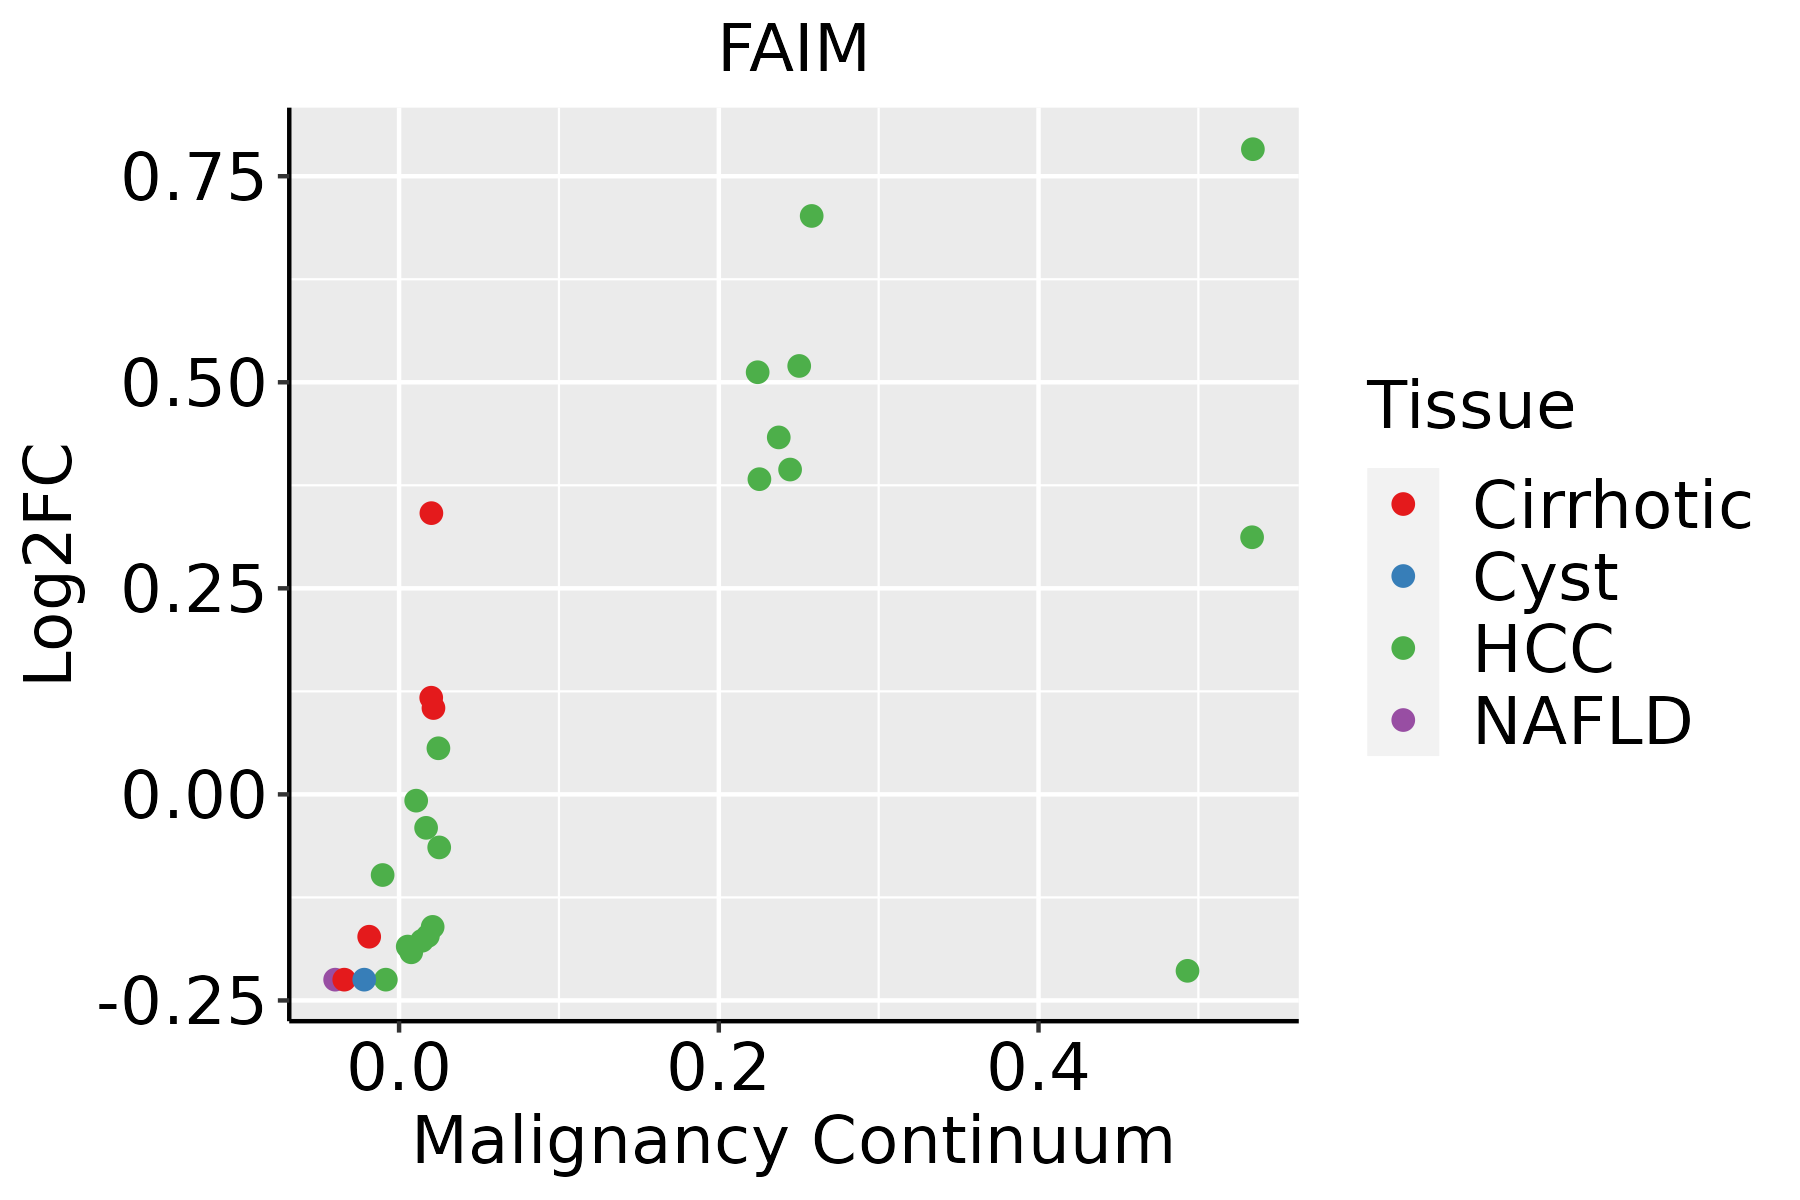
HCC: Hepatocellular carcinoma
NAFLD: Non-alcoholic fatty liver disease
Oral CavityThe image shows the transcriptomic changes along malignancy continuum.log2FC in expression of this searched gene in stem-like cells from each diseased tissue sample relative to stem-like cells in normal samples in each tissue plotted against the malignancy continuum. Samples are colored based on if they are from different disease stage.
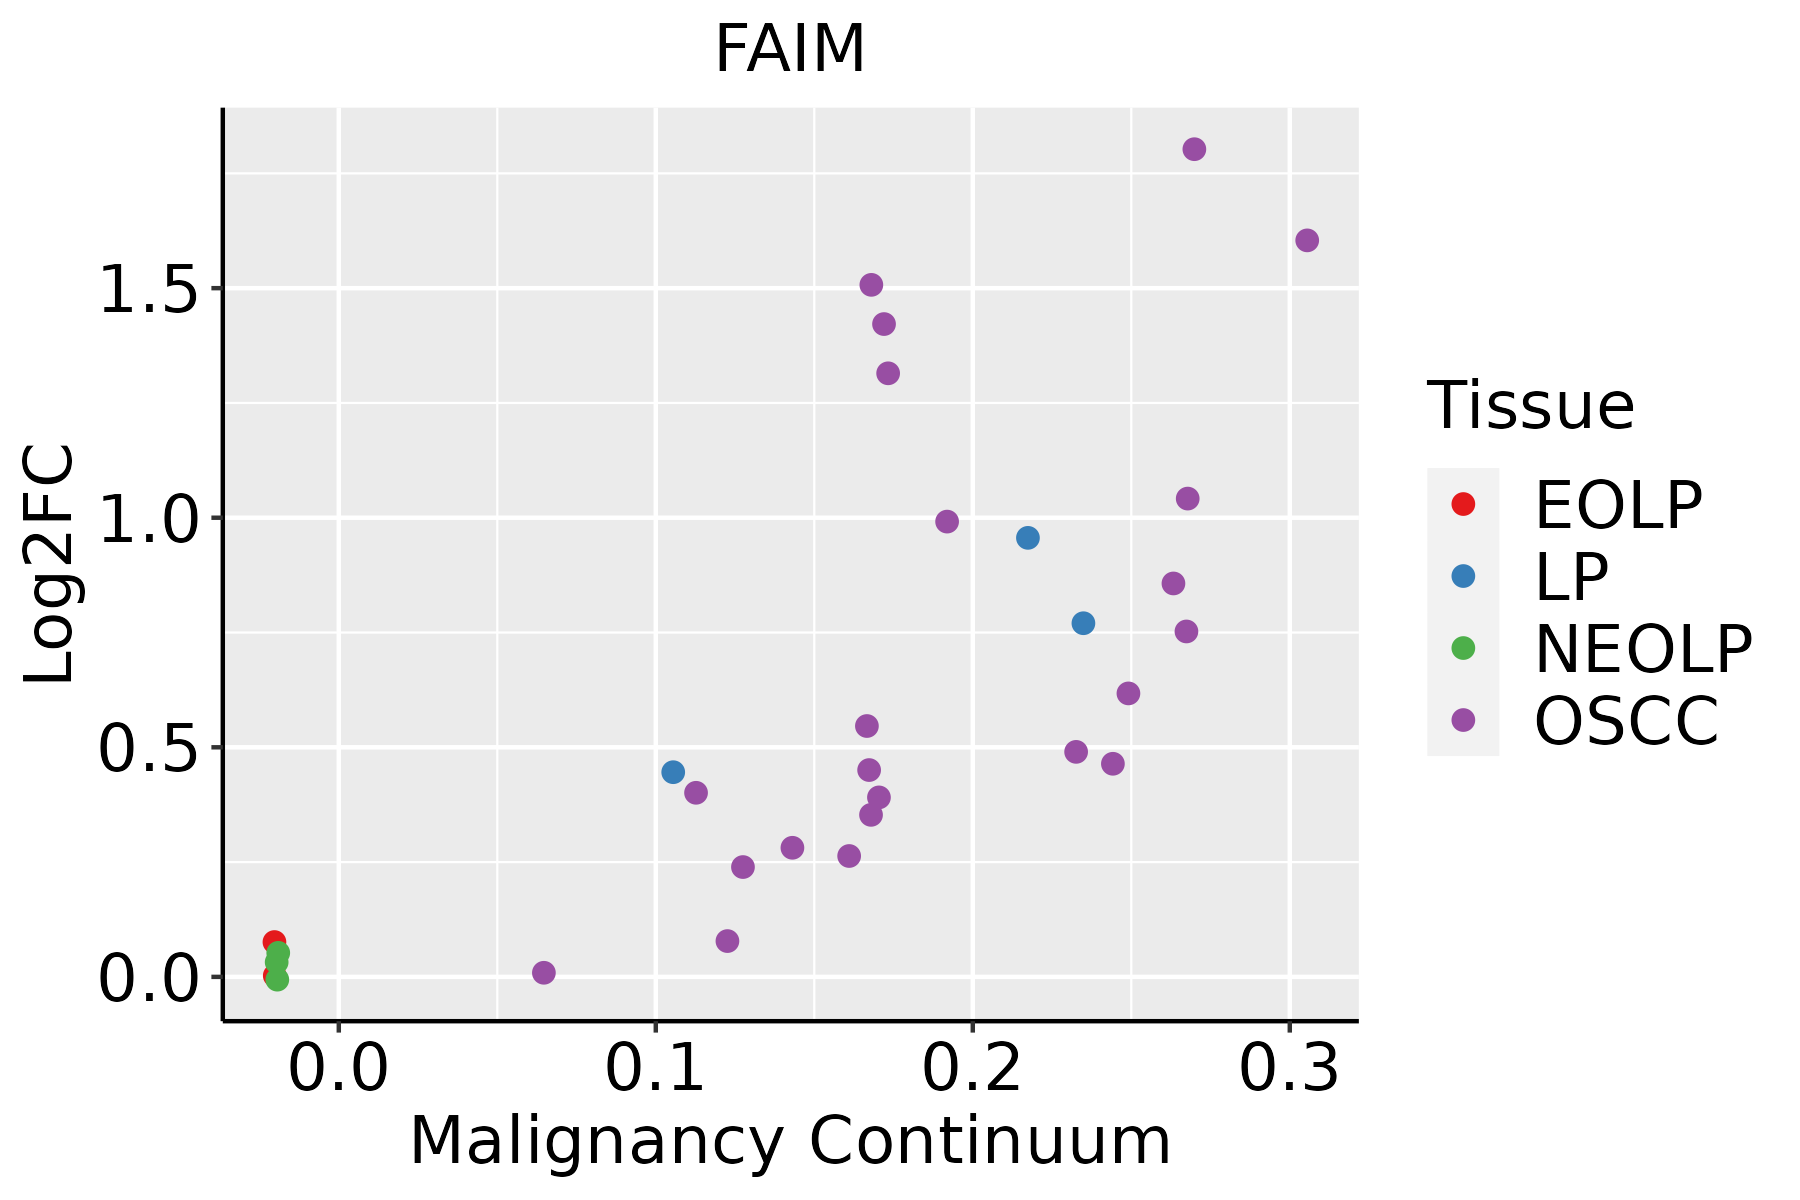
EOLP: Erosive Oral lichen planus
LP: leukoplakia
NEOLP: Non-erosive oral lichen planus
OSCC: Oral squamous cell carcinoma
SkinThe image shows the transcriptomic changes along malignancy continuum.log2FC in expression of this searched gene in stem-like cells from each diseased tissue sample relative to stem-like cells in normal samples in each tissue plotted against the malignancy continuum. Samples are colored based on if they are from different disease stage.
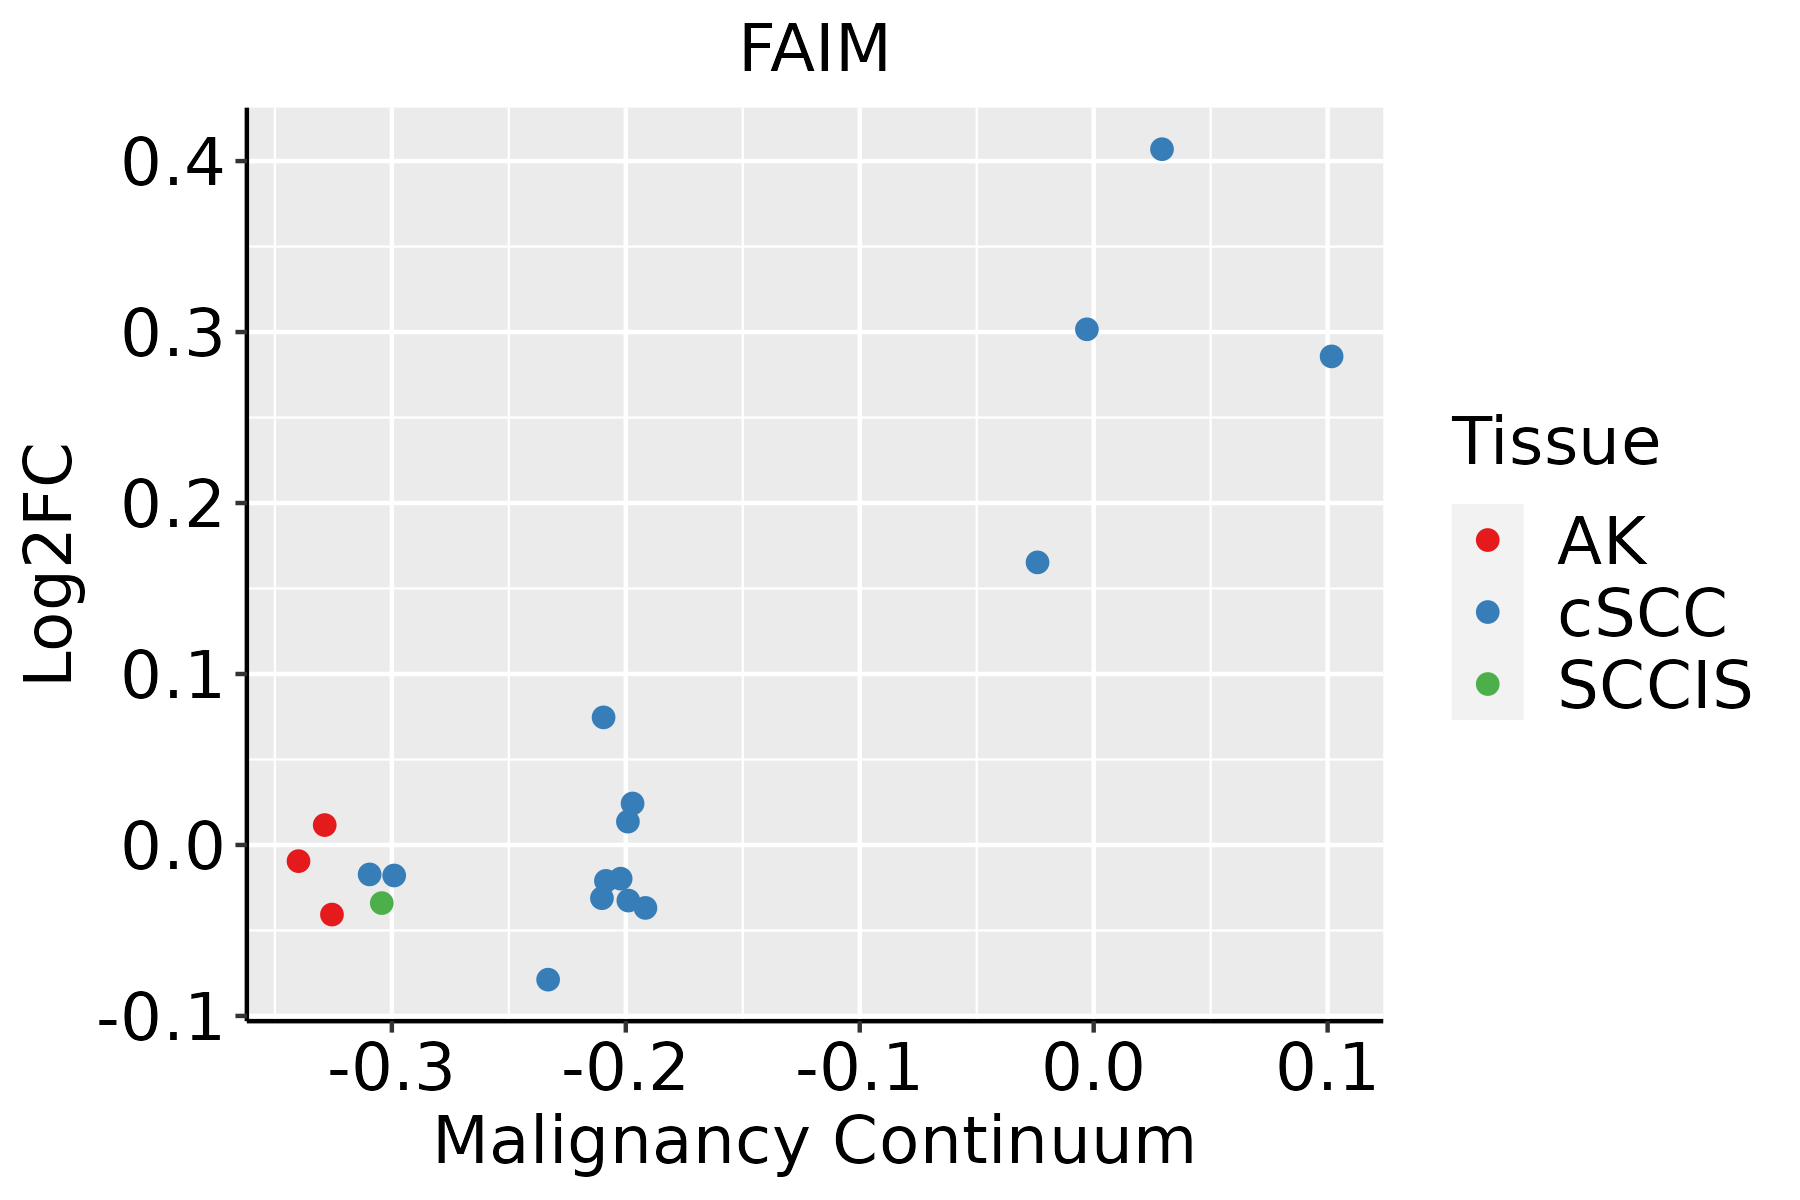
AK: Actinic keratosis
cSCC: Cutaneous squamous cell carcinoma
SCCIS:squamous cell carcinoma in situ
ThyroidThe image shows the transcriptomic changes along malignancy continuum.log2FC in expression of this searched gene in stem-like cells from each diseased tissue sample relative to stem-like cells in normal samples in each tissue plotted against the malignancy continuum. Samples are colored based on if they are from different disease stage.ATC: Anaplastic thyroid cancer
HT: Hashimoto's thyroiditis
PTC: Papillary thyroid cancer
∗log2FC in expression of this searched gene in stem-like cells from each diseased tissue sample relative to stem-like cells in normal samples in each tissue plotted against the malignancy continuum. Samples are colored based on if they are from different disease stage.

Top

Malignant transformation related pathway analysis

check buttonFind out the enriched GO biological processes and KEGG pathways involved in transition from healthy to precancer to cancer
check button Figure of enriched GO biological processes.
TissueDisease StageEnriched GO biological Processes
ColorectumADGO analysis - Figure of enriched GO biological processes: Top 15 enriched GO BP terms are showed in the bar plot of each disease state in each tissue. Each row represents a significant GO biological process which is colored according to the -log10(p.adjust).
ColorectumSERGO analysis - Figure of enriched GO biological processes: Top 15 enriched GO BP terms are showed in the bar plot of each disease state in each tissue. Each row represents a significant GO biological process which is colored according to the -log10(p.adjust).
ColorectumMSSGO analysis - Figure of enriched GO biological processes: Top 15 enriched GO BP terms are showed in the bar plot of each disease state in each tissue. Each row represents a significant GO biological process which is colored according to the -log10(p.adjust).
ColorectumMSI-HGO analysis - Figure of enriched GO biological processes: Top 15 enriched GO BP terms are showed in the bar plot of each disease state in each tissue. Each row represents a significant GO biological process which is colored according to the -log10(p.adjust).
ColorectumFAPGO analysis - Figure of enriched GO biological processes: Top 15 enriched GO BP terms are showed in the bar plot of each disease state in each tissue. Each row represents a significant GO biological process which is colored according to the -log10(p.adjust).
∗Top 15 enriched GO BP terms are showed in the bar plot of each disease state in each tissue. Each row represents a significant GO biological process which is colored according to the -log10(p.adjust).
Page: 1 2 3 4 5 6 7 8 9 

check button Enriched GO biological processes.
GO IDTissueDisease StageDescriptionGene RatioBg Ratiopvaluep.adjustCount
GO:200123327EsophagusHGINregulation of apoptotic signaling pathway97/2587356/187231.36e-111.57e-0997
GO:200123427EsophagusHGINnegative regulation of apoptotic signaling pathway59/2587224/187234.68e-072.07e-0559
GO:009719126EsophagusHGINextrinsic apoptotic signaling pathway56/2587219/187232.48e-068.80e-0556
GO:000724918EsophagusHGINI-kappaB kinase/NF-kappaB signaling67/2587281/187233.84e-061.29e-0467
GO:000862518EsophagusHGINextrinsic apoptotic signaling pathway via death domain receptors23/258782/187235.47e-047.73e-0323
GO:200123626EsophagusHGINregulation of extrinsic apoptotic signaling pathway36/2587151/187236.20e-048.58e-0336
GO:200123725EsophagusHGINnegative regulation of extrinsic apoptotic signaling pathway23/258797/187235.91e-034.78e-0223
GO:2001233111EsophagusESCCregulation of apoptotic signaling pathway256/8552356/187234.11e-241.04e-21256
GO:0097191111EsophagusESCCextrinsic apoptotic signaling pathway159/8552219/187234.12e-162.94e-14159
GO:2001234111EsophagusESCCnegative regulation of apoptotic signaling pathway161/8552224/187231.24e-158.09e-14161
GO:2001236111EsophagusESCCregulation of extrinsic apoptotic signaling pathway111/8552151/187232.97e-121.18e-10111
GO:000724919EsophagusESCCI-kappaB kinase/NF-kappaB signaling183/8552281/187233.02e-111.01e-09183
GO:2001237111EsophagusESCCnegative regulation of extrinsic apoptotic signaling pathway69/855297/187233.23e-074.55e-0669
GO:000862519EsophagusESCCextrinsic apoptotic signaling pathway via death domain receptors59/855282/187231.23e-061.52e-0559
GO:001072010EsophagusESCCpositive regulation of cell development172/8552298/187231.74e-051.55e-04172
GO:005076710EsophagusESCCregulation of neurogenesis203/8552364/187236.10e-054.68e-04203
GO:00507697EsophagusESCCpositive regulation of neurogenesis131/8552225/187239.71e-056.90e-04131
GO:190204117EsophagusESCCregulation of extrinsic apoptotic signaling pathway via death domain receptors35/855249/187232.32e-041.44e-0335
GO:00519606EsophagusESCCregulation of nervous system development237/8552443/187235.02e-042.78e-03237
GO:00519625EsophagusESCCpositive regulation of nervous system development149/8552272/187231.50e-037.06e-03149
Page: 1 2 3 4 5 6 

check button Enriched KEGG pathways.
Pathway IDTissueDisease StageDescriptionGene RatioBg Ratiopvaluep.adjustqvalueCount
Page: 1 

Top

Cell-cell communication analysis

check buttonIdentification of potential cell-cell interactions between two cell types and their ligand-receptor pairs for different disease states
LigandReceptorLRpairPathwayTissueDisease Stage
Page: 1 

Top

Single-cell gene regulatory network inference analysis

check buttonFind out the significant the regulons (TFs) and the target genes of each regulon across cell types for different disease states
TFCell TypeTissueDisease StageTarget GeneRSSRegulon Activity
∗The dot plots of a searched regulon are shown for all cell subpopulations in each disease state of each tissue based on the regulon specific score inferred using pySCENIC and by calculating the average expression.
Page: 1 

Top

Somatic mutation of malignant transformation related genes

check buttonAnnotation of somatic variants for genes involved in malignant transformation
Hugo SymbolVariant ClassVariant ClassificationdbSNP RSHGVScHGVSpHGVSp ShortSWISSPROTBIOTYPESIFTPolyPhenTumor Sample BarcodeTissueHistologySexAgeStageTherapy TypesDrugsOutcome
FAIMSNVMissense_Mutationnovelc.191G>Ap.Arg64Glnp.R64QQ9NVQ4protein_codingdeleterious(0)probably_damaging(1)TCGA-5L-AAT0-01Breastbreast invasive carcinomaFemale<65I/IIHormone TherapytamoxiphenSD
FAIMSNVMissense_Mutationnovelc.172N>Tp.Gly58Trpp.G58WQ9NVQ4protein_codingdeleterious(0)probably_damaging(1)TCGA-E2-A14N-01Breastbreast invasive carcinomaFemale<65I/IIChemotherapycyclophosphamideSD
FAIMinsertionNonsense_Mutationnovelc.586_587insAGGCTTAGAp.Gly196delinsGluAlaTerArgp.G196delinsEA*RQ9NVQ4protein_codingTCGA-AO-A128-01Breastbreast invasive carcinomaFemale<65I/IIChemotherapydoxorubicinSD
FAIMSNVMissense_Mutationc.217N>Ap.Glu73Lysp.E73KQ9NVQ4protein_codingdeleterious(0.03)benign(0.006)TCGA-C5-A1M7-01Cervixcervical & endocervical cancerFemale<65I/IIUnknownUnknownSD
FAIMSNVMissense_Mutationnovelc.76N>Gp.Leu26Valp.L26VQ9NVQ4protein_codingtolerated_low_confidence(0.19)benign(0.02)TCGA-JW-A5VL-01Cervixcervical & endocervical cancerFemale<65I/IIUnknownUnknownSD
FAIMSNVMissense_Mutationc.569N>Ap.Ser190Asnp.S190NQ9NVQ4protein_codingdeleterious(0)probably_damaging(0.973)TCGA-DM-A28K-01Colorectumcolon adenocarcinomaMale>=65I/IIUnknownUnknownSD
FAIMSNVMissense_Mutationrs767931243c.260C>Tp.Thr87Ilep.T87IQ9NVQ4protein_codingtolerated(0.12)benign(0.222)TCGA-DY-A1DD-01Colorectumrectum adenocarcinomaFemale>=65III/IVUnknownUnknownSD
FAIMSNVMissense_Mutationnovelc.106N>Gp.Thr36Alap.T36AQ9NVQ4protein_codingtolerated(0.42)benign(0.015)TCGA-A5-A0G2-01Endometriumuterine corpus endometrioid carcinomaFemale<65III/IVUnknownUnknownSD
FAIMSNVMissense_Mutationnovelc.48N>Gp.His16Glnp.H16QQ9NVQ4protein_codingtolerated_low_confidence(0.47)benign(0.018)TCGA-A5-A1OF-01Endometriumuterine corpus endometrioid carcinomaFemale<65I/IIUnknownUnknownSD
FAIMSNVMissense_Mutationnovelc.635N>Tp.Ala212Valp.A212VQ9NVQ4protein_codingdeleterious(0.02)benign(0.015)TCGA-A5-A2K3-01Endometriumuterine corpus endometrioid carcinomaFemale>=65I/IIChemotherapycarboplatinSD
Page: 1 2 3 

Top

Related drugs of malignant transformation related genes

check buttonIdentification of chemicals and drugs interact with genes involved in malignant transfromation
(DGIdb 4.0)
Entrez IDSymbolCategoryInteraction TypesDrug Claim NameDrug NamePMIDs
Page: 1