
|
|||||
|
 | |
| |
| |
| |
| |
| |
|
Gene: FAHD2B |
Gene summary for FAHD2B |
| Gene information | Species | Human | Gene symbol | FAHD2B | Gene ID | 151313 |
| Gene name | fumarylacetoacetate hydrolase domain containing 2B | |
| Gene Alias | FAHD2B | |
| Cytomap | 2q11.2 | |
| Gene Type | protein-coding | GO ID | GO:0003674 | UniProtAcc | Q6P2I3 |
Top |
Malignant transformation analysis |
| Identification of the aberrant gene expression in precancerous and cancerous lesions by comparing the gene expression of stem-like cells in diseased tissues with normal stem cells |
| Entrez ID | Symbol | Replicates | Species | Organ | Tissue | Adj P-value | Log2FC | Malignancy |
| 151313 | FAHD2B | LZE2T | Human | Esophagus | ESCC | 6.24e-04 | 4.30e-01 | 0.082 |
| 151313 | FAHD2B | LZE4T | Human | Esophagus | ESCC | 1.29e-12 | 2.72e-01 | 0.0811 |
| 151313 | FAHD2B | LZE7T | Human | Esophagus | ESCC | 8.15e-04 | 2.99e-01 | 0.0667 |
| 151313 | FAHD2B | LZE8T | Human | Esophagus | ESCC | 1.53e-02 | 1.09e-01 | 0.067 |
| 151313 | FAHD2B | LZE22T | Human | Esophagus | ESCC | 1.78e-02 | 3.53e-01 | 0.068 |
| 151313 | FAHD2B | LZE24T | Human | Esophagus | ESCC | 1.74e-09 | 2.30e-01 | 0.0596 |
| 151313 | FAHD2B | P1T-E | Human | Esophagus | ESCC | 3.87e-08 | 3.29e-01 | 0.0875 |
| 151313 | FAHD2B | P2T-E | Human | Esophagus | ESCC | 1.35e-25 | 4.87e-01 | 0.1177 |
| 151313 | FAHD2B | P4T-E | Human | Esophagus | ESCC | 1.98e-18 | 3.90e-01 | 0.1323 |
| 151313 | FAHD2B | P5T-E | Human | Esophagus | ESCC | 2.51e-11 | 1.30e-01 | 0.1327 |
| 151313 | FAHD2B | P8T-E | Human | Esophagus | ESCC | 4.45e-10 | 2.67e-01 | 0.0889 |
| 151313 | FAHD2B | P10T-E | Human | Esophagus | ESCC | 2.50e-27 | 4.71e-01 | 0.116 |
| 151313 | FAHD2B | P11T-E | Human | Esophagus | ESCC | 3.68e-06 | 5.94e-01 | 0.1426 |
| 151313 | FAHD2B | P12T-E | Human | Esophagus | ESCC | 1.23e-35 | 5.28e-01 | 0.1122 |
| 151313 | FAHD2B | P15T-E | Human | Esophagus | ESCC | 1.75e-09 | 1.50e-01 | 0.1149 |
| 151313 | FAHD2B | P16T-E | Human | Esophagus | ESCC | 3.68e-25 | 5.06e-01 | 0.1153 |
| 151313 | FAHD2B | P17T-E | Human | Esophagus | ESCC | 3.33e-07 | 2.94e-01 | 0.1278 |
| 151313 | FAHD2B | P20T-E | Human | Esophagus | ESCC | 2.03e-20 | 3.44e-01 | 0.1124 |
| 151313 | FAHD2B | P21T-E | Human | Esophagus | ESCC | 3.01e-24 | 5.13e-01 | 0.1617 |
| 151313 | FAHD2B | P22T-E | Human | Esophagus | ESCC | 1.46e-31 | 5.41e-01 | 0.1236 |
| Page: 1 2 3 4 |
| Tissue | Expression Dynamics | Abbreviation |
| Esophagus | 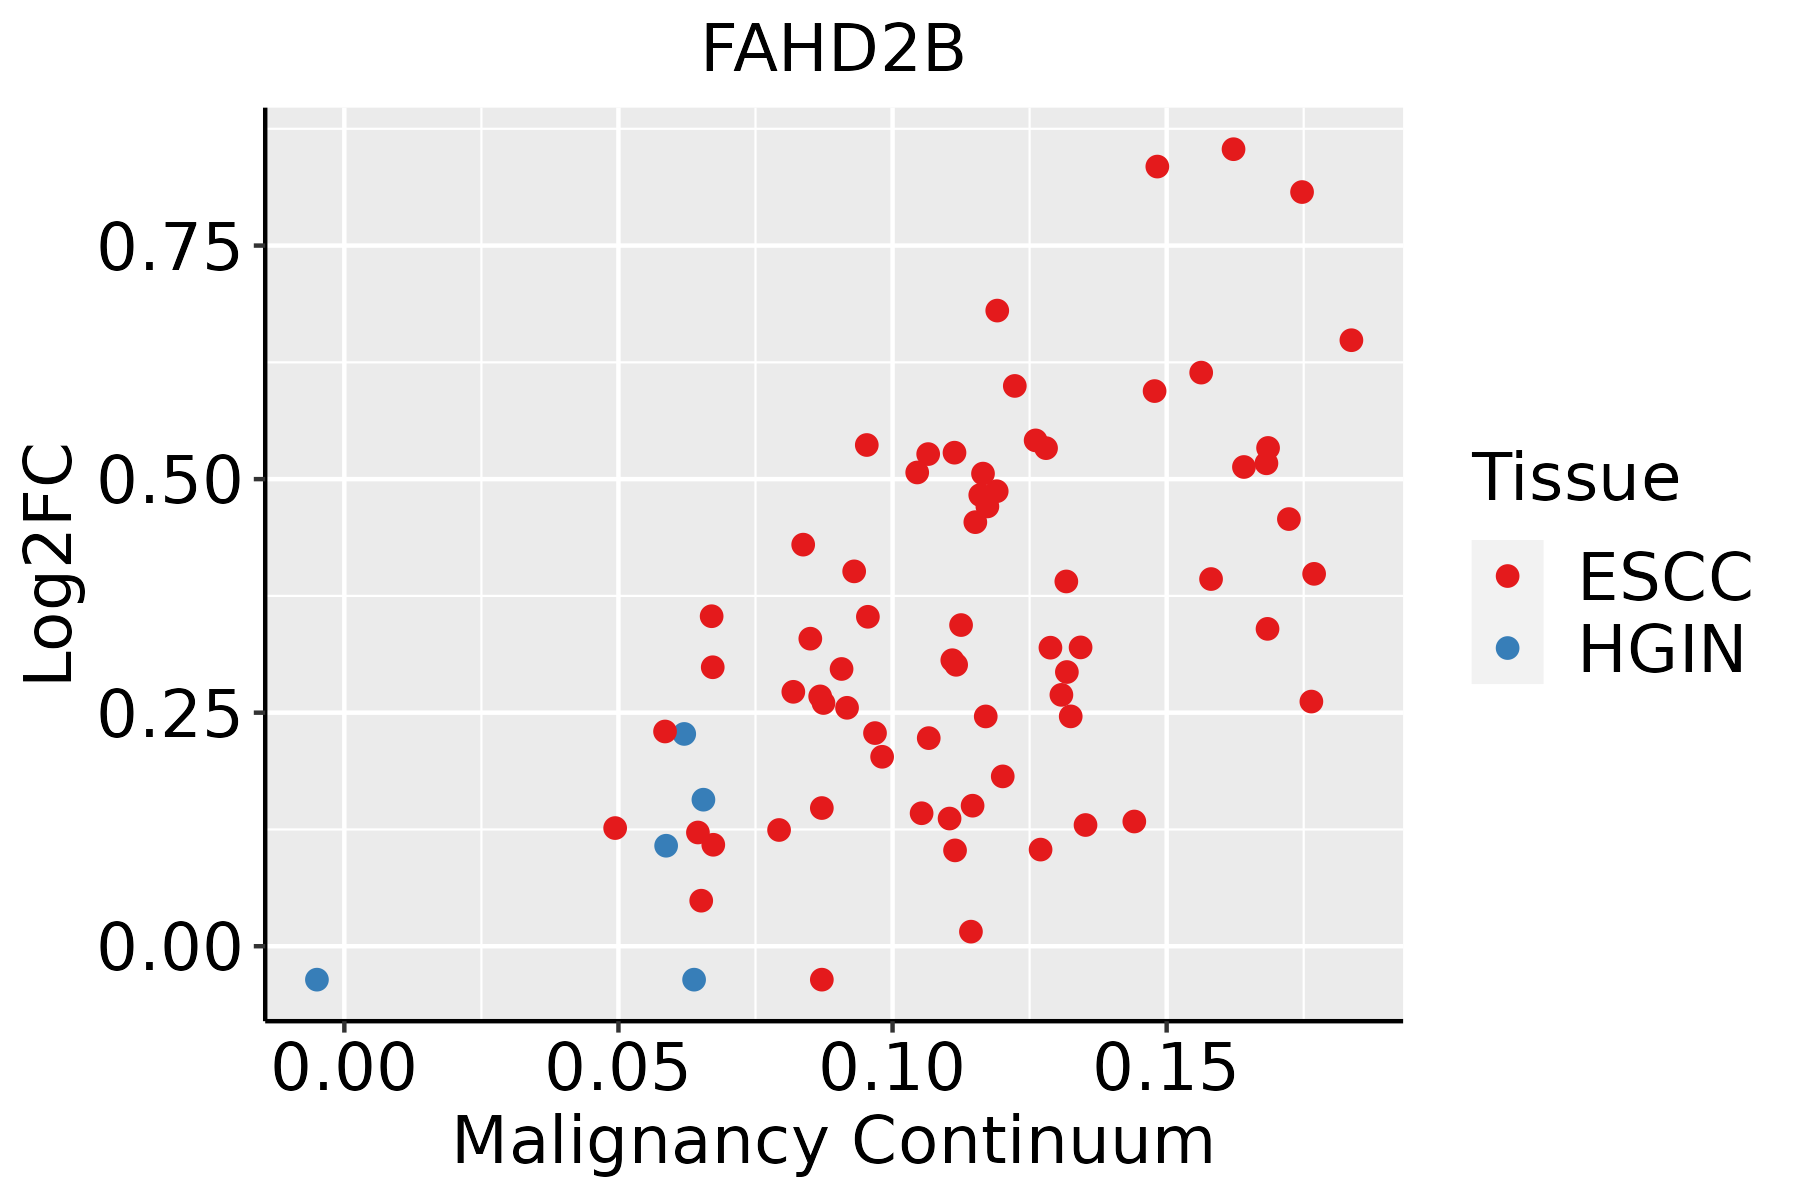 | ESCC: Esophageal squamous cell carcinoma |
| HGIN: High-grade intraepithelial neoplasias | ||
| LGIN: Low-grade intraepithelial neoplasias | ||
| Oral Cavity | 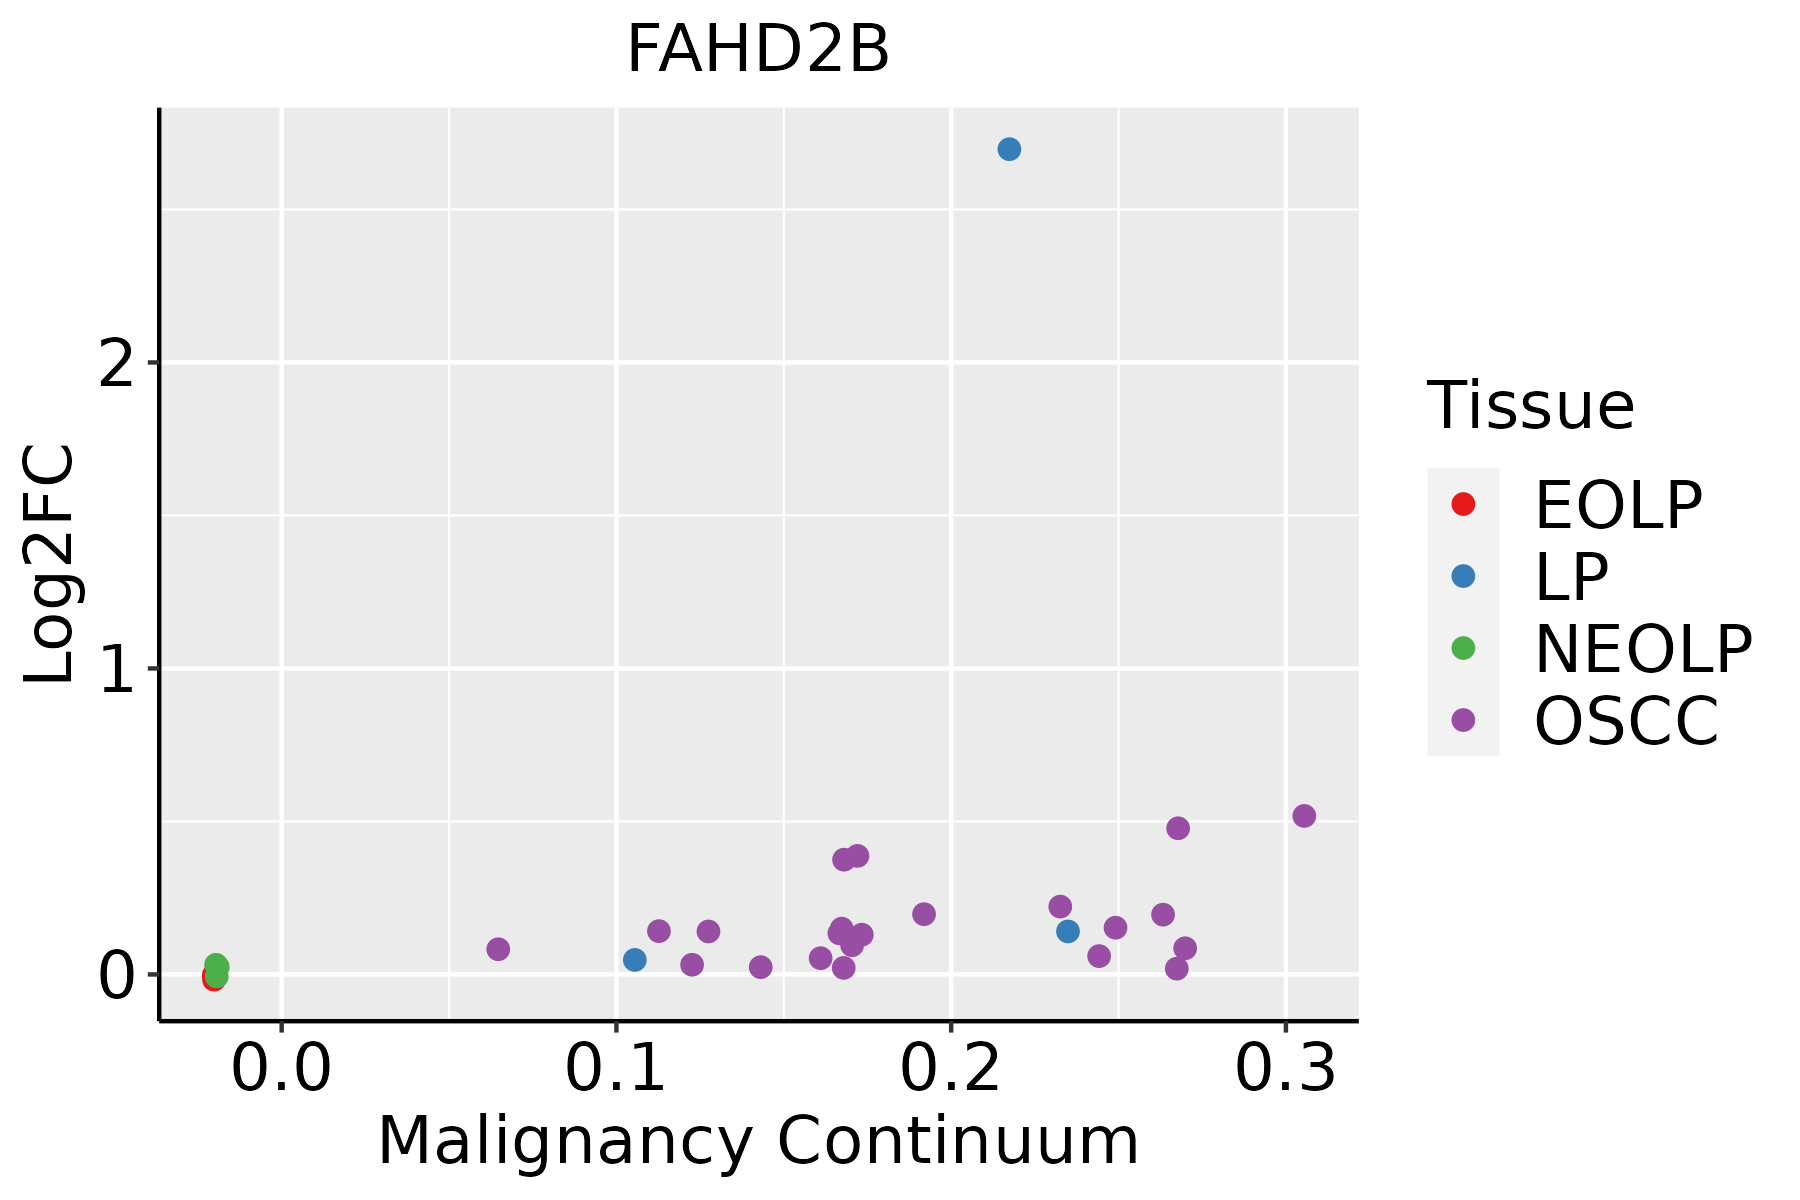 | EOLP: Erosive Oral lichen planus |
| LP: leukoplakia | ||
| NEOLP: Non-erosive oral lichen planus | ||
| OSCC: Oral squamous cell carcinoma |
| ∗log2FC in expression of this searched gene in stem-like cells from each diseased tissue sample relative to stem-like cells in normal samples in each tissue plotted against the malignancy continuum. Samples are colored based on if they are from different disease stage. |
Top |
Malignant transformation related pathway analysis |
| Find out the enriched GO biological processes and KEGG pathways involved in transition from healthy to precancer to cancer |
| Tissue | Disease Stage | Enriched GO biological Processes |
| Colorectum | AD |  |
| Colorectum | SER |  |
| Colorectum | MSS |  |
| Colorectum | MSI-H |  |
| Colorectum | FAP |  |
| ∗Top 15 enriched GO BP terms are showed in the bar plot of each disease state in each tissue. Each row represents a significant GO biological process which is colored according to the -log10(p.adjust). |
| Page: 1 2 3 4 5 6 7 8 9 |
| GO ID | Tissue | Disease Stage | Description | Gene Ratio | Bg Ratio | pvalue | p.adjust | Count |
| Page: 1 |
| Pathway ID | Tissue | Disease Stage | Description | Gene Ratio | Bg Ratio | pvalue | p.adjust | qvalue | Count |
| Page: 1 |
Top |
Cell-cell communication analysis |
| Identification of potential cell-cell interactions between two cell types and their ligand-receptor pairs for different disease states |
| Ligand | Receptor | LRpair | Pathway | Tissue | Disease Stage |
| Page: 1 |
Top |
Single-cell gene regulatory network inference analysis |
| Find out the significant the regulons (TFs) and the target genes of each regulon across cell types for different disease states |
| TF | Cell Type | Tissue | Disease Stage | Target Gene | RSS | Regulon Activity |
| ∗The dot plots of a searched regulon are shown for all cell subpopulations in each disease state of each tissue based on the regulon specific score inferred using pySCENIC and by calculating the average expression. |
| Page: 1 |
Top |
Somatic mutation of malignant transformation related genes |
| Annotation of somatic variants for genes involved in malignant transformation |
| Hugo Symbol | Variant Class | Variant Classification | dbSNP RS | HGVSc | HGVSp | HGVSp Short | SWISSPROT | BIOTYPE | SIFT | PolyPhen | Tumor Sample Barcode | Tissue | Histology | Sex | Age | Stage | Therapy Types | Drugs | Outcome |
| FAHD2B | SNV | Missense_Mutation | novel | c.119C>T | p.Pro40Leu | p.P40L | Q6P2I3 | protein_coding | tolerated(0.14) | benign(0.007) | TCGA-2W-A8YY-01 | Cervix | cervical & endocervical cancer | Female | <65 | I/II | Chemotherapy | cisplatin | CR |
| FAHD2B | insertion | Frame_Shift_Ins | novel | c.160_161insCTTACTT | p.Asn54ThrfsTer8 | p.N54Tfs*8 | Q6P2I3 | protein_coding | TCGA-AM-5820-01 | Colorectum | colon adenocarcinoma | Female | <65 | I/II | Unknown | Unknown | SD | ||
| FAHD2B | SNV | Missense_Mutation | novel | c.200N>T | p.Thr67Met | p.T67M | Q6P2I3 | protein_coding | tolerated(0.11) | benign(0) | TCGA-A5-A2K4-01 | Endometrium | uterine corpus endometrioid carcinoma | Female | >=65 | III/IV | Chemotherapy | carboplatin | PD |
| FAHD2B | SNV | Missense_Mutation | rs374002655 | c.550N>A | p.Gly184Ser | p.G184S | Q6P2I3 | protein_coding | deleterious(0) | probably_damaging(1) | TCGA-AJ-A3EK-01 | Endometrium | uterine corpus endometrioid carcinoma | Female | <65 | I/II | Chemotherapy | carboplatin | CR |
| FAHD2B | SNV | Missense_Mutation | novel | c.616N>A | p.Leu206Met | p.L206M | Q6P2I3 | protein_coding | deleterious(0.05) | probably_damaging(1) | TCGA-AX-A06F-01 | Endometrium | uterine corpus endometrioid carcinoma | Female | <65 | III/IV | Chemotherapy | carboplatin | SD |
| FAHD2B | SNV | Missense_Mutation | rs757537768 | c.281N>T | p.Ser94Leu | p.S94L | Q6P2I3 | protein_coding | tolerated(0.1) | possibly_damaging(0.642) | TCGA-AX-A1C5-01 | Endometrium | uterine corpus endometrioid carcinoma | Female | <65 | III/IV | Unspecific | Carboplatin | SD |
| FAHD2B | SNV | Missense_Mutation | c.35N>T | p.Ala12Val | p.A12V | Q6P2I3 | protein_coding | tolerated(0.34) | benign(0.003) | TCGA-BS-A0TC-01 | Endometrium | uterine corpus endometrioid carcinoma | Female | >=65 | I/II | Unknown | Unknown | SD | |
| FAHD2B | SNV | Missense_Mutation | novel | c.575N>T | p.Ser192Ile | p.S192I | Q6P2I3 | protein_coding | deleterious(0) | probably_damaging(0.977) | TCGA-DF-A2KN-01 | Endometrium | uterine corpus endometrioid carcinoma | Female | Unknown | I/II | Unknown | Unknown | SD |
| FAHD2B | SNV | Missense_Mutation | novel | c.321N>T | p.Lys107Asn | p.K107N | Q6P2I3 | protein_coding | deleterious(0) | probably_damaging(0.965) | TCGA-DF-A2KN-01 | Endometrium | uterine corpus endometrioid carcinoma | Female | Unknown | I/II | Unknown | Unknown | SD |
| FAHD2B | SNV | Missense_Mutation | rs371910616 | c.634G>A | p.Asp212Asn | p.D212N | Q6P2I3 | protein_coding | deleterious(0.02) | possibly_damaging(0.821) | TCGA-E6-A1LX-01 | Endometrium | uterine corpus endometrioid carcinoma | Female | <65 | I/II | Unknown | Unknown | SD |
| Page: 1 2 3 |
Top |
Related drugs of malignant transformation related genes |
| Identification of chemicals and drugs interact with genes involved in malignant transfromation |
| (DGIdb 4.0) |
| Entrez ID | Symbol | Category | Interaction Types | Drug Claim Name | Drug Name | PMIDs |
| Page: 1 |

Copyright 2023-Present -The University of Texas Health Science Center at Houston |