
|
|||||
|
 | |
| |
| |
| |
| |
| |
|
Gene: FAHD2A |
Gene summary for FAHD2A |
| Gene information | Species | Human | Gene symbol | FAHD2A | Gene ID | 51011 |
| Gene name | fumarylacetoacetate hydrolase domain containing 2A | |
| Gene Alias | CGI-105 | |
| Cytomap | 2q11.1 | |
| Gene Type | protein-coding | GO ID | GO:0003674 | UniProtAcc | A0A024RE27 |
Top |
Malignant transformation analysis |
| Identification of the aberrant gene expression in precancerous and cancerous lesions by comparing the gene expression of stem-like cells in diseased tissues with normal stem cells |
| Entrez ID | Symbol | Replicates | Species | Organ | Tissue | Adj P-value | Log2FC | Malignancy |
| 51011 | FAHD2A | LZE4T | Human | Esophagus | ESCC | 2.18e-08 | 2.42e-01 | 0.0811 |
| 51011 | FAHD2A | LZE7T | Human | Esophagus | ESCC | 3.07e-04 | 2.74e-01 | 0.0667 |
| 51011 | FAHD2A | LZE8T | Human | Esophagus | ESCC | 3.59e-03 | 3.93e-02 | 0.067 |
| 51011 | FAHD2A | LZE22T | Human | Esophagus | ESCC | 1.26e-04 | 1.86e-01 | 0.068 |
| 51011 | FAHD2A | LZE24T | Human | Esophagus | ESCC | 6.31e-06 | 1.92e-01 | 0.0596 |
| 51011 | FAHD2A | LZE21T | Human | Esophagus | ESCC | 4.82e-06 | 1.83e-01 | 0.0655 |
| 51011 | FAHD2A | LZE6T | Human | Esophagus | ESCC | 1.38e-03 | 2.03e-01 | 0.0845 |
| 51011 | FAHD2A | P1T-E | Human | Esophagus | ESCC | 3.10e-08 | 4.62e-01 | 0.0875 |
| 51011 | FAHD2A | P2T-E | Human | Esophagus | ESCC | 7.11e-22 | 3.22e-01 | 0.1177 |
| 51011 | FAHD2A | P4T-E | Human | Esophagus | ESCC | 7.26e-13 | 3.33e-01 | 0.1323 |
| 51011 | FAHD2A | P5T-E | Human | Esophagus | ESCC | 5.54e-19 | 1.71e-01 | 0.1327 |
| 51011 | FAHD2A | P8T-E | Human | Esophagus | ESCC | 1.42e-06 | 9.63e-02 | 0.0889 |
| 51011 | FAHD2A | P9T-E | Human | Esophagus | ESCC | 1.22e-11 | 1.47e-01 | 0.1131 |
| 51011 | FAHD2A | P10T-E | Human | Esophagus | ESCC | 4.87e-24 | 4.30e-01 | 0.116 |
| 51011 | FAHD2A | P11T-E | Human | Esophagus | ESCC | 1.25e-09 | 2.82e-01 | 0.1426 |
| 51011 | FAHD2A | P12T-E | Human | Esophagus | ESCC | 1.23e-24 | 4.98e-01 | 0.1122 |
| 51011 | FAHD2A | P15T-E | Human | Esophagus | ESCC | 2.71e-18 | 4.55e-01 | 0.1149 |
| 51011 | FAHD2A | P16T-E | Human | Esophagus | ESCC | 4.45e-22 | 3.95e-01 | 0.1153 |
| 51011 | FAHD2A | P17T-E | Human | Esophagus | ESCC | 3.78e-08 | 3.49e-01 | 0.1278 |
| 51011 | FAHD2A | P20T-E | Human | Esophagus | ESCC | 1.75e-09 | 1.62e-01 | 0.1124 |
| Page: 1 2 3 4 5 |
| Tissue | Expression Dynamics | Abbreviation |
| Esophagus | 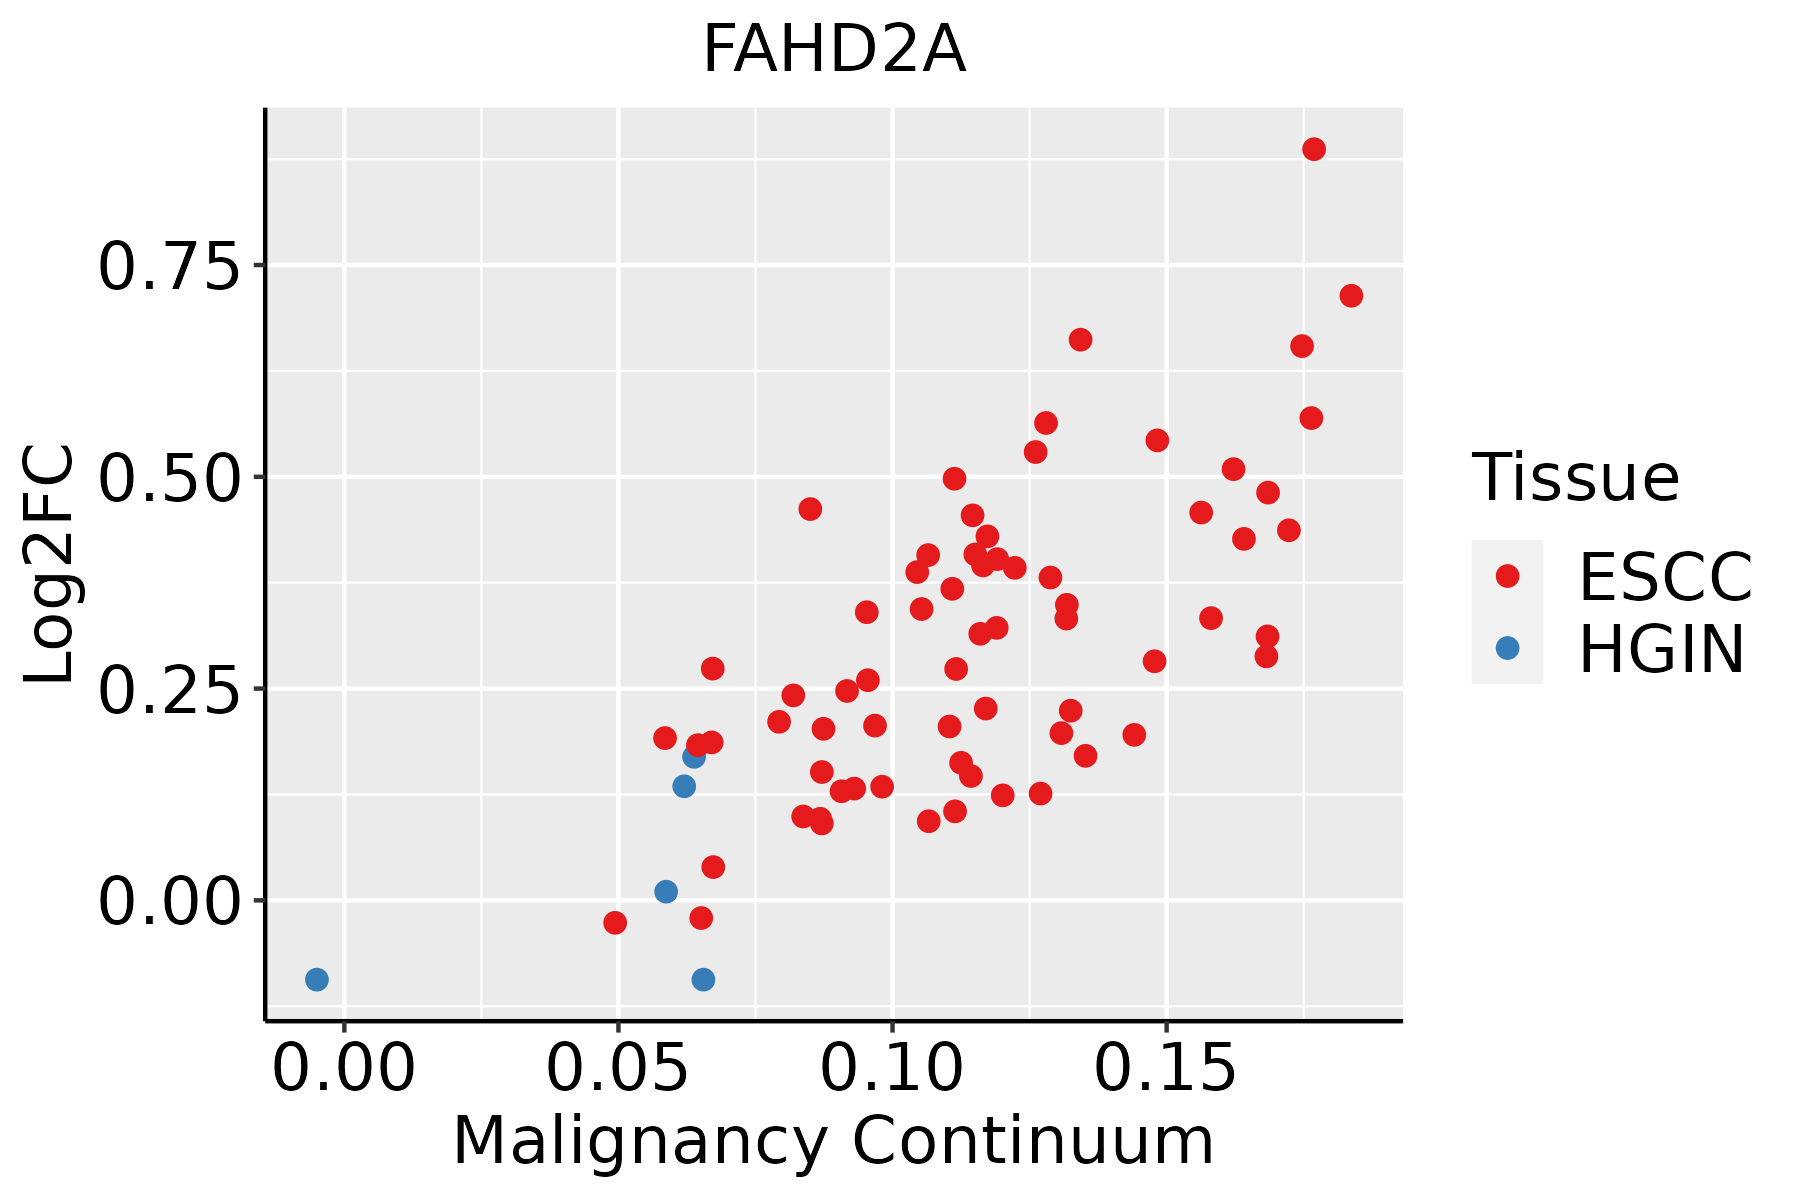 | ESCC: Esophageal squamous cell carcinoma |
| HGIN: High-grade intraepithelial neoplasias | ||
| LGIN: Low-grade intraepithelial neoplasias | ||
| Liver | 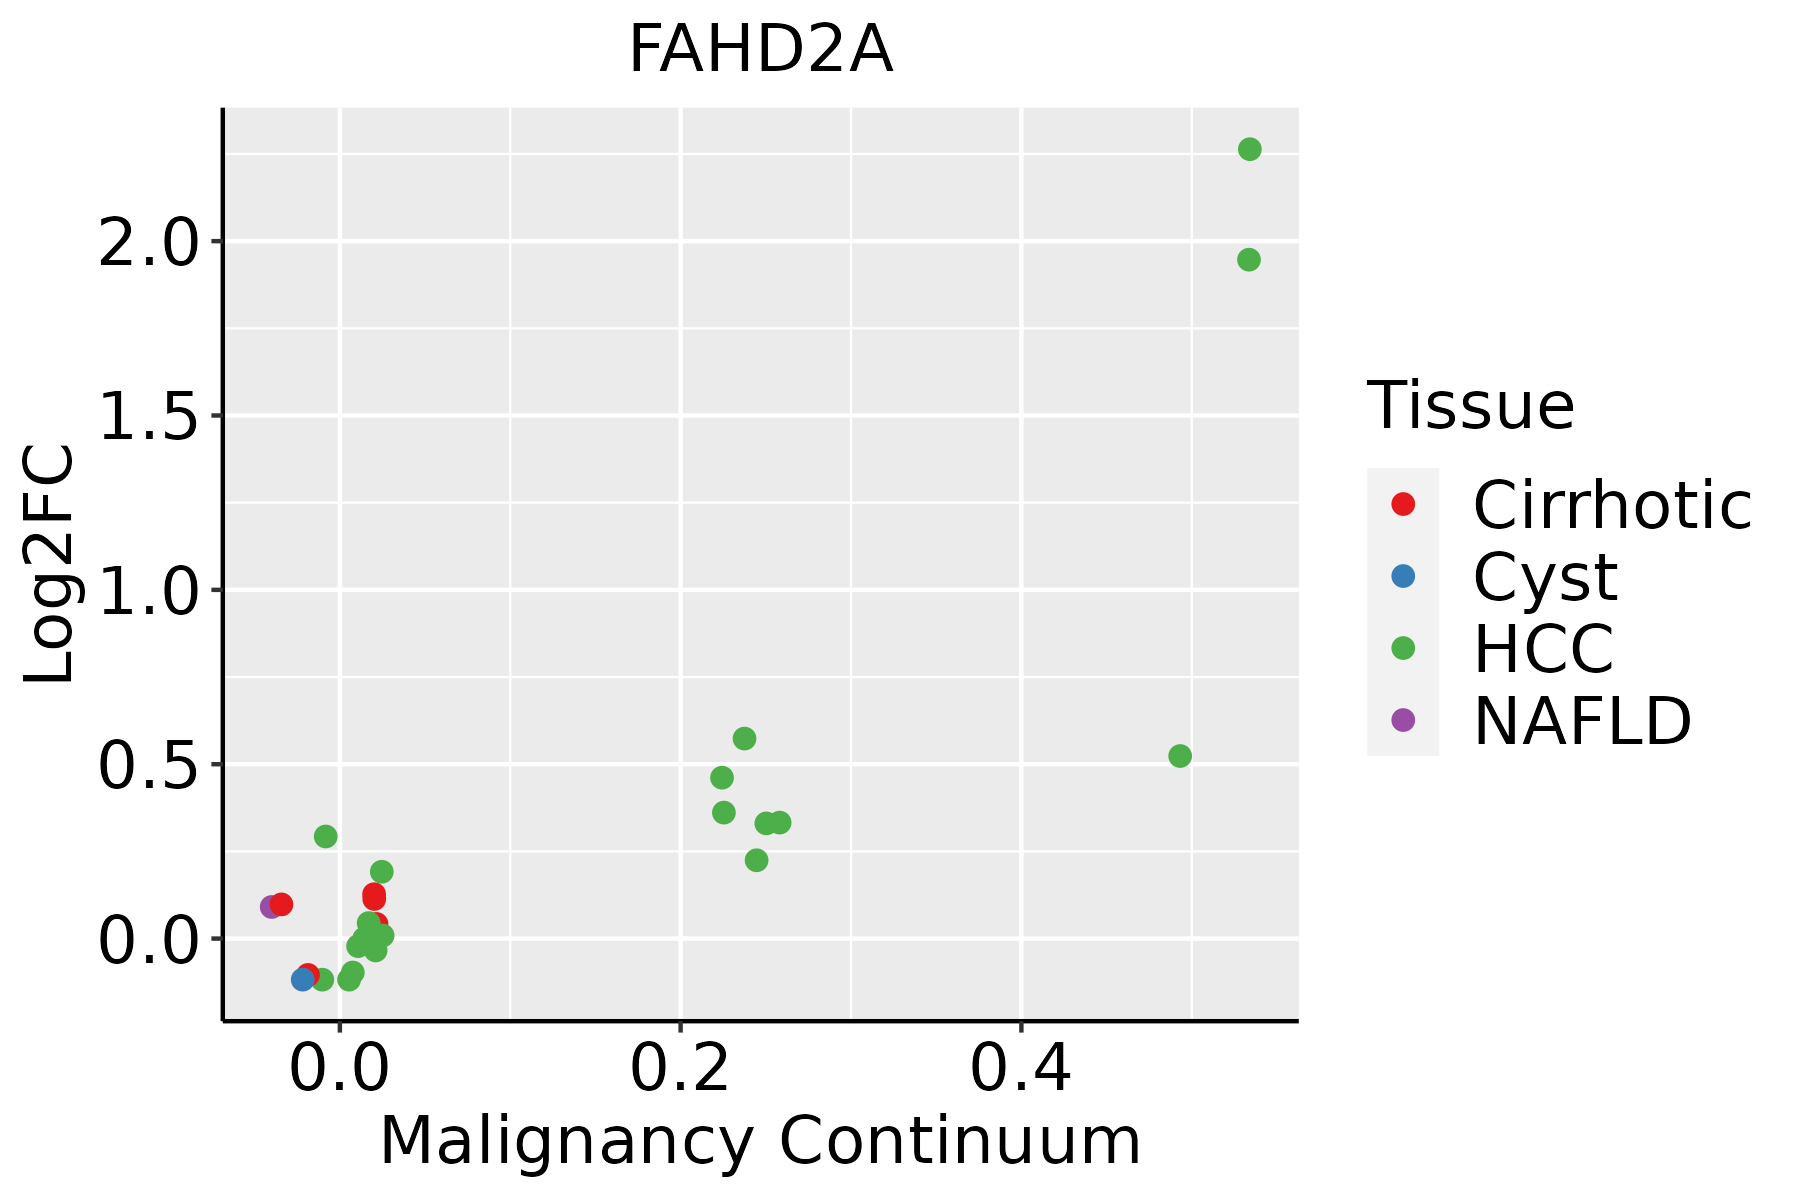 | HCC: Hepatocellular carcinoma |
| NAFLD: Non-alcoholic fatty liver disease | ||
| Oral Cavity |  | EOLP: Erosive Oral lichen planus |
| LP: leukoplakia | ||
| NEOLP: Non-erosive oral lichen planus | ||
| OSCC: Oral squamous cell carcinoma | ||
| Thyroid | 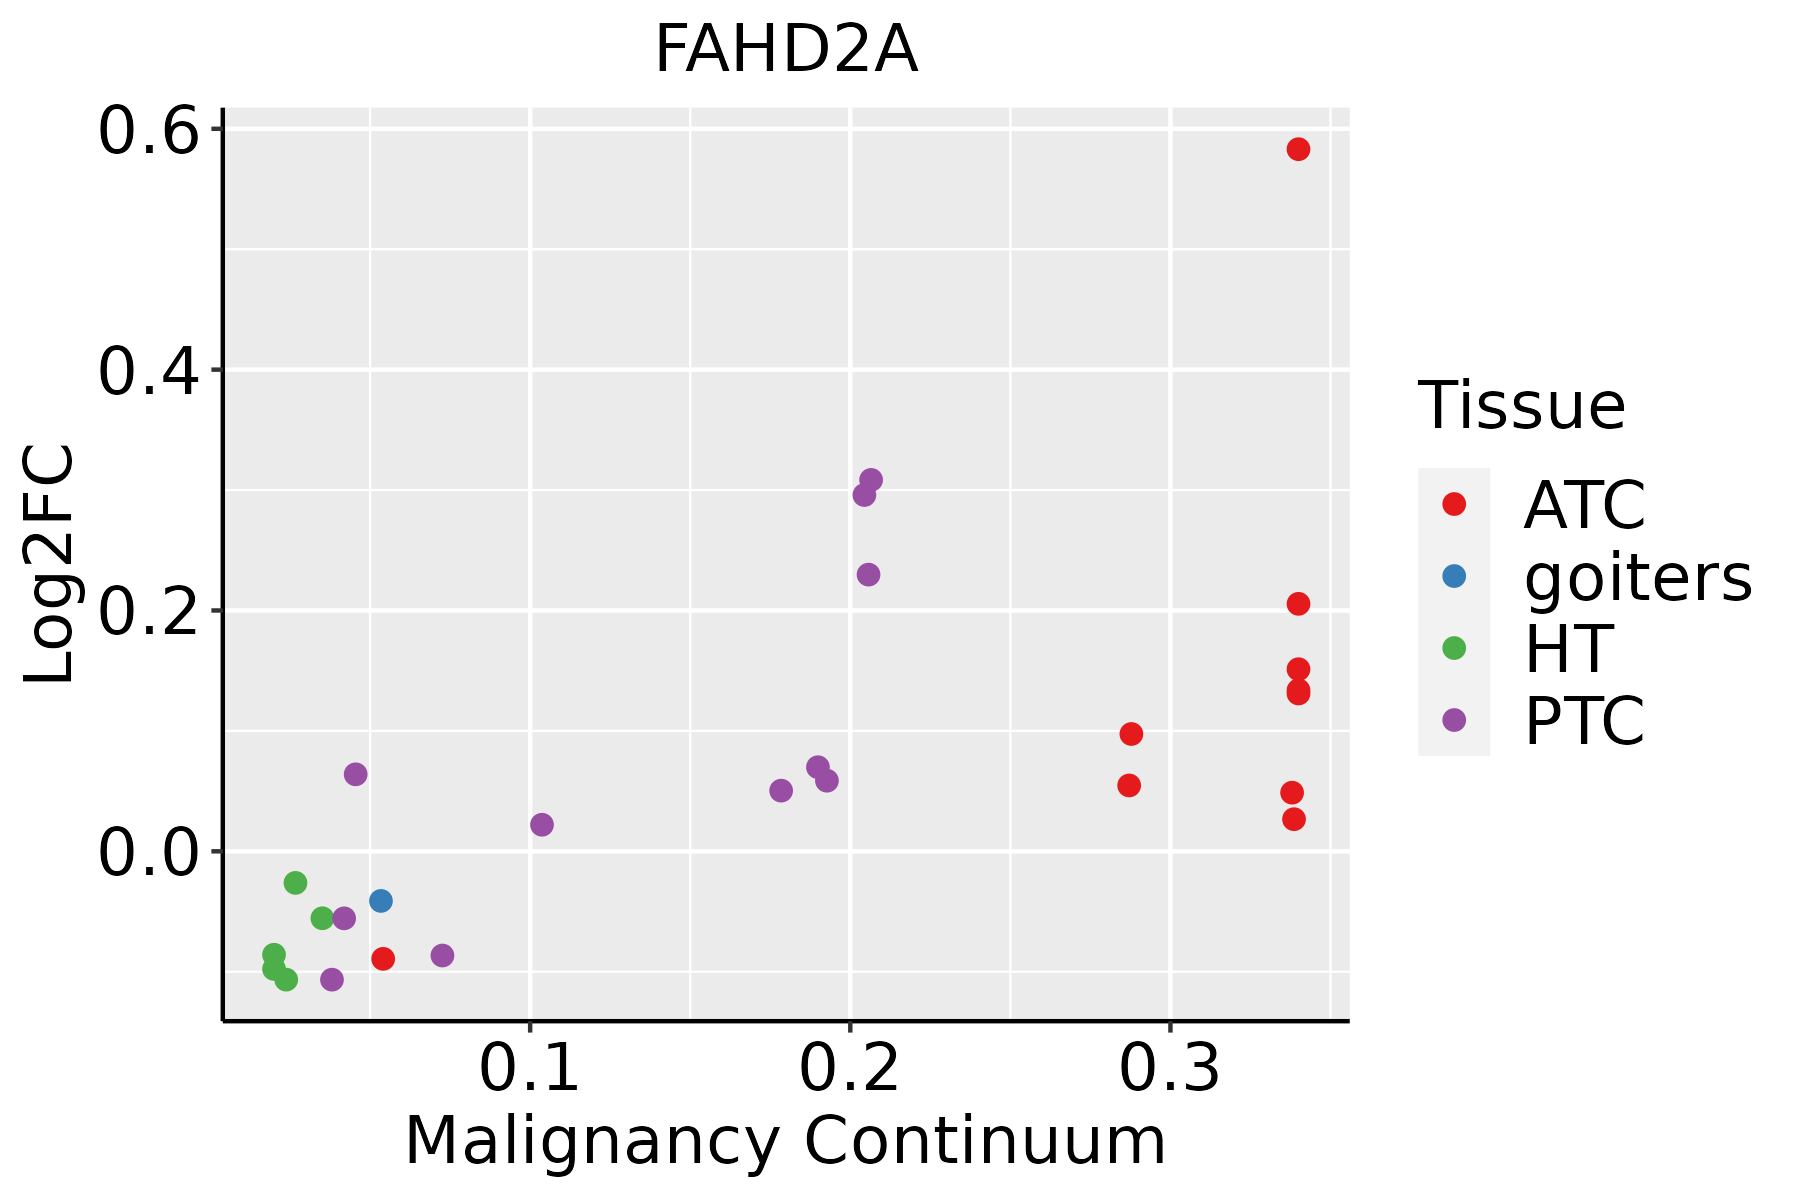 | ATC: Anaplastic thyroid cancer |
| HT: Hashimoto's thyroiditis | ||
| PTC: Papillary thyroid cancer |
| ∗log2FC in expression of this searched gene in stem-like cells from each diseased tissue sample relative to stem-like cells in normal samples in each tissue plotted against the malignancy continuum. Samples are colored based on if they are from different disease stage. |
Top |
Malignant transformation related pathway analysis |
| Find out the enriched GO biological processes and KEGG pathways involved in transition from healthy to precancer to cancer |
| Tissue | Disease Stage | Enriched GO biological Processes |
| Colorectum | AD |  |
| Colorectum | SER |  |
| Colorectum | MSS |  |
| Colorectum | MSI-H |  |
| Colorectum | FAP |  |
| ∗Top 15 enriched GO BP terms are showed in the bar plot of each disease state in each tissue. Each row represents a significant GO biological process which is colored according to the -log10(p.adjust). |
| Page: 1 2 3 4 5 6 7 8 9 |
| GO ID | Tissue | Disease Stage | Description | Gene Ratio | Bg Ratio | pvalue | p.adjust | Count |
| Page: 1 |
| Pathway ID | Tissue | Disease Stage | Description | Gene Ratio | Bg Ratio | pvalue | p.adjust | qvalue | Count |
| Page: 1 |
Top |
Cell-cell communication analysis |
| Identification of potential cell-cell interactions between two cell types and their ligand-receptor pairs for different disease states |
| Ligand | Receptor | LRpair | Pathway | Tissue | Disease Stage |
| Page: 1 |
Top |
Single-cell gene regulatory network inference analysis |
| Find out the significant the regulons (TFs) and the target genes of each regulon across cell types for different disease states |
| TF | Cell Type | Tissue | Disease Stage | Target Gene | RSS | Regulon Activity |
| ∗The dot plots of a searched regulon are shown for all cell subpopulations in each disease state of each tissue based on the regulon specific score inferred using pySCENIC and by calculating the average expression. |
| Page: 1 |
Top |
Somatic mutation of malignant transformation related genes |
| Annotation of somatic variants for genes involved in malignant transformation |
| Hugo Symbol | Variant Class | Variant Classification | dbSNP RS | HGVSc | HGVSp | HGVSp Short | SWISSPROT | BIOTYPE | SIFT | PolyPhen | Tumor Sample Barcode | Tissue | Histology | Sex | Age | Stage | Therapy Types | Drugs | Outcome |
| FAHD2A | SNV | Missense_Mutation | novel | c.416N>T | p.Ser139Phe | p.S139F | Q96GK7 | protein_coding | deleterious(0.01) | possibly_damaging(0.797) | TCGA-AC-A5XS-01 | Breast | breast invasive carcinoma | Female | >=65 | I/II | Hormone Therapy | femara | SD |
| FAHD2A | SNV | Missense_Mutation | c.679N>A | p.Val227Ile | p.V227I | Q96GK7 | protein_coding | tolerated(0.76) | benign(0.007) | TCGA-C8-A137-01 | Breast | breast invasive carcinoma | Female | <65 | I/II | Unknown | Unknown | PD | |
| FAHD2A | SNV | Missense_Mutation | novel | c.868C>G | p.Pro290Ala | p.P290A | Q96GK7 | protein_coding | deleterious(0.04) | benign(0.434) | TCGA-E2-A1LI-01 | Breast | breast invasive carcinoma | Female | <65 | I/II | Chemotherapy | adriamycin | SD |
| FAHD2A | SNV | Missense_Mutation | rs779613261 | c.233C>T | p.Ser78Leu | p.S78L | Q96GK7 | protein_coding | tolerated(0.09) | benign(0.165) | TCGA-GM-A2D9-01 | Breast | breast invasive carcinoma | Female | >=65 | I/II | Hormone Therapy | arimidex | SD |
| FAHD2A | SNV | Missense_Mutation | c.649N>G | p.Leu217Val | p.L217V | Q96GK7 | protein_coding | deleterious(0.03) | probably_damaging(0.96) | TCGA-DR-A0ZM-01 | Cervix | cervical & endocervical cancer | Female | <65 | III/IV | Unspecific | Cisplatin | SD | |
| FAHD2A | SNV | Missense_Mutation | novel | c.538N>A | p.Ala180Thr | p.A180T | Q96GK7 | protein_coding | tolerated(0.15) | benign(0.102) | TCGA-FU-A3HZ-01 | Cervix | cervical & endocervical cancer | Female | <65 | I/II | Chemotherapy | cisplatin | CR |
| FAHD2A | SNV | Missense_Mutation | c.98N>T | p.Arg33Leu | p.R33L | Q96GK7 | protein_coding | tolerated(0.47) | benign(0) | TCGA-A6-5665-01 | Colorectum | colon adenocarcinoma | Female | >=65 | I/II | Unknown | Unknown | PD | |
| FAHD2A | SNV | Missense_Mutation | novel | c.702G>T | p.Lys234Asn | p.K234N | Q96GK7 | protein_coding | tolerated(0.41) | benign(0.015) | TCGA-AA-3984-01 | Colorectum | colon adenocarcinoma | Female | <65 | I/II | Unknown | Unknown | SD |
| FAHD2A | SNV | Missense_Mutation | c.379C>T | p.Pro127Ser | p.P127S | Q96GK7 | protein_coding | deleterious(0) | probably_damaging(0.994) | TCGA-CK-5916-01 | Colorectum | colon adenocarcinoma | Female | >=65 | I/II | Unknown | Unknown | PD | |
| FAHD2A | SNV | Missense_Mutation | novel | c.395N>G | p.Ile132Ser | p.I132S | Q96GK7 | protein_coding | deleterious(0.04) | benign(0.183) | TCGA-F5-6814-01 | Colorectum | rectum adenocarcinoma | Male | <65 | I/II | Unknown | Unknown | SD |
| Page: 1 2 3 4 |
Top |
Related drugs of malignant transformation related genes |
| Identification of chemicals and drugs interact with genes involved in malignant transfromation |
| (DGIdb 4.0) |
| Entrez ID | Symbol | Category | Interaction Types | Drug Claim Name | Drug Name | PMIDs |
| Page: 1 |

Copyright 2023-Present -The University of Texas Health Science Center at Houston |