
|
|||||
|
 | |
| |
| |
| |
| |
| |
|
Gene: FAH |
Gene summary for FAH |
| Gene information | Species | Human | Gene symbol | FAH | Gene ID | 2184 |
| Gene name | fumarylacetoacetate hydrolase | |
| Gene Alias | FAH | |
| Cytomap | 15q25.1 | |
| Gene Type | protein-coding | GO ID | GO:0006082 | UniProtAcc | P16930 |
Top |
Malignant transformation analysis |
| Identification of the aberrant gene expression in precancerous and cancerous lesions by comparing the gene expression of stem-like cells in diseased tissues with normal stem cells |
| Entrez ID | Symbol | Replicates | Species | Organ | Tissue | Adj P-value | Log2FC | Malignancy |
| 2184 | FAH | LZE4T | Human | Esophagus | ESCC | 3.38e-10 | 3.36e-01 | 0.0811 |
| 2184 | FAH | LZE7T | Human | Esophagus | ESCC | 1.79e-03 | 2.91e-01 | 0.0667 |
| 2184 | FAH | LZE24T | Human | Esophagus | ESCC | 1.13e-04 | 1.44e-01 | 0.0596 |
| 2184 | FAH | LZE6T | Human | Esophagus | ESCC | 1.26e-03 | 2.09e-01 | 0.0845 |
| 2184 | FAH | P1T-E | Human | Esophagus | ESCC | 4.53e-04 | 2.14e-01 | 0.0875 |
| 2184 | FAH | P2T-E | Human | Esophagus | ESCC | 1.38e-18 | 3.48e-01 | 0.1177 |
| 2184 | FAH | P4T-E | Human | Esophagus | ESCC | 1.93e-18 | 4.60e-01 | 0.1323 |
| 2184 | FAH | P5T-E | Human | Esophagus | ESCC | 1.34e-09 | 1.83e-01 | 0.1327 |
| 2184 | FAH | P8T-E | Human | Esophagus | ESCC | 3.44e-05 | 1.69e-01 | 0.0889 |
| 2184 | FAH | P9T-E | Human | Esophagus | ESCC | 1.38e-17 | 4.63e-01 | 0.1131 |
| 2184 | FAH | P10T-E | Human | Esophagus | ESCC | 2.77e-08 | 1.46e-01 | 0.116 |
| 2184 | FAH | P11T-E | Human | Esophagus | ESCC | 2.91e-06 | 2.67e-01 | 0.1426 |
| 2184 | FAH | P12T-E | Human | Esophagus | ESCC | 4.10e-10 | 2.21e-01 | 0.1122 |
| 2184 | FAH | P15T-E | Human | Esophagus | ESCC | 6.05e-13 | 3.24e-01 | 0.1149 |
| 2184 | FAH | P16T-E | Human | Esophagus | ESCC | 6.15e-21 | 4.04e-01 | 0.1153 |
| 2184 | FAH | P20T-E | Human | Esophagus | ESCC | 1.00e-02 | 6.14e-02 | 0.1124 |
| 2184 | FAH | P21T-E | Human | Esophagus | ESCC | 8.45e-16 | 3.08e-01 | 0.1617 |
| 2184 | FAH | P22T-E | Human | Esophagus | ESCC | 2.78e-28 | 4.38e-01 | 0.1236 |
| 2184 | FAH | P23T-E | Human | Esophagus | ESCC | 1.80e-10 | 3.42e-01 | 0.108 |
| 2184 | FAH | P24T-E | Human | Esophagus | ESCC | 6.49e-10 | 1.87e-01 | 0.1287 |
| Page: 1 2 3 4 5 |
| Tissue | Expression Dynamics | Abbreviation |
| Esophagus | 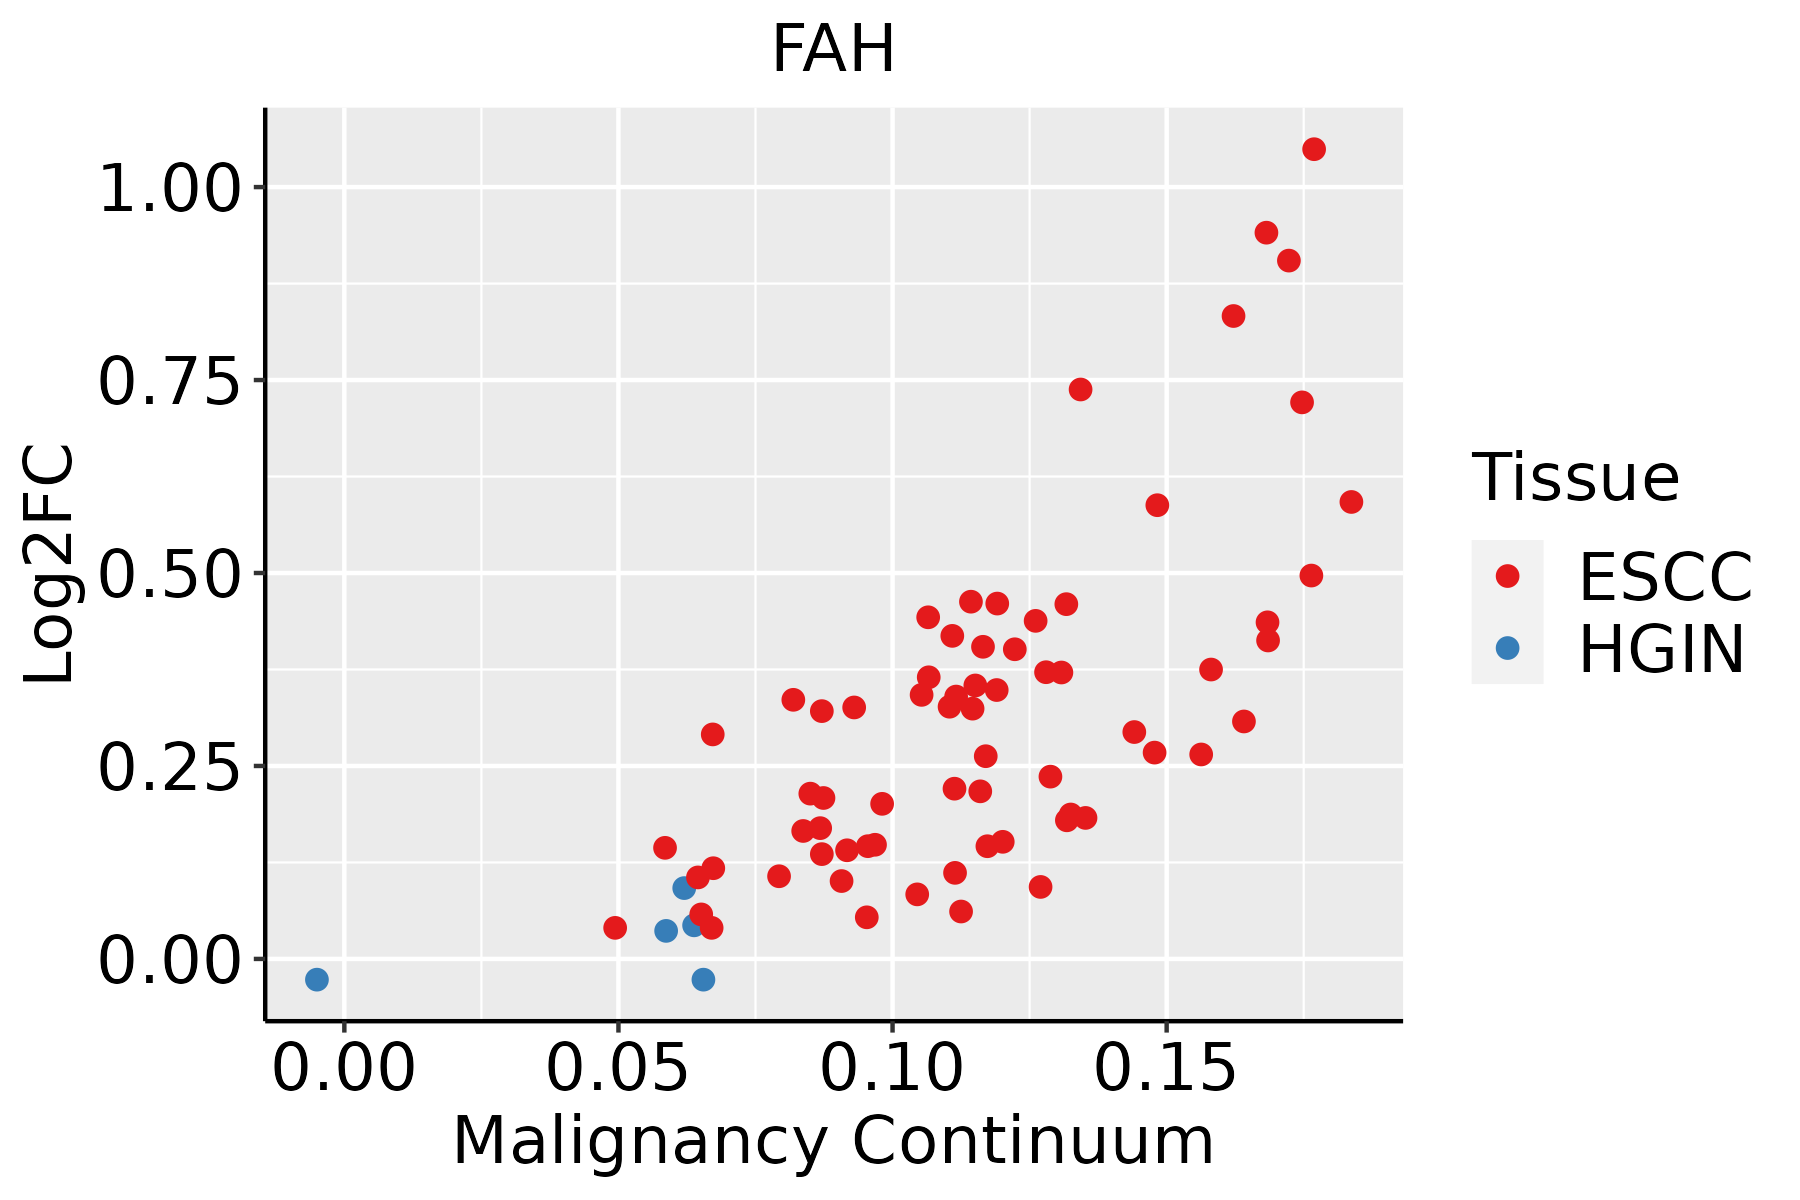 | ESCC: Esophageal squamous cell carcinoma |
| HGIN: High-grade intraepithelial neoplasias | ||
| LGIN: Low-grade intraepithelial neoplasias | ||
| Liver | 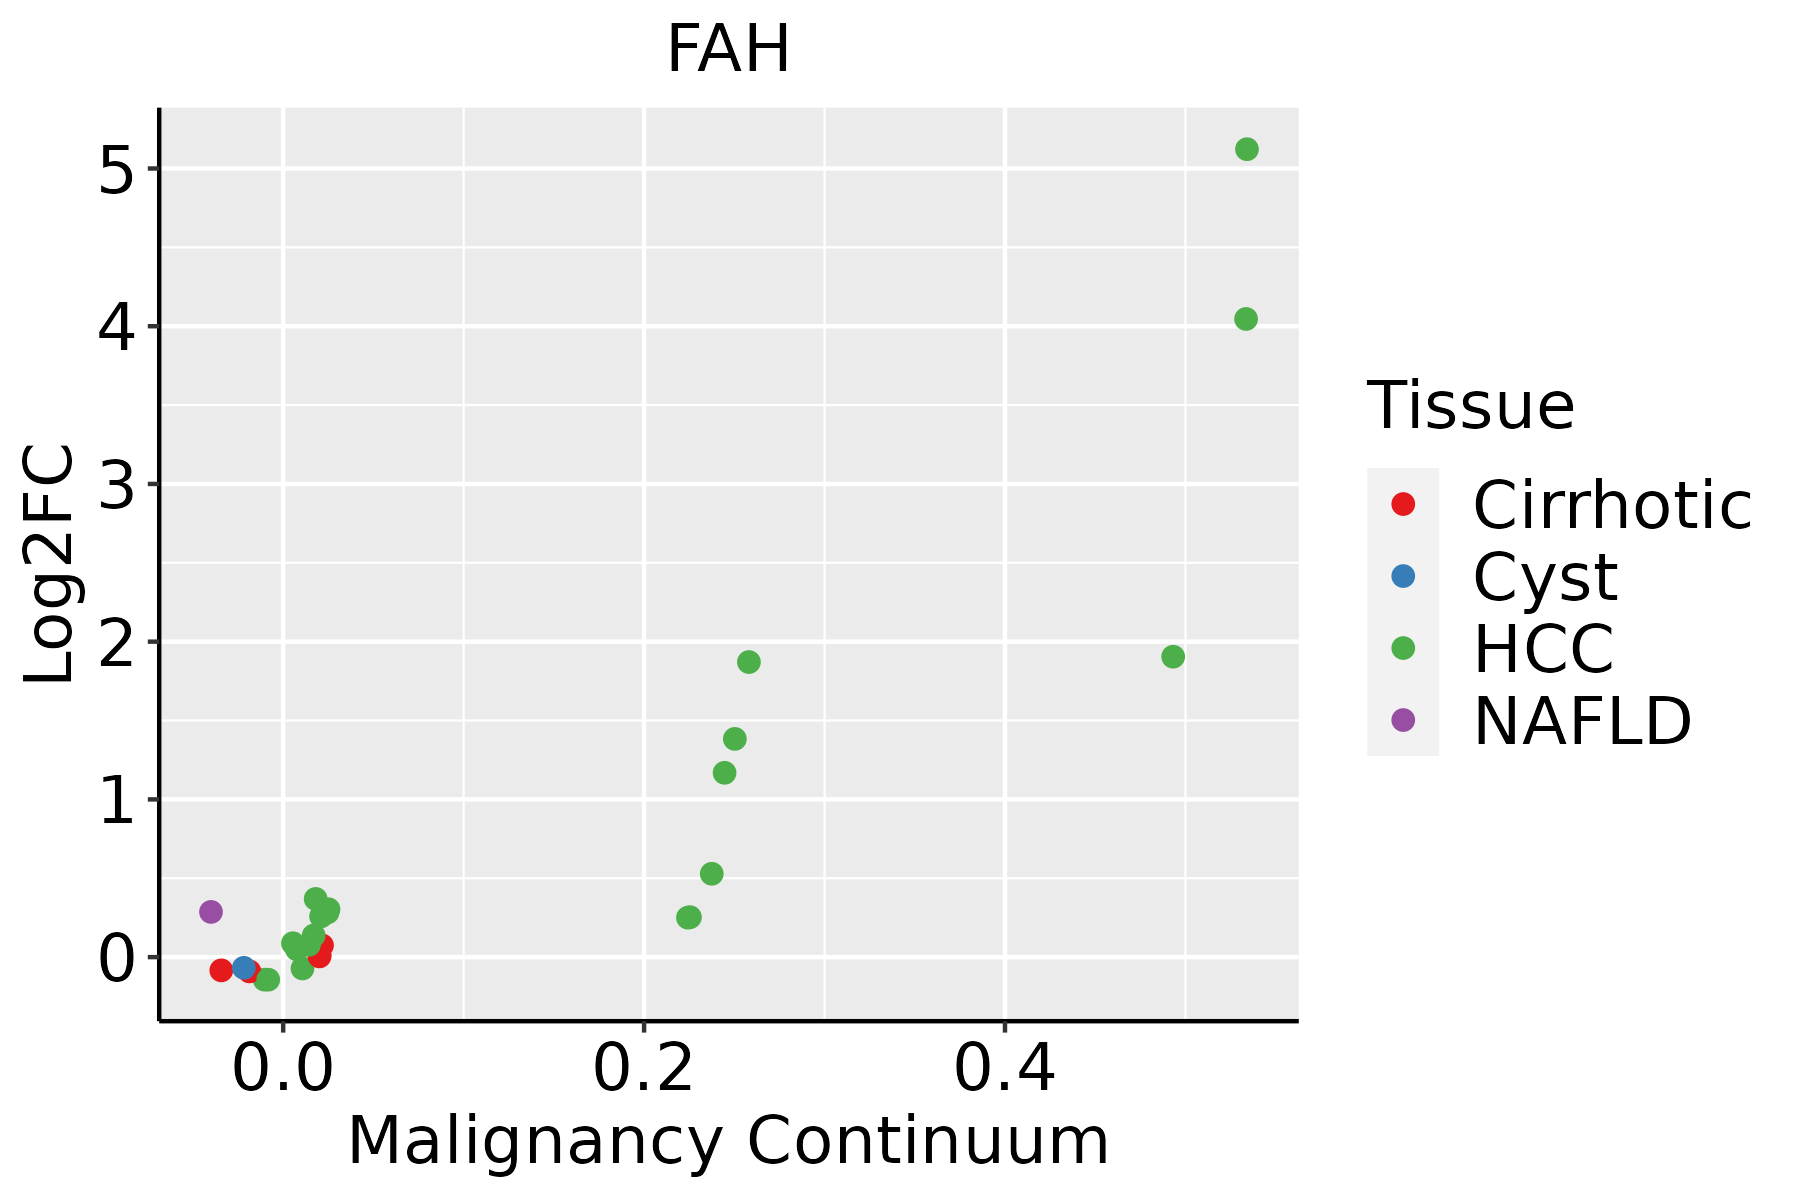 | HCC: Hepatocellular carcinoma |
| NAFLD: Non-alcoholic fatty liver disease | ||
| Oral Cavity |  | EOLP: Erosive Oral lichen planus |
| LP: leukoplakia | ||
| NEOLP: Non-erosive oral lichen planus | ||
| OSCC: Oral squamous cell carcinoma | ||
| Thyroid |  | ATC: Anaplastic thyroid cancer |
| HT: Hashimoto's thyroiditis | ||
| PTC: Papillary thyroid cancer |
| ∗log2FC in expression of this searched gene in stem-like cells from each diseased tissue sample relative to stem-like cells in normal samples in each tissue plotted against the malignancy continuum. Samples are colored based on if they are from different disease stage. |
Top |
Malignant transformation related pathway analysis |
| Find out the enriched GO biological processes and KEGG pathways involved in transition from healthy to precancer to cancer |
| Tissue | Disease Stage | Enriched GO biological Processes |
| Colorectum | AD |  |
| Colorectum | SER |  |
| Colorectum | MSS |  |
| Colorectum | MSI-H |  |
| Colorectum | FAP |  |
| ∗Top 15 enriched GO BP terms are showed in the bar plot of each disease state in each tissue. Each row represents a significant GO biological process which is colored according to the -log10(p.adjust). |
| Page: 1 2 3 4 5 6 7 8 9 |
| GO ID | Tissue | Disease Stage | Description | Gene Ratio | Bg Ratio | pvalue | p.adjust | Count |
| GO:002260410 | Cervix | CC | regulation of cell morphogenesis | 84/2311 | 309/18723 | 1.00e-12 | 4.29e-10 | 84 |
| GO:00016679 | Cervix | CC | ameboidal-type cell migration | 110/2311 | 475/18723 | 2.66e-11 | 6.36e-09 | 110 |
| GO:00085446 | Cervix | CC | epidermis development | 83/2311 | 324/18723 | 3.91e-11 | 8.54e-09 | 83 |
| GO:00071639 | Cervix | CC | establishment or maintenance of cell polarity | 63/2311 | 218/18723 | 4.25e-11 | 8.76e-09 | 63 |
| GO:00512359 | Cervix | CC | maintenance of location | 78/2311 | 327/18723 | 5.18e-09 | 4.92e-07 | 78 |
| GO:00430877 | Cervix | CC | regulation of GTPase activity | 79/2311 | 348/18723 | 4.21e-08 | 2.60e-06 | 79 |
| GO:00300108 | Cervix | CC | establishment of cell polarity | 42/2311 | 143/18723 | 4.30e-08 | 2.62e-06 | 42 |
| GO:00099137 | Cervix | CC | epidermal cell differentiation | 53/2311 | 202/18723 | 5.48e-08 | 3.25e-06 | 53 |
| GO:005165110 | Cervix | CC | maintenance of location in cell | 55/2311 | 214/18723 | 6.63e-08 | 3.85e-06 | 55 |
| GO:003009910 | Cervix | CC | myeloid cell differentiation | 83/2311 | 381/18723 | 1.31e-07 | 6.42e-06 | 83 |
| GO:00107699 | Cervix | CC | regulation of cell morphogenesis involved in differentiation | 31/2311 | 96/18723 | 2.43e-07 | 1.05e-05 | 31 |
| GO:00163587 | Cervix | CC | dendrite development | 58/2311 | 243/18723 | 4.52e-07 | 1.76e-05 | 58 |
| GO:00310988 | Cervix | CC | stress-activated protein kinase signaling cascade | 58/2311 | 247/18723 | 8.02e-07 | 2.89e-05 | 58 |
| GO:00514038 | Cervix | CC | stress-activated MAPK cascade | 55/2311 | 239/18723 | 2.96e-06 | 8.31e-05 | 55 |
| GO:00109757 | Cervix | CC | regulation of neuron projection development | 88/2311 | 445/18723 | 4.26e-06 | 1.09e-04 | 88 |
| GO:00107206 | Cervix | CC | positive regulation of cell development | 64/2311 | 298/18723 | 5.69e-06 | 1.41e-04 | 64 |
| GO:00457876 | Cervix | CC | positive regulation of cell cycle | 66/2311 | 313/18723 | 7.78e-06 | 1.81e-04 | 66 |
| GO:00703027 | Cervix | CC | regulation of stress-activated protein kinase signaling cascade | 46/2311 | 195/18723 | 9.35e-06 | 2.11e-04 | 46 |
| GO:00313467 | Cervix | CC | positive regulation of cell projection organization | 72/2311 | 353/18723 | 1.04e-05 | 2.32e-04 | 72 |
| GO:00160498 | Cervix | CC | cell growth | 92/2311 | 482/18723 | 1.16e-05 | 2.49e-04 | 92 |
| Page: 1 2 3 4 5 6 7 8 9 10 11 12 13 14 15 16 17 18 19 20 21 22 23 24 25 26 27 28 29 30 31 32 33 34 35 36 37 38 39 40 41 42 43 44 45 46 47 48 49 50 51 52 53 54 55 56 57 58 59 60 61 62 63 64 65 66 67 68 69 70 71 72 73 74 75 76 77 78 79 80 81 82 83 84 85 86 87 88 89 90 91 92 93 94 95 96 97 98 99 100 101 102 |
| Pathway ID | Tissue | Disease Stage | Description | Gene Ratio | Bg Ratio | pvalue | p.adjust | qvalue | Count |
| Page: 1 |
Top |
Cell-cell communication analysis |
| Identification of potential cell-cell interactions between two cell types and their ligand-receptor pairs for different disease states |
| Ligand | Receptor | LRpair | Pathway | Tissue | Disease Stage |
| Page: 1 |
Top |
Single-cell gene regulatory network inference analysis |
| Find out the significant the regulons (TFs) and the target genes of each regulon across cell types for different disease states |
| TF | Cell Type | Tissue | Disease Stage | Target Gene | RSS | Regulon Activity |
| ∗The dot plots of a searched regulon are shown for all cell subpopulations in each disease state of each tissue based on the regulon specific score inferred using pySCENIC and by calculating the average expression. |
| Page: 1 |
Top |
Somatic mutation of malignant transformation related genes |
| Annotation of somatic variants for genes involved in malignant transformation |
| Hugo Symbol | Variant Class | Variant Classification | dbSNP RS | HGVSc | HGVSp | HGVSp Short | SWISSPROT | BIOTYPE | SIFT | PolyPhen | Tumor Sample Barcode | Tissue | Histology | Sex | Age | Stage | Therapy Types | Drugs | Outcome |
| FAH | SNV | Missense_Mutation | rs147946196 | c.391C>T | p.Arg131Trp | p.R131W | P16930 | protein_coding | tolerated(0.08) | benign(0.009) | TCGA-A8-A092-01 | Breast | breast invasive carcinoma | Female | <65 | III/IV | Chemotherapy | paclitaxel | CR |
| FAH | insertion | Frame_Shift_Ins | novel | c.470_471insCCAA | p.Gly158GlnfsTer27 | p.G158Qfs*27 | P16930 | protein_coding | TCGA-B6-A0IC-01 | Breast | breast invasive carcinoma | Female | >=65 | I/II | Unknown | Unknown | SD | ||
| FAH | SNV | Missense_Mutation | novel | c.1237N>A | p.Leu413Met | p.L413M | P16930 | protein_coding | deleterious(0) | probably_damaging(0.988) | TCGA-2W-A8YY-01 | Cervix | cervical & endocervical cancer | Female | <65 | I/II | Chemotherapy | cisplatin | CR |
| FAH | SNV | Missense_Mutation | novel | c.805N>G | p.Leu269Val | p.L269V | P16930 | protein_coding | deleterious(0) | possibly_damaging(0.756) | TCGA-C5-A7X5-01 | Cervix | cervical & endocervical cancer | Female | >=65 | I/II | Chemotherapy | carboplatin | PD |
| FAH | SNV | Missense_Mutation | c.638N>C | p.Gly213Ala | p.G213A | P16930 | protein_coding | deleterious(0.01) | possibly_damaging(0.79) | TCGA-EK-A2PG-01 | Cervix | cervical & endocervical cancer | Female | >=65 | I/II | Unknown | Unknown | SD | |
| FAH | SNV | Missense_Mutation | rs143243347 | c.412N>A | p.Gly138Arg | p.G138R | P16930 | protein_coding | deleterious(0) | probably_damaging(1) | TCGA-EK-A2RB-01 | Cervix | cervical & endocervical cancer | Female | <65 | I/II | Unknown | Unknown | SD |
| FAH | SNV | Missense_Mutation | rs777899653 | c.307N>T | p.Arg103Trp | p.R103W | P16930 | protein_coding | deleterious(0) | probably_damaging(0.996) | TCGA-FU-A3HZ-01 | Cervix | cervical & endocervical cancer | Female | <65 | I/II | Chemotherapy | cisplatin | CR |
| FAH | SNV | Missense_Mutation | c.68C>G | p.Ser23Trp | p.S23W | P16930 | protein_coding | deleterious(0.01) | probably_damaging(1) | TCGA-Q1-A73O-01 | Cervix | cervical & endocervical cancer | Female | <65 | I/II | Chemotherapy | cisplatin | CR | |
| FAH | SNV | Missense_Mutation | c.347N>G | p.His116Arg | p.H116R | P16930 | protein_coding | deleterious(0.03) | possibly_damaging(0.88) | TCGA-AY-6197-01 | Colorectum | colon adenocarcinoma | Male | <65 | I/II | Unknown | Unknown | SD | |
| FAH | SNV | Missense_Mutation | novel | c.226N>A | p.Ala76Thr | p.A76T | P16930 | protein_coding | tolerated(0.24) | benign(0.003) | TCGA-AZ-4315-01 | Colorectum | colon adenocarcinoma | Male | <65 | I/II | Unknown | Unknown | SD |
| Page: 1 2 3 4 5 |
Top |
Related drugs of malignant transformation related genes |
| Identification of chemicals and drugs interact with genes involved in malignant transfromation |
| (DGIdb 4.0) |
| Entrez ID | Symbol | Category | Interaction Types | Drug Claim Name | Drug Name | PMIDs |
| Page: 1 |

Copyright 2023-Present -The University of Texas Health Science Center at Houston |