
|
|||||
|
 | |
| |
| |
| |
| |
| |
|
Gene: FAF1 |
Gene summary for FAF1 |
| Gene information | Species | Human | Gene symbol | FAF1 | Gene ID | 11124 |
| Gene name | Fas associated factor 1 | |
| Gene Alias | CGI-03 | |
| Cytomap | 1p32.3 | |
| Gene Type | protein-coding | GO ID | GO:0006139 | UniProtAcc | Q9UNN5 |
Top |
Malignant transformation analysis |
| Identification of the aberrant gene expression in precancerous and cancerous lesions by comparing the gene expression of stem-like cells in diseased tissues with normal stem cells |
| Entrez ID | Symbol | Replicates | Species | Organ | Tissue | Adj P-value | Log2FC | Malignancy |
| 11124 | FAF1 | CCI_1 | Human | Cervix | CC | 9.08e-31 | 2.03e+00 | 0.528 |
| 11124 | FAF1 | CCI_2 | Human | Cervix | CC | 2.28e-16 | 1.80e+00 | 0.5249 |
| 11124 | FAF1 | CCI_3 | Human | Cervix | CC | 1.73e-33 | 2.07e+00 | 0.516 |
| 11124 | FAF1 | HTA11_3410_2000001011 | Human | Colorectum | AD | 1.35e-22 | -5.96e-01 | 0.0155 |
| 11124 | FAF1 | HTA11_347_2000001011 | Human | Colorectum | AD | 4.18e-11 | 6.24e-01 | -0.1954 |
| 11124 | FAF1 | HTA11_411_2000001011 | Human | Colorectum | SER | 2.60e-04 | 3.55e-01 | -0.2602 |
| 11124 | FAF1 | HTA11_3361_2000001011 | Human | Colorectum | AD | 9.84e-03 | -4.90e-01 | -0.1207 |
| 11124 | FAF1 | HTA11_5212_2000001011 | Human | Colorectum | AD | 2.90e-07 | -6.73e-01 | -0.2061 |
| 11124 | FAF1 | HTA11_5216_2000001011 | Human | Colorectum | SER | 4.50e-03 | -4.75e-01 | -0.1462 |
| 11124 | FAF1 | HTA11_9341_2000001011 | Human | Colorectum | SER | 2.79e-02 | -3.36e-01 | -0.00410000000000005 |
| 11124 | FAF1 | HTA11_7862_2000001011 | Human | Colorectum | AD | 2.01e-05 | -5.15e-01 | -0.0179 |
| 11124 | FAF1 | HTA11_866_3004761011 | Human | Colorectum | AD | 1.14e-18 | -5.55e-01 | 0.096 |
| 11124 | FAF1 | HTA11_9408_2000001011 | Human | Colorectum | AD | 7.06e-03 | -6.34e-01 | 0.0451 |
| 11124 | FAF1 | HTA11_99999970781_79442 | Human | Colorectum | MSS | 1.76e-08 | -4.00e-01 | 0.294 |
| 11124 | FAF1 | HTA11_99999965062_69753 | Human | Colorectum | MSI-H | 6.38e-05 | 6.66e-01 | 0.3487 |
| 11124 | FAF1 | HTA11_99999973899_84307 | Human | Colorectum | MSS | 1.52e-04 | -6.45e-01 | 0.2585 |
| 11124 | FAF1 | HTA11_99999974143_84620 | Human | Colorectum | MSS | 6.94e-13 | -5.29e-01 | 0.3005 |
| 11124 | FAF1 | F007 | Human | Colorectum | FAP | 3.06e-02 | -2.96e-01 | 0.1176 |
| 11124 | FAF1 | A001-C-207 | Human | Colorectum | FAP | 4.00e-06 | -3.96e-01 | 0.1278 |
| 11124 | FAF1 | A015-C-203 | Human | Colorectum | FAP | 2.95e-37 | -6.66e-01 | -0.1294 |
| Page: 1 2 3 4 5 6 7 8 9 10 11 12 |
| Tissue | Expression Dynamics | Abbreviation |
| Cervix | 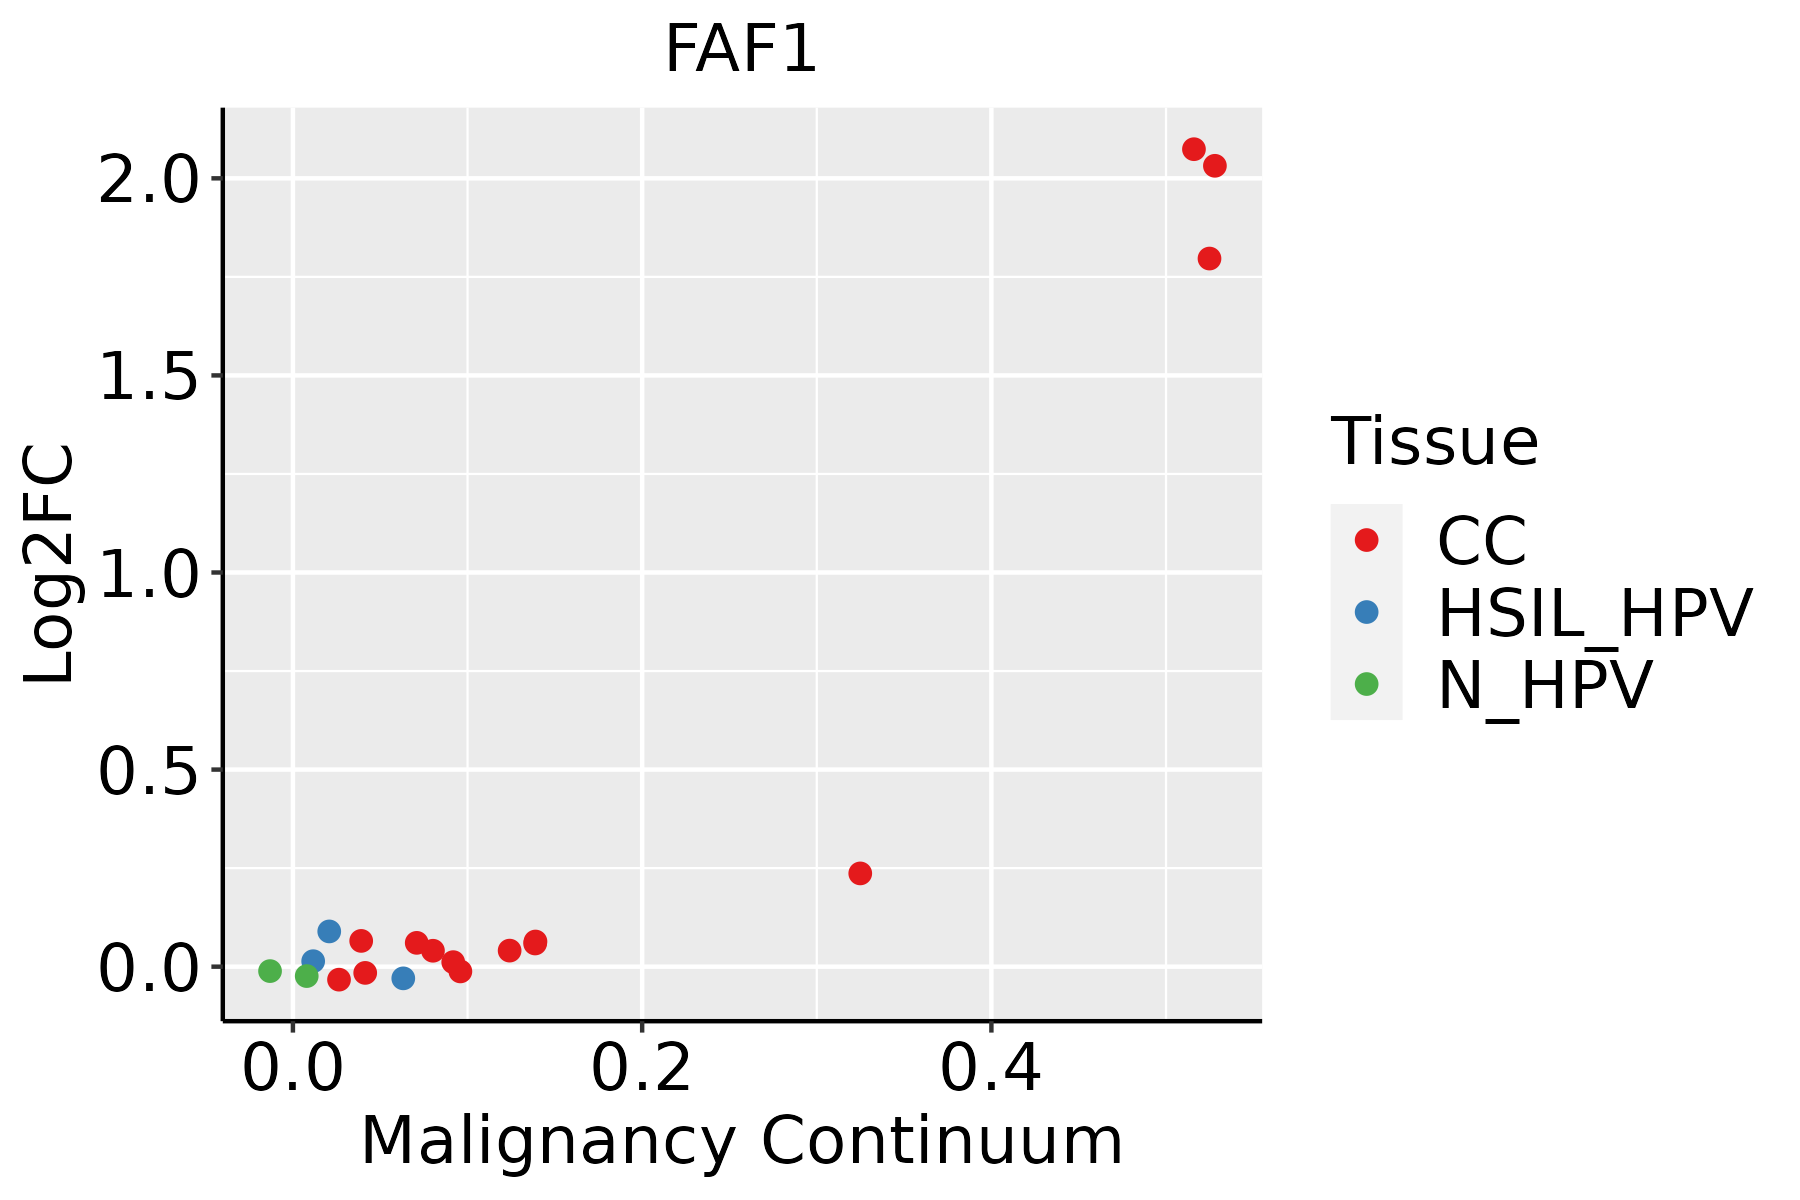 | CC: Cervix cancer |
| HSIL_HPV: HPV-infected high-grade squamous intraepithelial lesions | ||
| N_HPV: HPV-infected normal cervix | ||
| Colorectum (GSE201348) |  | FAP: Familial adenomatous polyposis |
| CRC: Colorectal cancer | ||
| Colorectum (HTA11) |  | AD: Adenomas |
| SER: Sessile serrated lesions | ||
| MSI-H: Microsatellite-high colorectal cancer | ||
| MSS: Microsatellite stable colorectal cancer | ||
| Endometrium | 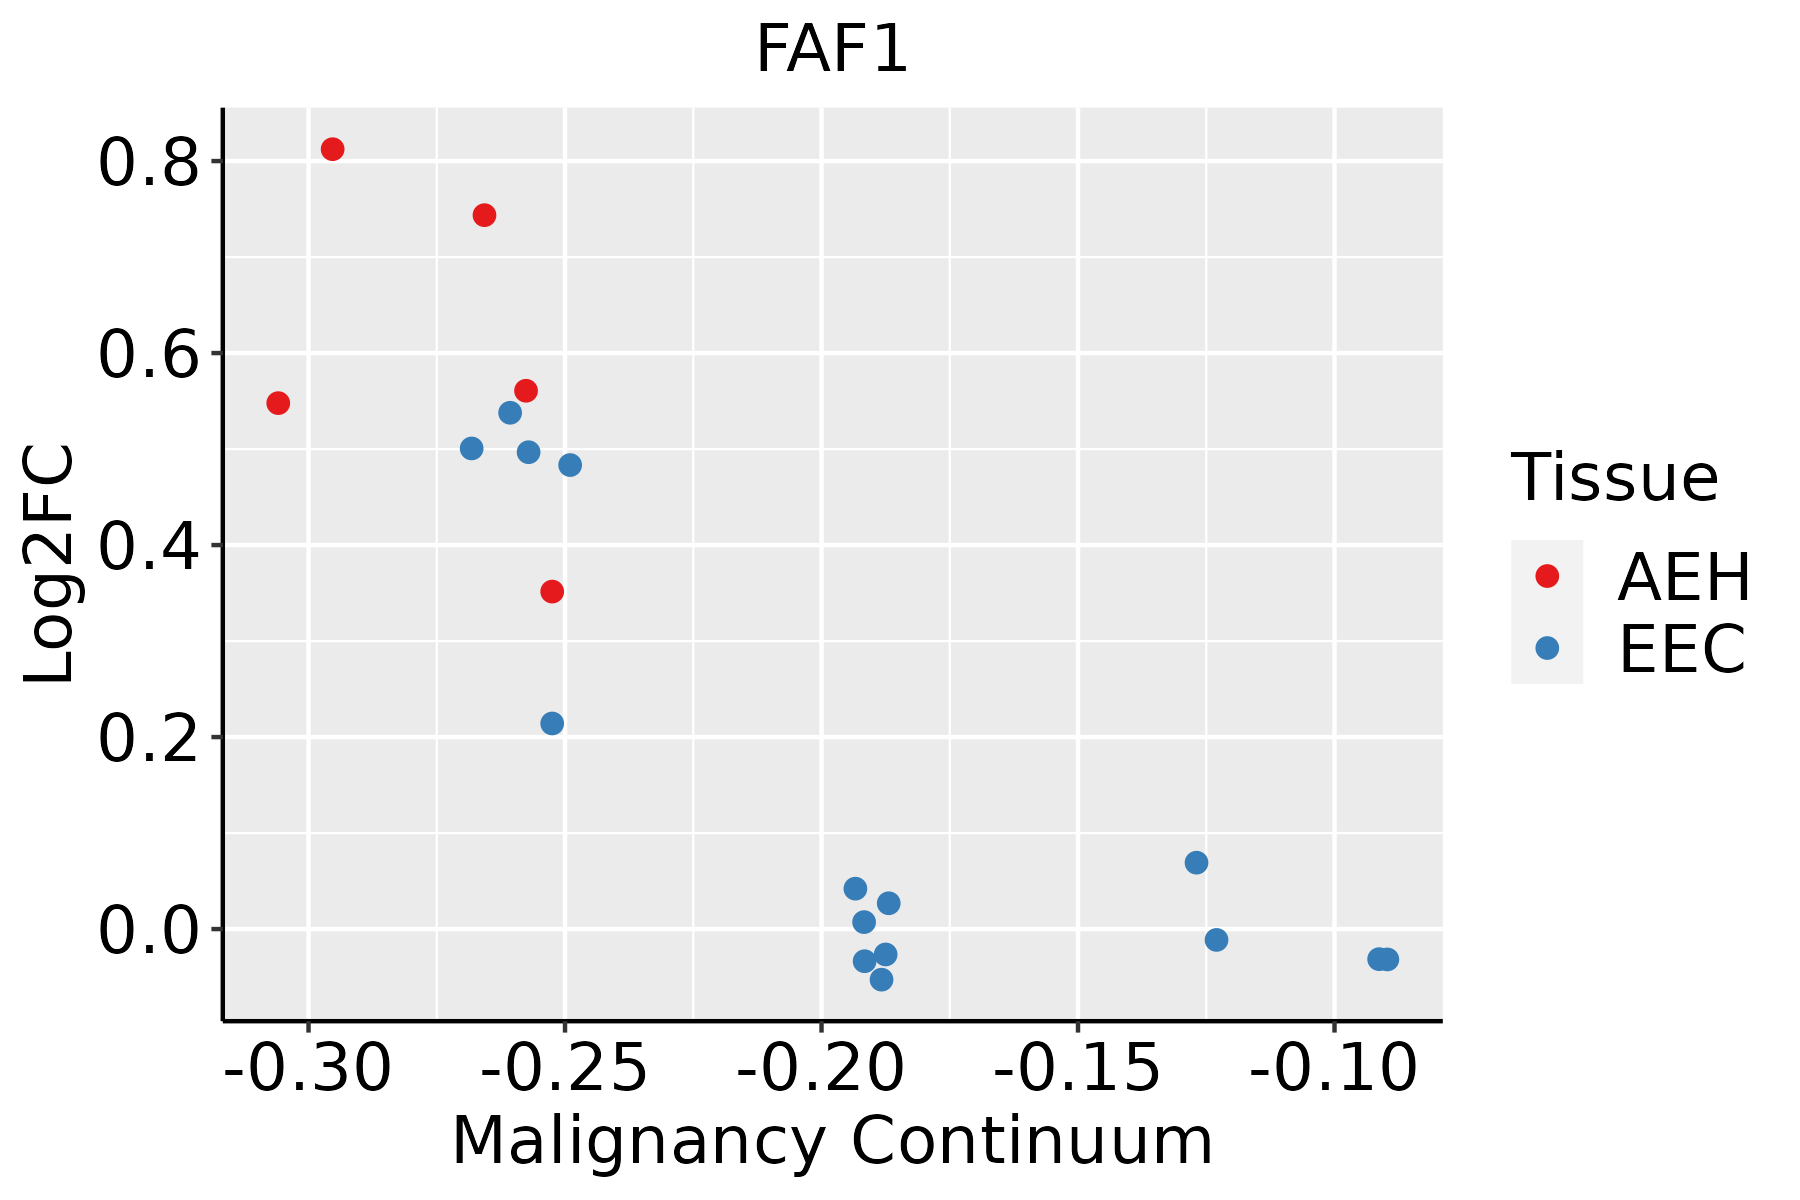 | AEH: Atypical endometrial hyperplasia |
| EEC: Endometrioid Cancer | ||
| Esophagus |  | ESCC: Esophageal squamous cell carcinoma |
| HGIN: High-grade intraepithelial neoplasias | ||
| LGIN: Low-grade intraepithelial neoplasias | ||
| GC | 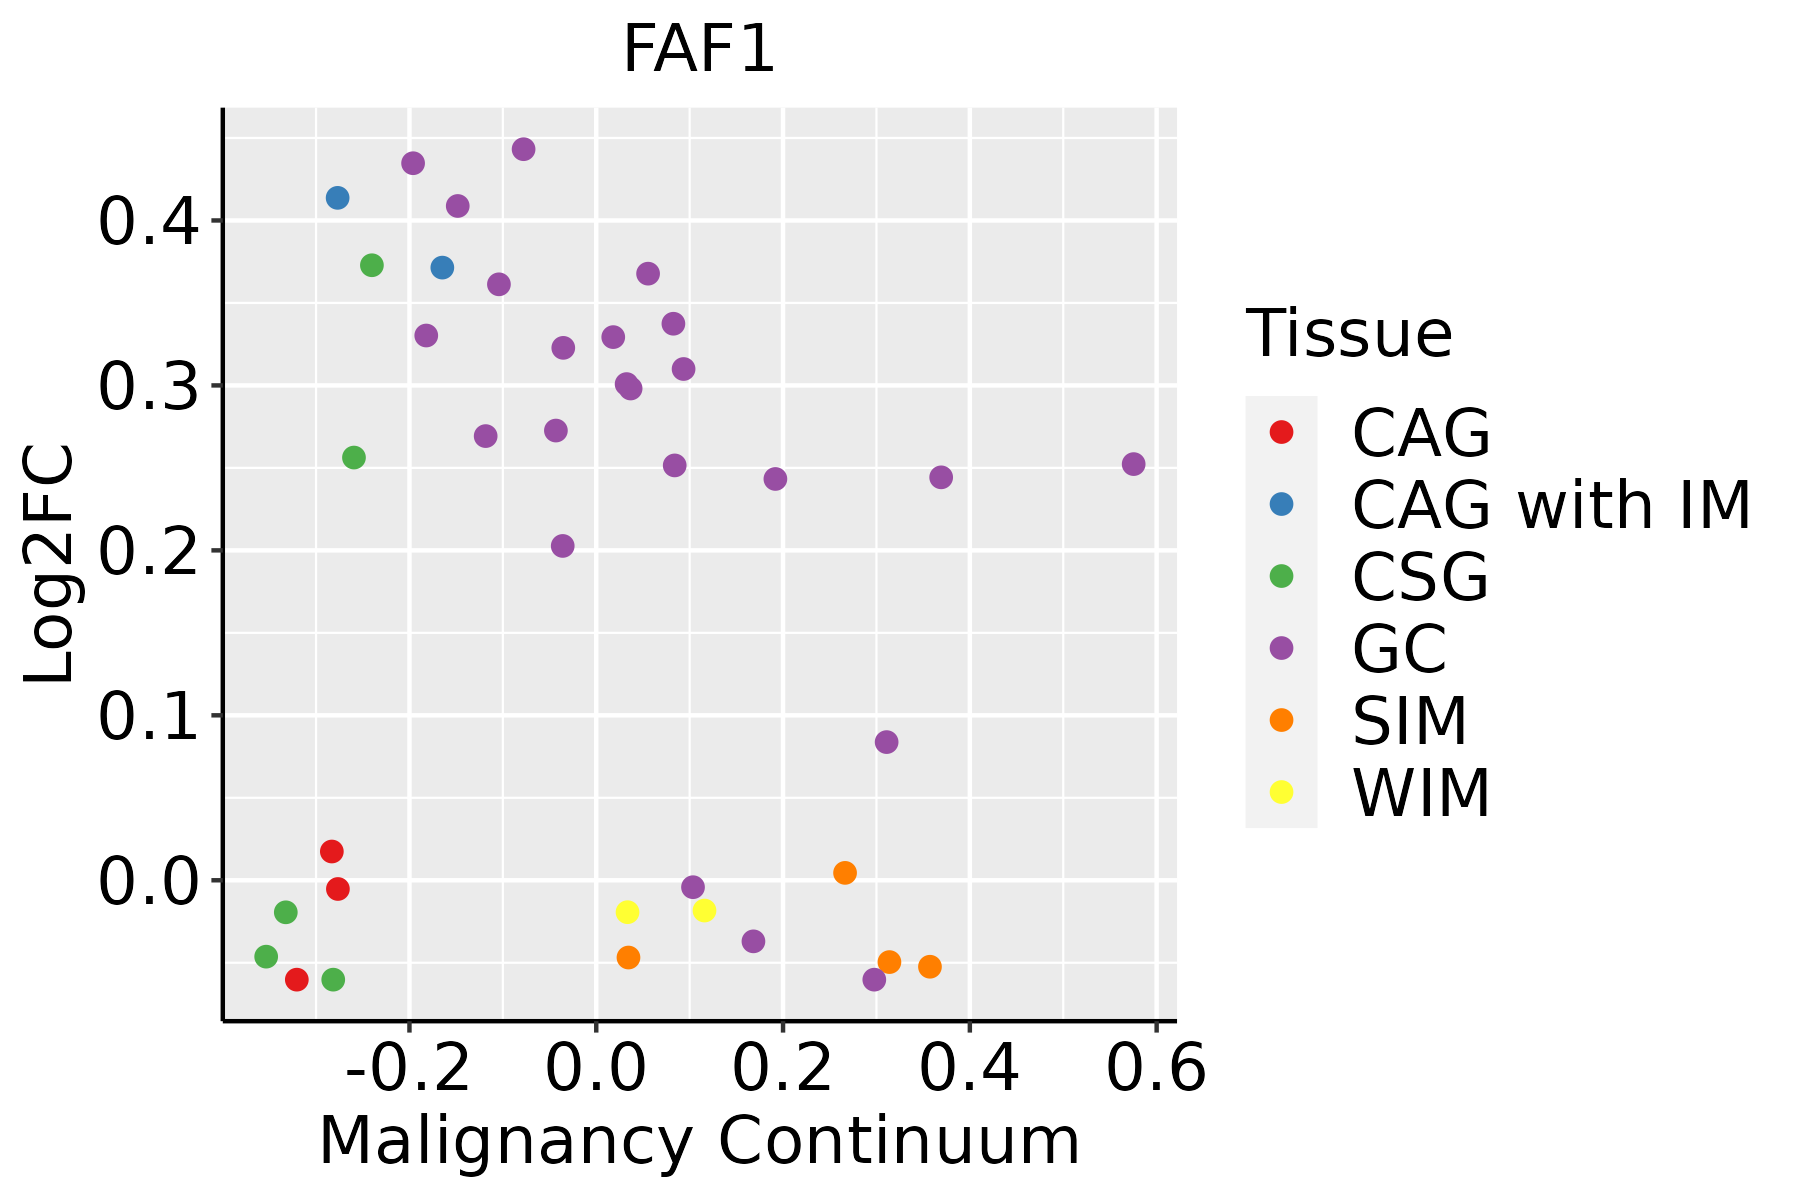 | CAG: Chronic atrophic gastritis |
| CAG with IM: Chronic atrophic gastritis with intestinal metaplasia | ||
| CSG: Chronic superficial gastritis | ||
| GC: Gastric cancer | ||
| SIM: Severe intestinal metaplasia | ||
| WIM: Wild intestinal metaplasia | ||
| Liver |  | HCC: Hepatocellular carcinoma |
| NAFLD: Non-alcoholic fatty liver disease | ||
| Lung |  | AAH: Atypical adenomatous hyperplasia |
| AIS: Adenocarcinoma in situ | ||
| IAC: Invasive lung adenocarcinoma | ||
| MIA: Minimally invasive adenocarcinoma | ||
| Oral Cavity | 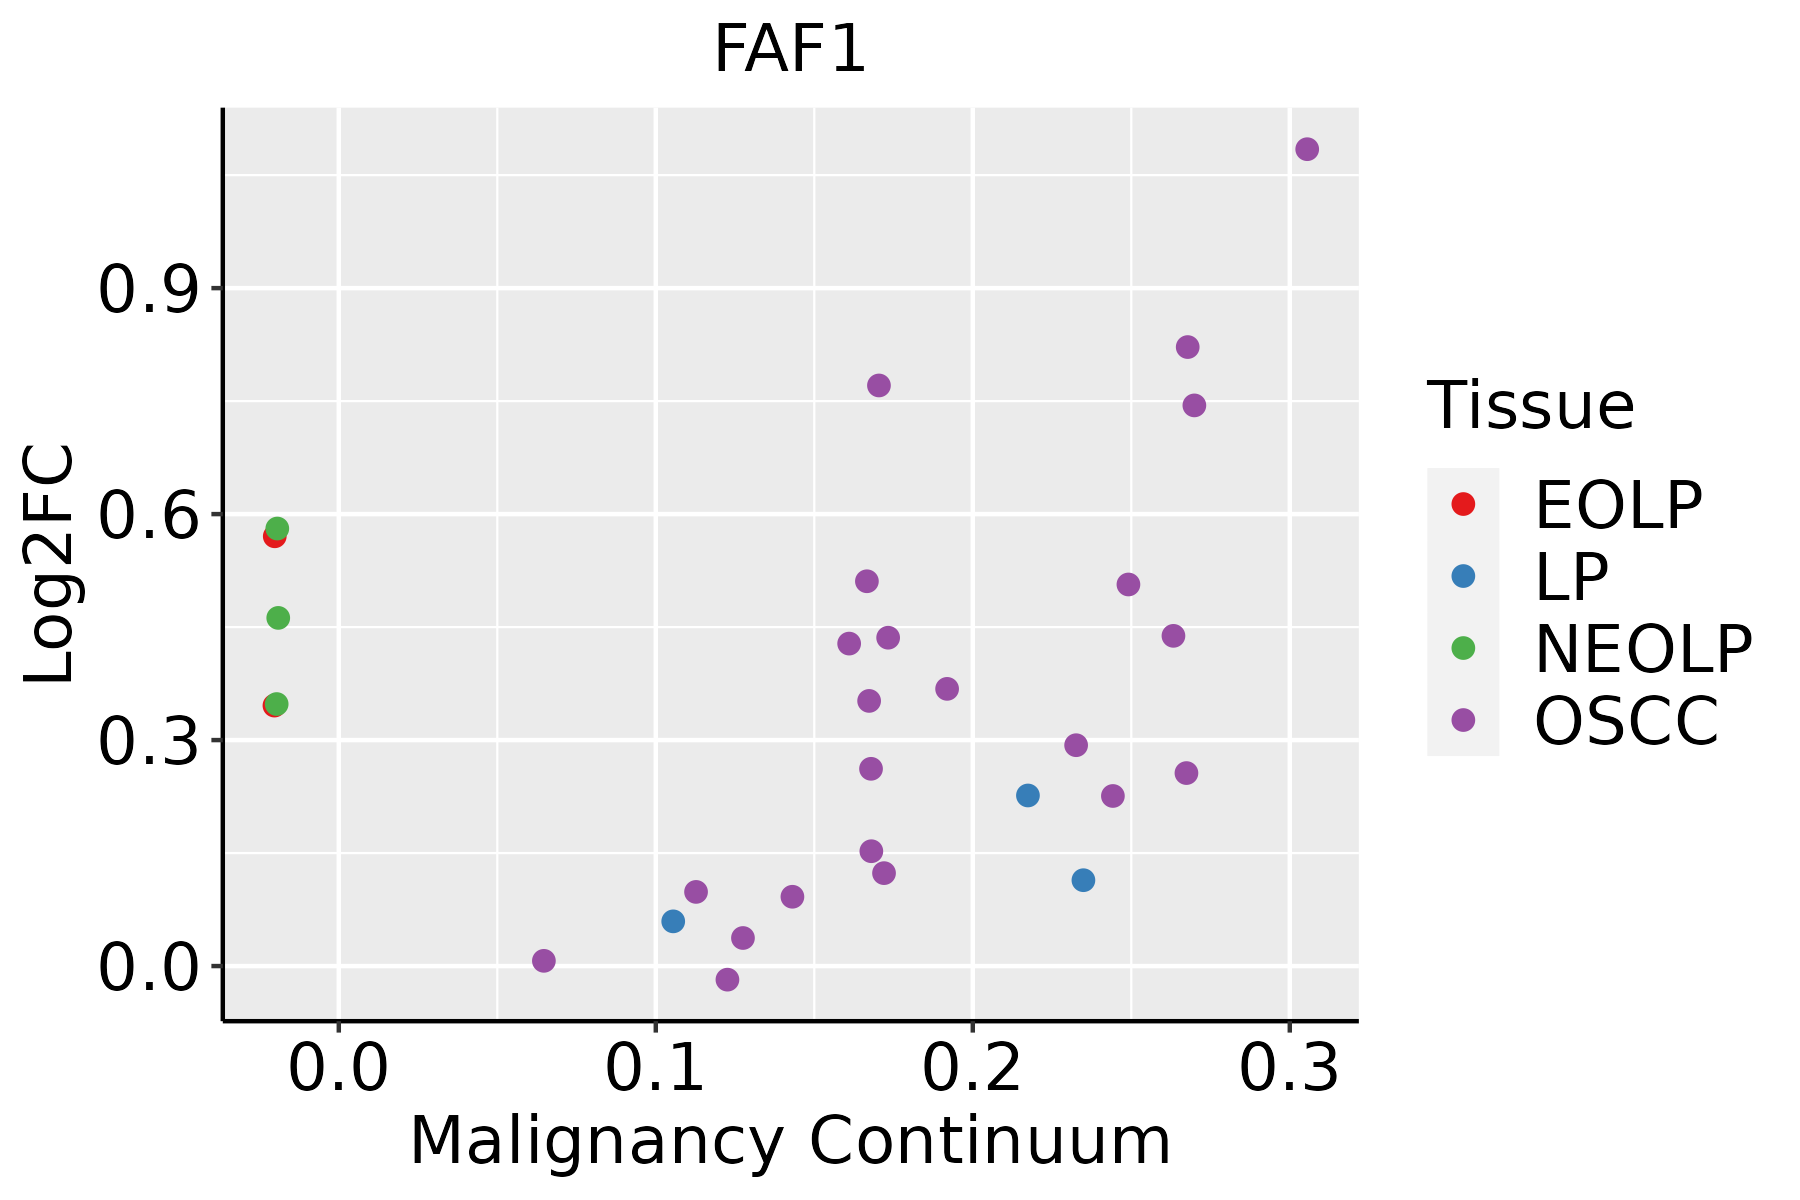 | EOLP: Erosive Oral lichen planus |
| LP: leukoplakia | ||
| NEOLP: Non-erosive oral lichen planus | ||
| OSCC: Oral squamous cell carcinoma | ||
| Prostate | 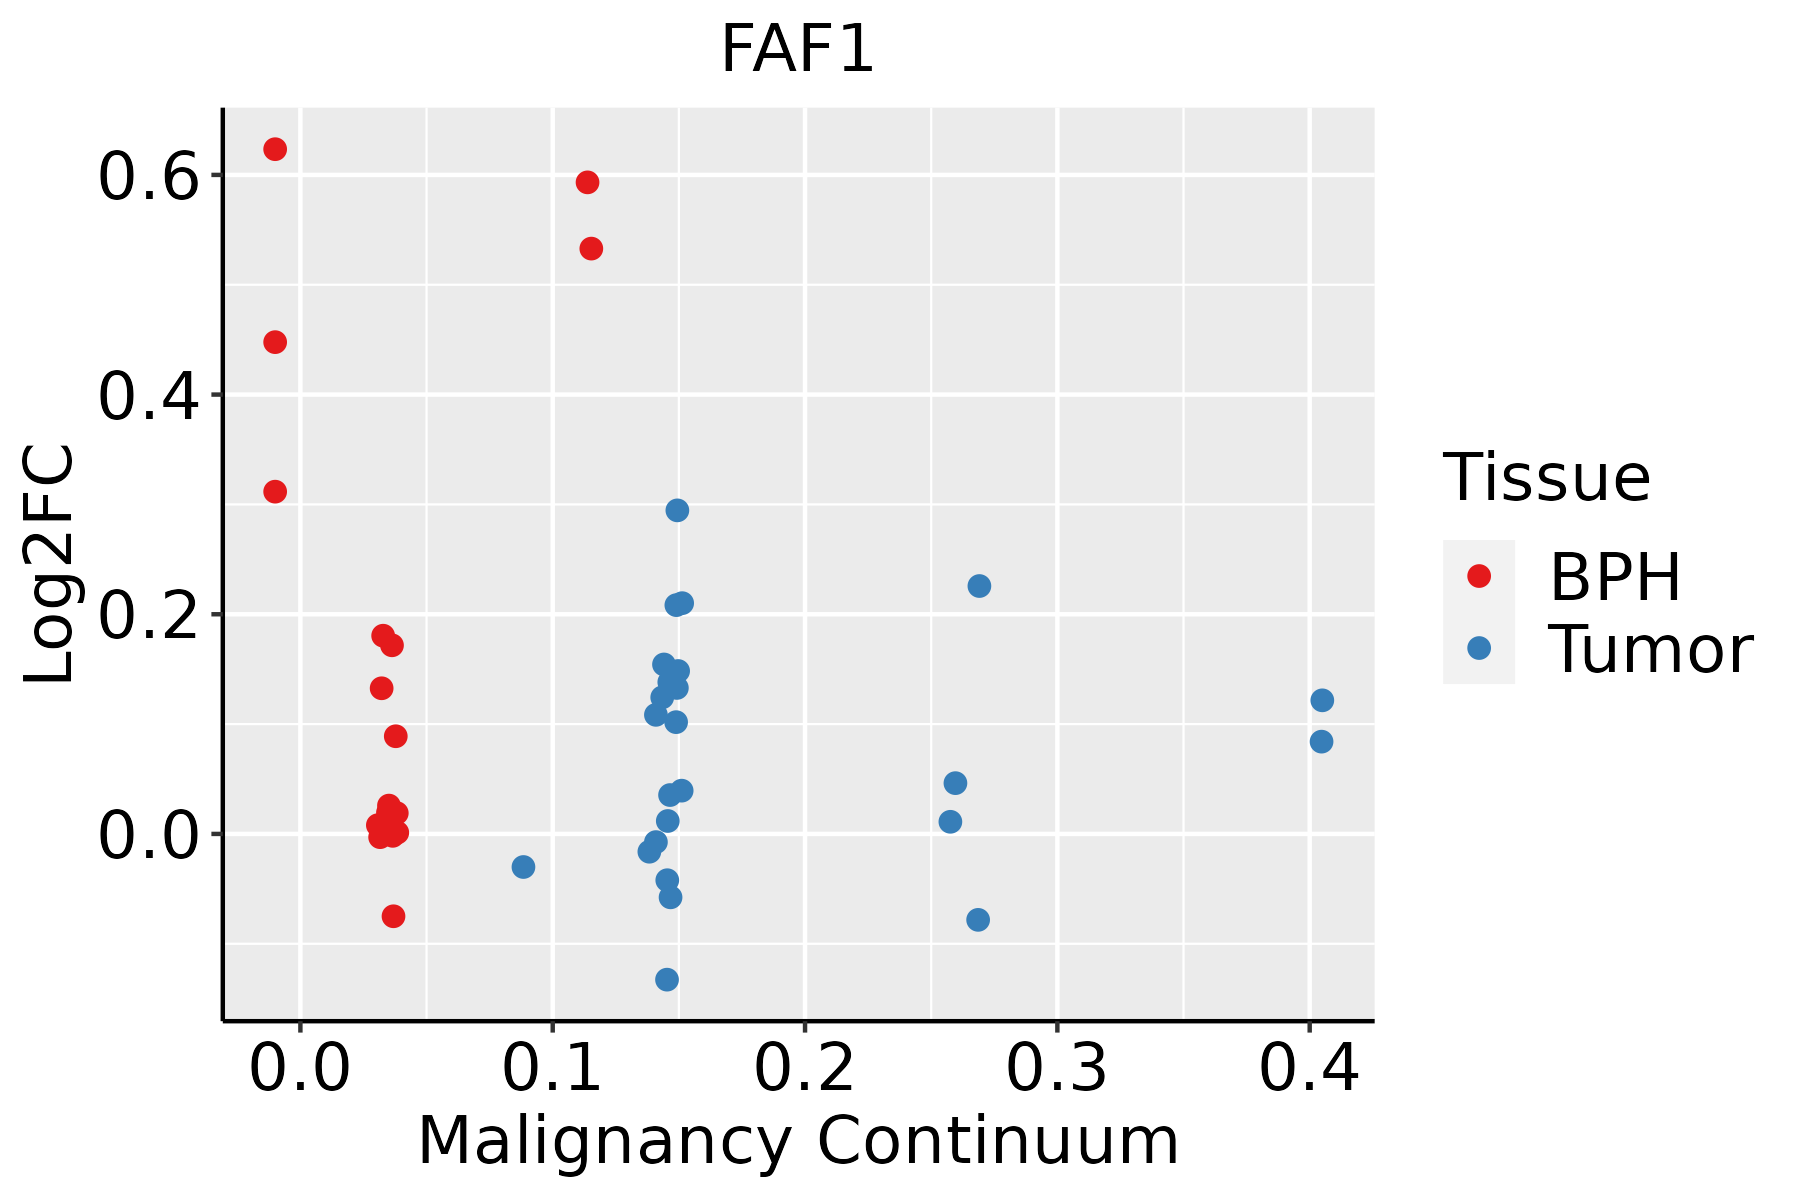 | BPH: Benign Prostatic Hyperplasia |
| Skin | 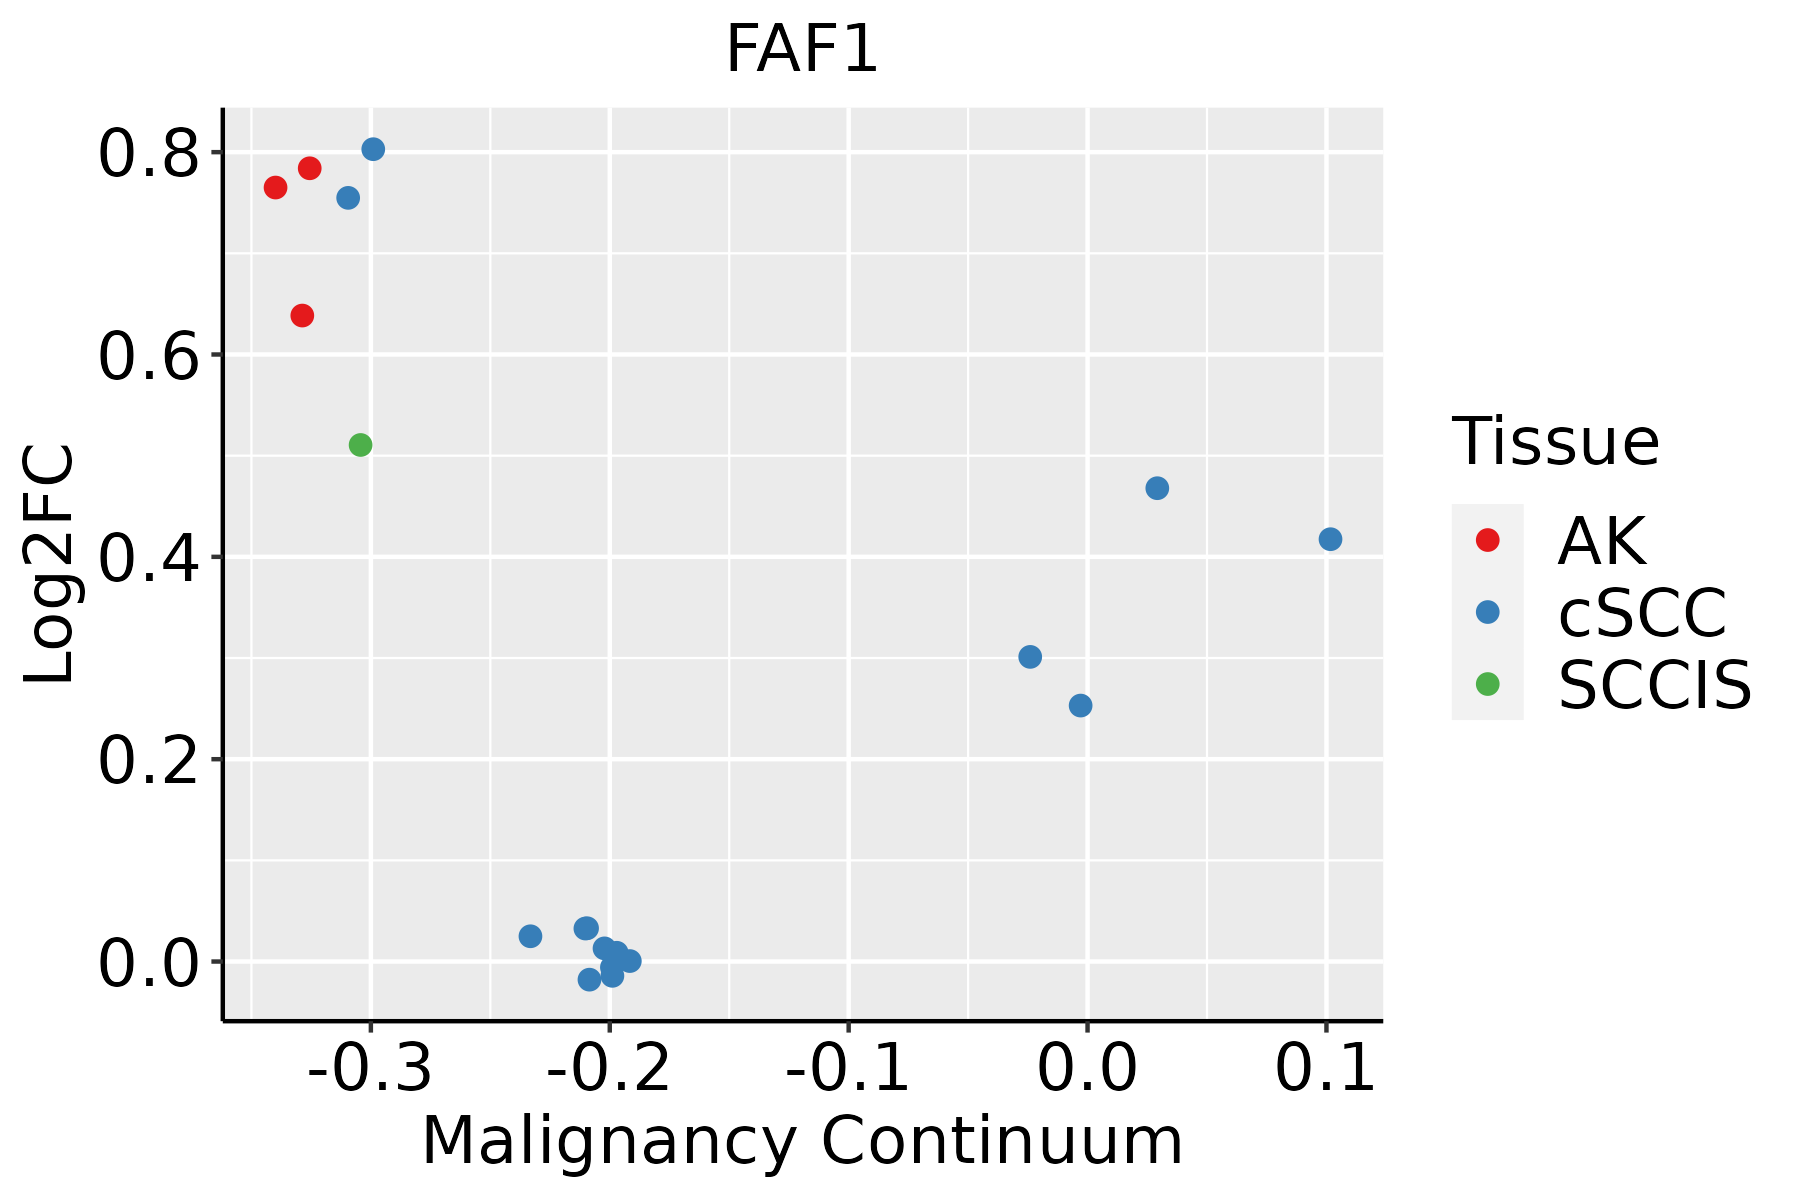 | AK: Actinic keratosis |
| cSCC: Cutaneous squamous cell carcinoma | ||
| SCCIS:squamous cell carcinoma in situ | ||
| Thyroid |  | ATC: Anaplastic thyroid cancer |
| HT: Hashimoto's thyroiditis | ||
| PTC: Papillary thyroid cancer |
| ∗log2FC in expression of this searched gene in stem-like cells from each diseased tissue sample relative to stem-like cells in normal samples in each tissue plotted against the malignancy continuum. Samples are colored based on if they are from different disease stage. |
Top |
Malignant transformation related pathway analysis |
| Find out the enriched GO biological processes and KEGG pathways involved in transition from healthy to precancer to cancer |
| Tissue | Disease Stage | Enriched GO biological Processes |
| Colorectum | AD |  |
| Colorectum | SER |  |
| Colorectum | MSS |  |
| Colorectum | MSI-H |  |
| Colorectum | FAP |  |
| ∗Top 15 enriched GO BP terms are showed in the bar plot of each disease state in each tissue. Each row represents a significant GO biological process which is colored according to the -log10(p.adjust). |
| Page: 1 2 3 4 5 6 7 8 9 |
| GO ID | Tissue | Disease Stage | Description | Gene Ratio | Bg Ratio | pvalue | p.adjust | Count |
| GO:004217610 | Cervix | CC | regulation of protein catabolic process | 104/2311 | 391/18723 | 9.39e-15 | 9.36e-12 | 104 |
| GO:200123310 | Cervix | CC | regulation of apoptotic signaling pathway | 96/2311 | 356/18723 | 4.08e-14 | 3.05e-11 | 96 |
| GO:190336210 | Cervix | CC | regulation of cellular protein catabolic process | 72/2311 | 255/18723 | 5.98e-12 | 2.10e-09 | 72 |
| GO:004573210 | Cervix | CC | positive regulation of protein catabolic process | 65/2311 | 231/18723 | 7.44e-11 | 1.39e-08 | 65 |
| GO:001049810 | Cervix | CC | proteasomal protein catabolic process | 111/2311 | 490/18723 | 8.98e-11 | 1.58e-08 | 111 |
| GO:000989610 | Cervix | CC | positive regulation of catabolic process | 109/2311 | 492/18723 | 5.26e-10 | 6.99e-08 | 109 |
| GO:004325410 | Cervix | CC | regulation of protein-containing complex assembly | 96/2311 | 428/18723 | 2.91e-09 | 3.05e-07 | 96 |
| GO:00512359 | Cervix | CC | maintenance of location | 78/2311 | 327/18723 | 5.18e-09 | 4.92e-07 | 78 |
| GO:004316110 | Cervix | CC | proteasome-mediated ubiquitin-dependent protein catabolic process | 91/2311 | 412/18723 | 1.65e-08 | 1.25e-06 | 91 |
| GO:003133110 | Cervix | CC | positive regulation of cellular catabolic process | 91/2311 | 427/18723 | 9.64e-08 | 5.25e-06 | 91 |
| GO:190336410 | Cervix | CC | positive regulation of cellular protein catabolic process | 43/2311 | 155/18723 | 1.80e-07 | 8.28e-06 | 43 |
| GO:20012357 | Cervix | CC | positive regulation of apoptotic signaling pathway | 37/2311 | 126/18723 | 2.70e-07 | 1.12e-05 | 37 |
| GO:009719110 | Cervix | CC | extrinsic apoptotic signaling pathway | 52/2311 | 219/18723 | 2.06e-06 | 6.34e-05 | 52 |
| GO:003133410 | Cervix | CC | positive regulation of protein-containing complex assembly | 55/2311 | 237/18723 | 2.25e-06 | 6.73e-05 | 55 |
| GO:00510904 | Cervix | CC | regulation of DNA-binding transcription factor activity | 87/2311 | 440/18723 | 4.85e-06 | 1.22e-04 | 87 |
| GO:200123610 | Cervix | CC | regulation of extrinsic apoptotic signaling pathway | 37/2311 | 151/18723 | 2.80e-05 | 4.65e-04 | 37 |
| GO:004518510 | Cervix | CC | maintenance of protein location | 26/2311 | 94/18723 | 4.85e-05 | 7.34e-04 | 26 |
| GO:20012386 | Cervix | CC | positive regulation of extrinsic apoptotic signaling pathway | 14/2311 | 48/18723 | 1.48e-03 | 1.15e-02 | 14 |
| GO:00457404 | Cervix | CC | positive regulation of DNA replication | 12/2311 | 40/18723 | 2.44e-03 | 1.71e-02 | 12 |
| GO:00062602 | Cervix | CC | DNA replication | 48/2311 | 260/18723 | 2.70e-03 | 1.85e-02 | 48 |
| Page: 1 2 3 4 5 6 7 8 9 10 11 12 13 14 15 16 17 18 19 20 21 22 23 24 25 26 27 28 29 30 31 32 33 |
| Pathway ID | Tissue | Disease Stage | Description | Gene Ratio | Bg Ratio | pvalue | p.adjust | qvalue | Count |
| Page: 1 |
Top |
Cell-cell communication analysis |
| Identification of potential cell-cell interactions between two cell types and their ligand-receptor pairs for different disease states |
| Ligand | Receptor | LRpair | Pathway | Tissue | Disease Stage |
| Page: 1 |
Top |
Single-cell gene regulatory network inference analysis |
| Find out the significant the regulons (TFs) and the target genes of each regulon across cell types for different disease states |
| TF | Cell Type | Tissue | Disease Stage | Target Gene | RSS | Regulon Activity |
| ∗The dot plots of a searched regulon are shown for all cell subpopulations in each disease state of each tissue based on the regulon specific score inferred using pySCENIC and by calculating the average expression. |
| Page: 1 |
Top |
Somatic mutation of malignant transformation related genes |
| Annotation of somatic variants for genes involved in malignant transformation |
| Hugo Symbol | Variant Class | Variant Classification | dbSNP RS | HGVSc | HGVSp | HGVSp Short | SWISSPROT | BIOTYPE | SIFT | PolyPhen | Tumor Sample Barcode | Tissue | Histology | Sex | Age | Stage | Therapy Types | Drugs | Outcome |
| FAF1 | SNV | Missense_Mutation | c.1948G>C | p.Glu650Gln | p.E650Q | Q9UNN5 | protein_coding | deleterious_low_confidence(0) | probably_damaging(0.954) | TCGA-AC-A23H-01 | Breast | breast invasive carcinoma | Female | >=65 | I/II | Unknown | Unknown | PD | |
| FAF1 | SNV | Missense_Mutation | novel | c.164A>C | p.Glu55Ala | p.E55A | Q9UNN5 | protein_coding | tolerated(0.11) | benign(0.007) | TCGA-AN-A046-01 | Breast | breast invasive carcinoma | Female | >=65 | I/II | Unknown | Unknown | SD |
| FAF1 | SNV | Missense_Mutation | c.1639N>C | p.Glu547Gln | p.E547Q | Q9UNN5 | protein_coding | tolerated(0.14) | probably_damaging(0.996) | TCGA-D8-A27G-01 | Breast | breast invasive carcinoma | Female | >=65 | I/II | Unknown | Unknown | SD | |
| FAF1 | SNV | Missense_Mutation | c.604N>A | p.Glu202Lys | p.E202K | Q9UNN5 | protein_coding | tolerated(0.77) | benign(0.164) | TCGA-EX-A1H6-01 | Cervix | cervical & endocervical cancer | Female | <65 | I/II | Unknown | Unknown | SD | |
| FAF1 | SNV | Missense_Mutation | novel | c.1479A>T | p.Glu493Asp | p.E493D | Q9UNN5 | protein_coding | tolerated(0.57) | benign(0.072) | TCGA-MA-AA3Y-01 | Cervix | cervical & endocervical cancer | Female | <65 | I/II | Unknown | Unknown | SD |
| FAF1 | insertion | Frame_Shift_Ins | novel | c.1597_1598insGA | p.Met533ArgfsTer26 | p.M533Rfs*26 | Q9UNN5 | protein_coding | TCGA-EA-A410-01 | Cervix | cervical & endocervical cancer | Female | <65 | I/II | Unknown | Unknown | SD | ||
| FAF1 | SNV | Missense_Mutation | novel | c.1647A>C | p.Glu549Asp | p.E549D | Q9UNN5 | protein_coding | tolerated(0.11) | possibly_damaging(0.679) | TCGA-AD-5900-01 | Colorectum | colon adenocarcinoma | Male | >=65 | I/II | Unknown | Unknown | SD |
| FAF1 | SNV | Missense_Mutation | c.1498N>A | p.Glu500Lys | p.E500K | Q9UNN5 | protein_coding | deleterious(0) | possibly_damaging(0.679) | TCGA-AD-6963-01 | Colorectum | colon adenocarcinoma | Male | <65 | I/II | Unknown | Unknown | SD | |
| FAF1 | SNV | Missense_Mutation | c.1805T>G | p.Phe602Cys | p.F602C | Q9UNN5 | protein_coding | deleterious(0) | probably_damaging(0.989) | TCGA-AZ-4315-01 | Colorectum | colon adenocarcinoma | Male | <65 | I/II | Unknown | Unknown | SD | |
| FAF1 | SNV | Missense_Mutation | novel | c.571N>C | p.Asn191His | p.N191H | Q9UNN5 | protein_coding | tolerated(0.2) | possibly_damaging(0.453) | TCGA-CA-6717-01 | Colorectum | colon adenocarcinoma | Male | <65 | I/II | Chemotherapy | oxaliplatin | CR |
| Page: 1 2 3 4 5 6 7 8 |
Top |
Related drugs of malignant transformation related genes |
| Identification of chemicals and drugs interact with genes involved in malignant transfromation |
| (DGIdb 4.0) |
| Entrez ID | Symbol | Category | Interaction Types | Drug Claim Name | Drug Name | PMIDs |
| Page: 1 |

Copyright 2023-Present -The University of Texas Health Science Center at Houston |