
|
|||||
|
 | |
| |
| |
| |
| |
| |
|
Gene: FADS6 |
Gene summary for FADS6 |
| Gene information | Species | Human | Gene symbol | FADS6 | Gene ID | 283985 |
| Gene name | fatty acid desaturase 6 | |
| Gene Alias | FP18279 | |
| Cytomap | 17q25.1 | |
| Gene Type | protein-coding | GO ID | GO:0006082 | UniProtAcc | A0A087WYB9 |
Top |
Malignant transformation analysis |
| Identification of the aberrant gene expression in precancerous and cancerous lesions by comparing the gene expression of stem-like cells in diseased tissues with normal stem cells |
| Entrez ID | Symbol | Replicates | Species | Organ | Tissue | Adj P-value | Log2FC | Malignancy |
| 283985 | FADS6 | HCC1 | Human | Liver | HCC | 2.10e-06 | 8.67e-01 | 0.5336 |
| 283985 | FADS6 | HCC2 | Human | Liver | HCC | 1.40e-26 | 1.20e+00 | 0.5341 |
| 283985 | FADS6 | HCC5 | Human | Liver | HCC | 1.47e-12 | 7.29e-01 | 0.4932 |
| Page: 1 |
| Tissue | Expression Dynamics | Abbreviation |
| Liver | 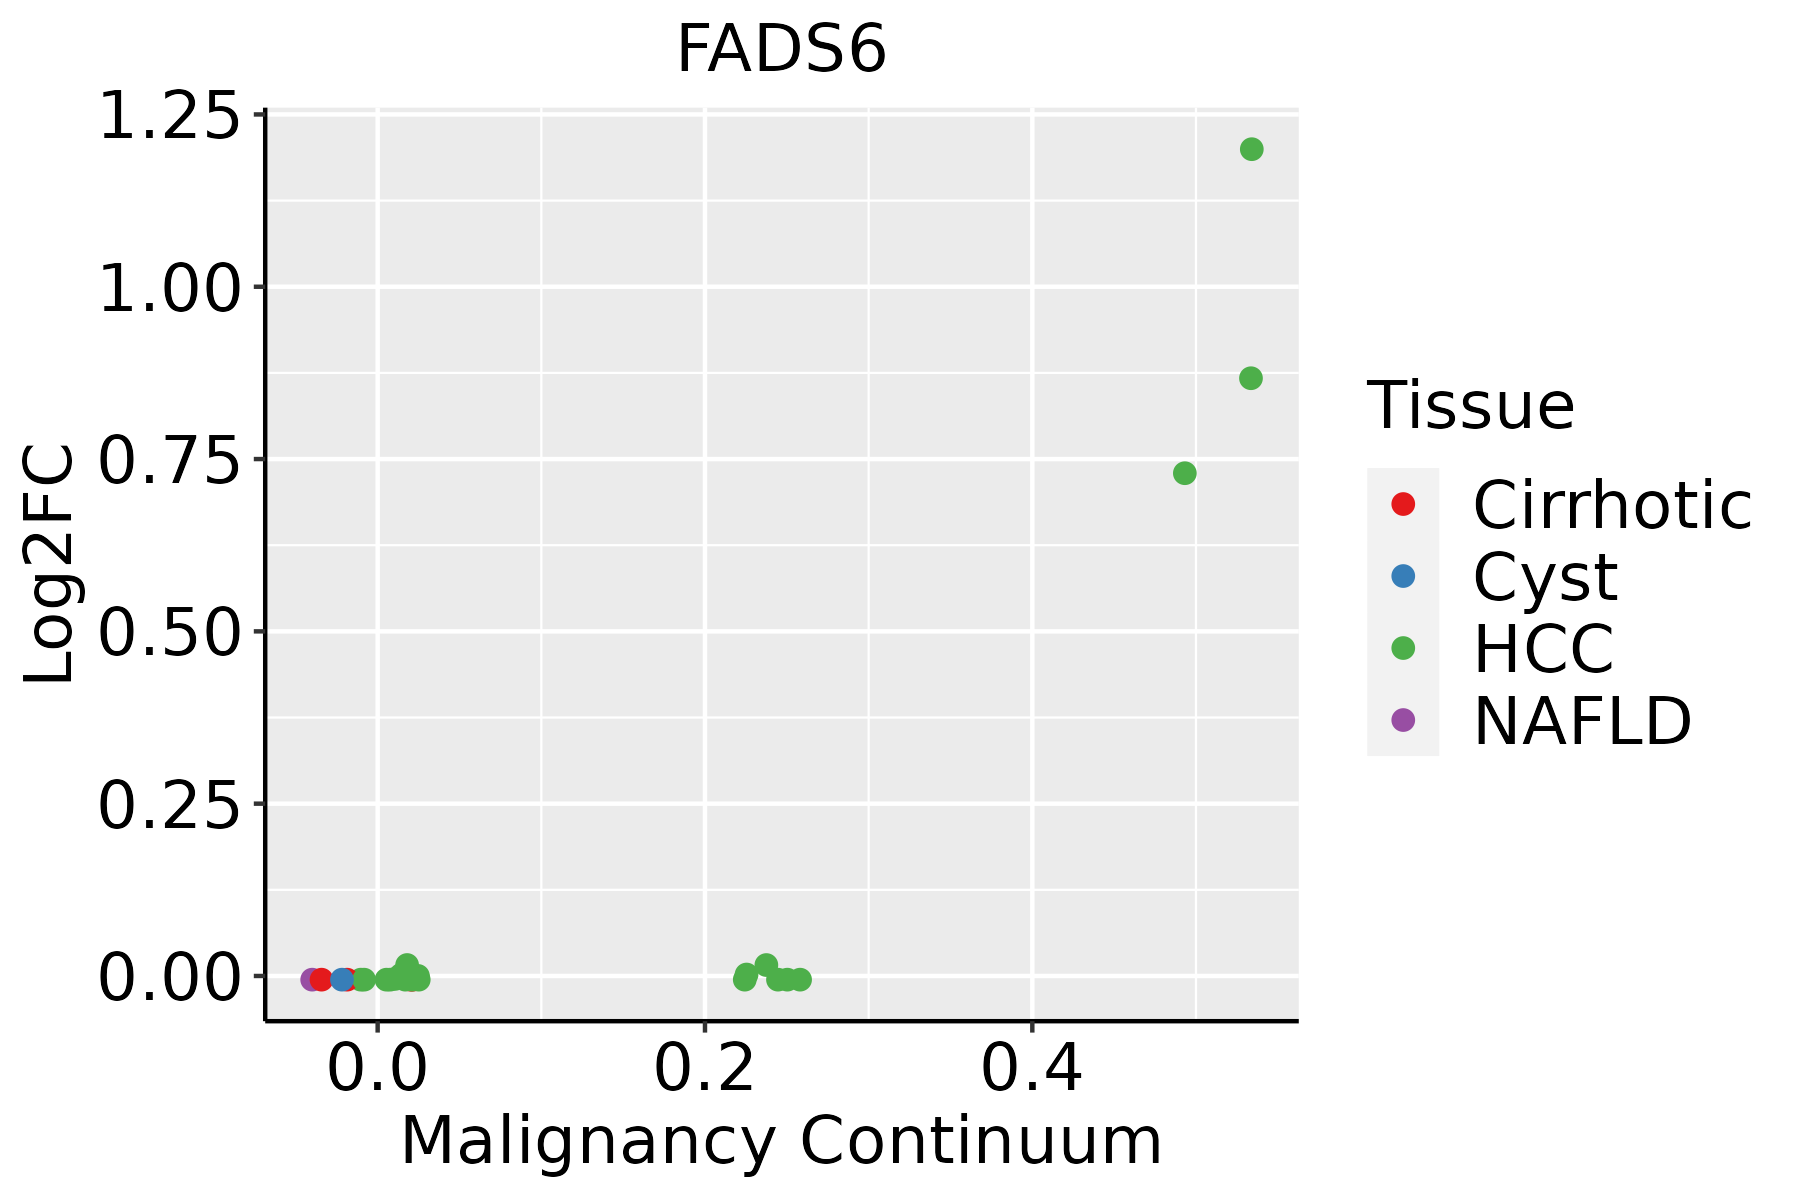 | HCC: Hepatocellular carcinoma |
| NAFLD: Non-alcoholic fatty liver disease |
| ∗log2FC in expression of this searched gene in stem-like cells from each diseased tissue sample relative to stem-like cells in normal samples in each tissue plotted against the malignancy continuum. Samples are colored based on if they are from different disease stage. |
Top |
Malignant transformation related pathway analysis |
| Find out the enriched GO biological processes and KEGG pathways involved in transition from healthy to precancer to cancer |
| Tissue | Disease Stage | Enriched GO biological Processes |
| Colorectum | AD |  |
| Colorectum | SER |  |
| Colorectum | MSS |  |
| Colorectum | MSI-H |  |
| Colorectum | FAP |  |
| ∗Top 15 enriched GO BP terms are showed in the bar plot of each disease state in each tissue. Each row represents a significant GO biological process which is colored according to the -log10(p.adjust). |
| Page: 1 2 3 4 5 6 7 8 9 |
| GO ID | Tissue | Disease Stage | Description | Gene Ratio | Bg Ratio | pvalue | p.adjust | Count |
| GO:001605321 | Liver | HCC | organic acid biosynthetic process | 200/7958 | 316/18723 | 5.24e-14 | 3.22e-12 | 200 |
| GO:000663122 | Liver | HCC | fatty acid metabolic process | 238/7958 | 390/18723 | 8.24e-14 | 4.84e-12 | 238 |
| GO:004639421 | Liver | HCC | carboxylic acid biosynthetic process | 198/7958 | 314/18723 | 1.19e-13 | 6.78e-12 | 198 |
| GO:007233021 | Liver | HCC | monocarboxylic acid biosynthetic process | 129/7958 | 214/18723 | 1.08e-07 | 2.09e-06 | 129 |
| GO:000663321 | Liver | HCC | fatty acid biosynthetic process | 96/7958 | 163/18723 | 1.71e-05 | 1.85e-04 | 96 |
| Page: 1 |
| Pathway ID | Tissue | Disease Stage | Description | Gene Ratio | Bg Ratio | pvalue | p.adjust | qvalue | Count |
| Page: 1 |
Top |
Cell-cell communication analysis |
| Identification of potential cell-cell interactions between two cell types and their ligand-receptor pairs for different disease states |
| Ligand | Receptor | LRpair | Pathway | Tissue | Disease Stage |
| Page: 1 |
Top |
Single-cell gene regulatory network inference analysis |
| Find out the significant the regulons (TFs) and the target genes of each regulon across cell types for different disease states |
| TF | Cell Type | Tissue | Disease Stage | Target Gene | RSS | Regulon Activity |
| ∗The dot plots of a searched regulon are shown for all cell subpopulations in each disease state of each tissue based on the regulon specific score inferred using pySCENIC and by calculating the average expression. |
| Page: 1 |
Top |
Somatic mutation of malignant transformation related genes |
| Annotation of somatic variants for genes involved in malignant transformation |
| Hugo Symbol | Variant Class | Variant Classification | dbSNP RS | HGVSc | HGVSp | HGVSp Short | SWISSPROT | BIOTYPE | SIFT | PolyPhen | Tumor Sample Barcode | Tissue | Histology | Sex | Age | Stage | Therapy Types | Drugs | Outcome |
| FADS6 | SNV | Missense_Mutation | rs375851737 | c.823C>T | p.Arg275Trp | p.R275W | protein_coding | deleterious(0) | benign(0.233) | TCGA-B6-A2IU-01 | Breast | breast invasive carcinoma | Female | <65 | I/II | Unknown | Unknown | PD | |
| FADS6 | insertion | Frame_Shift_Ins | novel | c.893_894insAATGGGAGTAGAAGGGCTTCTGTTGACAGGCTTTGAGGATGAAATG | p.His298GlnfsTer33 | p.H298Qfs*33 | protein_coding | TCGA-B6-A0I8-01 | Breast | breast invasive carcinoma | Female | <65 | I/II | Unknown | Unknown | PD | |||
| FADS6 | SNV | Missense_Mutation | novel | c.680T>C | p.Leu227Pro | p.L227P | protein_coding | deleterious(0.01) | probably_damaging(0.921) | TCGA-AA-3663-01 | Colorectum | colon adenocarcinoma | Male | <65 | I/II | Unknown | Unknown | SD | |
| FADS6 | SNV | Missense_Mutation | c.949A>G | p.Met317Val | p.M317V | protein_coding | deleterious(0) | probably_damaging(0.992) | TCGA-AA-3715-01 | Colorectum | colon adenocarcinoma | Male | >=65 | I/II | Unknown | Unknown | PD | ||
| FADS6 | SNV | Missense_Mutation | novel | c.67N>A | p.Glu23Lys | p.E23K | protein_coding | tolerated(0.89) | benign(0.011) | TCGA-AA-3977-01 | Colorectum | colon adenocarcinoma | Male | >=65 | I/II | Unknown | Unknown | SD | |
| FADS6 | SNV | Missense_Mutation | novel | c.1059N>T | p.Glu353Asp | p.E353D | protein_coding | tolerated(0.2) | possibly_damaging(0.769) | TCGA-AP-A051-01 | Endometrium | uterine corpus endometrioid carcinoma | Female | >=65 | I/II | Unknown | Unknown | SD | |
| FADS6 | SNV | Missense_Mutation | c.958A>C | p.Lys320Gln | p.K320Q | protein_coding | tolerated(0.08) | probably_damaging(1) | TCGA-AP-A0LM-01 | Endometrium | uterine corpus endometrioid carcinoma | Female | <65 | III/IV | Chemotherapy | cisplatin | SD | ||
| FADS6 | SNV | Missense_Mutation | rs774251462 | c.530G>A | p.Arg177His | p.R177H | protein_coding | deleterious(0.01) | probably_damaging(0.961) | TCGA-AP-A0LM-01 | Endometrium | uterine corpus endometrioid carcinoma | Female | <65 | III/IV | Chemotherapy | cisplatin | SD | |
| FADS6 | SNV | Missense_Mutation | novel | c.1031N>A | p.Arg344His | p.R344H | protein_coding | deleterious(0) | probably_damaging(0.998) | TCGA-AP-A0LS-01 | Endometrium | uterine corpus endometrioid carcinoma | Female | <65 | I/II | Unknown | Unknown | SD | |
| FADS6 | SNV | Missense_Mutation | rs751732570 | c.754N>T | p.Pro252Ser | p.P252S | protein_coding | deleterious(0) | possibly_damaging(0.89) | TCGA-AP-A1DK-01 | Endometrium | uterine corpus endometrioid carcinoma | Female | <65 | I/II | Unknown | Unknown | SD |
| Page: 1 2 3 |
Top |
Related drugs of malignant transformation related genes |
| Identification of chemicals and drugs interact with genes involved in malignant transfromation |
| (DGIdb 4.0) |
| Entrez ID | Symbol | Category | Interaction Types | Drug Claim Name | Drug Name | PMIDs |
| Page: 1 |

Copyright 2023-Present -The University of Texas Health Science Center at Houston |