
|
|||||
|
 | |
| |
| |
| |
| |
| |
|
Gene: FADS3 |
Gene summary for FADS3 |
| Gene information | Species | Human | Gene symbol | FADS3 | Gene ID | 3995 |
| Gene name | fatty acid desaturase 3 | |
| Gene Alias | CYB5RP | |
| Cytomap | 11q12.2 | |
| Gene Type | protein-coding | GO ID | GO:0006082 | UniProtAcc | A0A024R564 |
Top |
Malignant transformation analysis |
| Identification of the aberrant gene expression in precancerous and cancerous lesions by comparing the gene expression of stem-like cells in diseased tissues with normal stem cells |
| Entrez ID | Symbol | Replicates | Species | Organ | Tissue | Adj P-value | Log2FC | Malignancy |
| 3995 | FADS3 | LZE7T | Human | Esophagus | ESCC | 1.29e-05 | 2.29e-01 | 0.0667 |
| 3995 | FADS3 | P2T-E | Human | Esophagus | ESCC | 5.19e-03 | 1.03e-01 | 0.1177 |
| 3995 | FADS3 | P4T-E | Human | Esophagus | ESCC | 2.63e-17 | 3.89e-01 | 0.1323 |
| 3995 | FADS3 | P5T-E | Human | Esophagus | ESCC | 4.72e-32 | 6.24e-01 | 0.1327 |
| 3995 | FADS3 | P10T-E | Human | Esophagus | ESCC | 2.94e-13 | 2.81e-01 | 0.116 |
| 3995 | FADS3 | P11T-E | Human | Esophagus | ESCC | 8.82e-20 | 7.17e-01 | 0.1426 |
| 3995 | FADS3 | P12T-E | Human | Esophagus | ESCC | 7.35e-11 | 1.70e-01 | 0.1122 |
| 3995 | FADS3 | P15T-E | Human | Esophagus | ESCC | 5.80e-05 | 1.99e-01 | 0.1149 |
| 3995 | FADS3 | P16T-E | Human | Esophagus | ESCC | 5.31e-13 | 2.51e-01 | 0.1153 |
| 3995 | FADS3 | P17T-E | Human | Esophagus | ESCC | 1.36e-03 | 2.49e-01 | 0.1278 |
| 3995 | FADS3 | P19T-E | Human | Esophagus | ESCC | 2.78e-11 | 6.77e-01 | 0.1662 |
| 3995 | FADS3 | P20T-E | Human | Esophagus | ESCC | 1.52e-04 | 1.88e-01 | 0.1124 |
| 3995 | FADS3 | P21T-E | Human | Esophagus | ESCC | 5.41e-33 | 6.53e-01 | 0.1617 |
| 3995 | FADS3 | P22T-E | Human | Esophagus | ESCC | 1.40e-08 | 2.05e-01 | 0.1236 |
| 3995 | FADS3 | P24T-E | Human | Esophagus | ESCC | 2.18e-14 | 2.65e-01 | 0.1287 |
| 3995 | FADS3 | P27T-E | Human | Esophagus | ESCC | 1.49e-04 | 1.82e-01 | 0.1055 |
| 3995 | FADS3 | P28T-E | Human | Esophagus | ESCC | 9.62e-25 | 5.21e-01 | 0.1149 |
| 3995 | FADS3 | P30T-E | Human | Esophagus | ESCC | 2.36e-02 | 1.27e-01 | 0.137 |
| 3995 | FADS3 | P31T-E | Human | Esophagus | ESCC | 8.16e-06 | 1.56e-01 | 0.1251 |
| 3995 | FADS3 | P32T-E | Human | Esophagus | ESCC | 8.31e-18 | 3.90e-01 | 0.1666 |
| Page: 1 2 3 4 5 |
| Tissue | Expression Dynamics | Abbreviation |
| Esophagus |  | ESCC: Esophageal squamous cell carcinoma |
| HGIN: High-grade intraepithelial neoplasias | ||
| LGIN: Low-grade intraepithelial neoplasias | ||
| Liver | 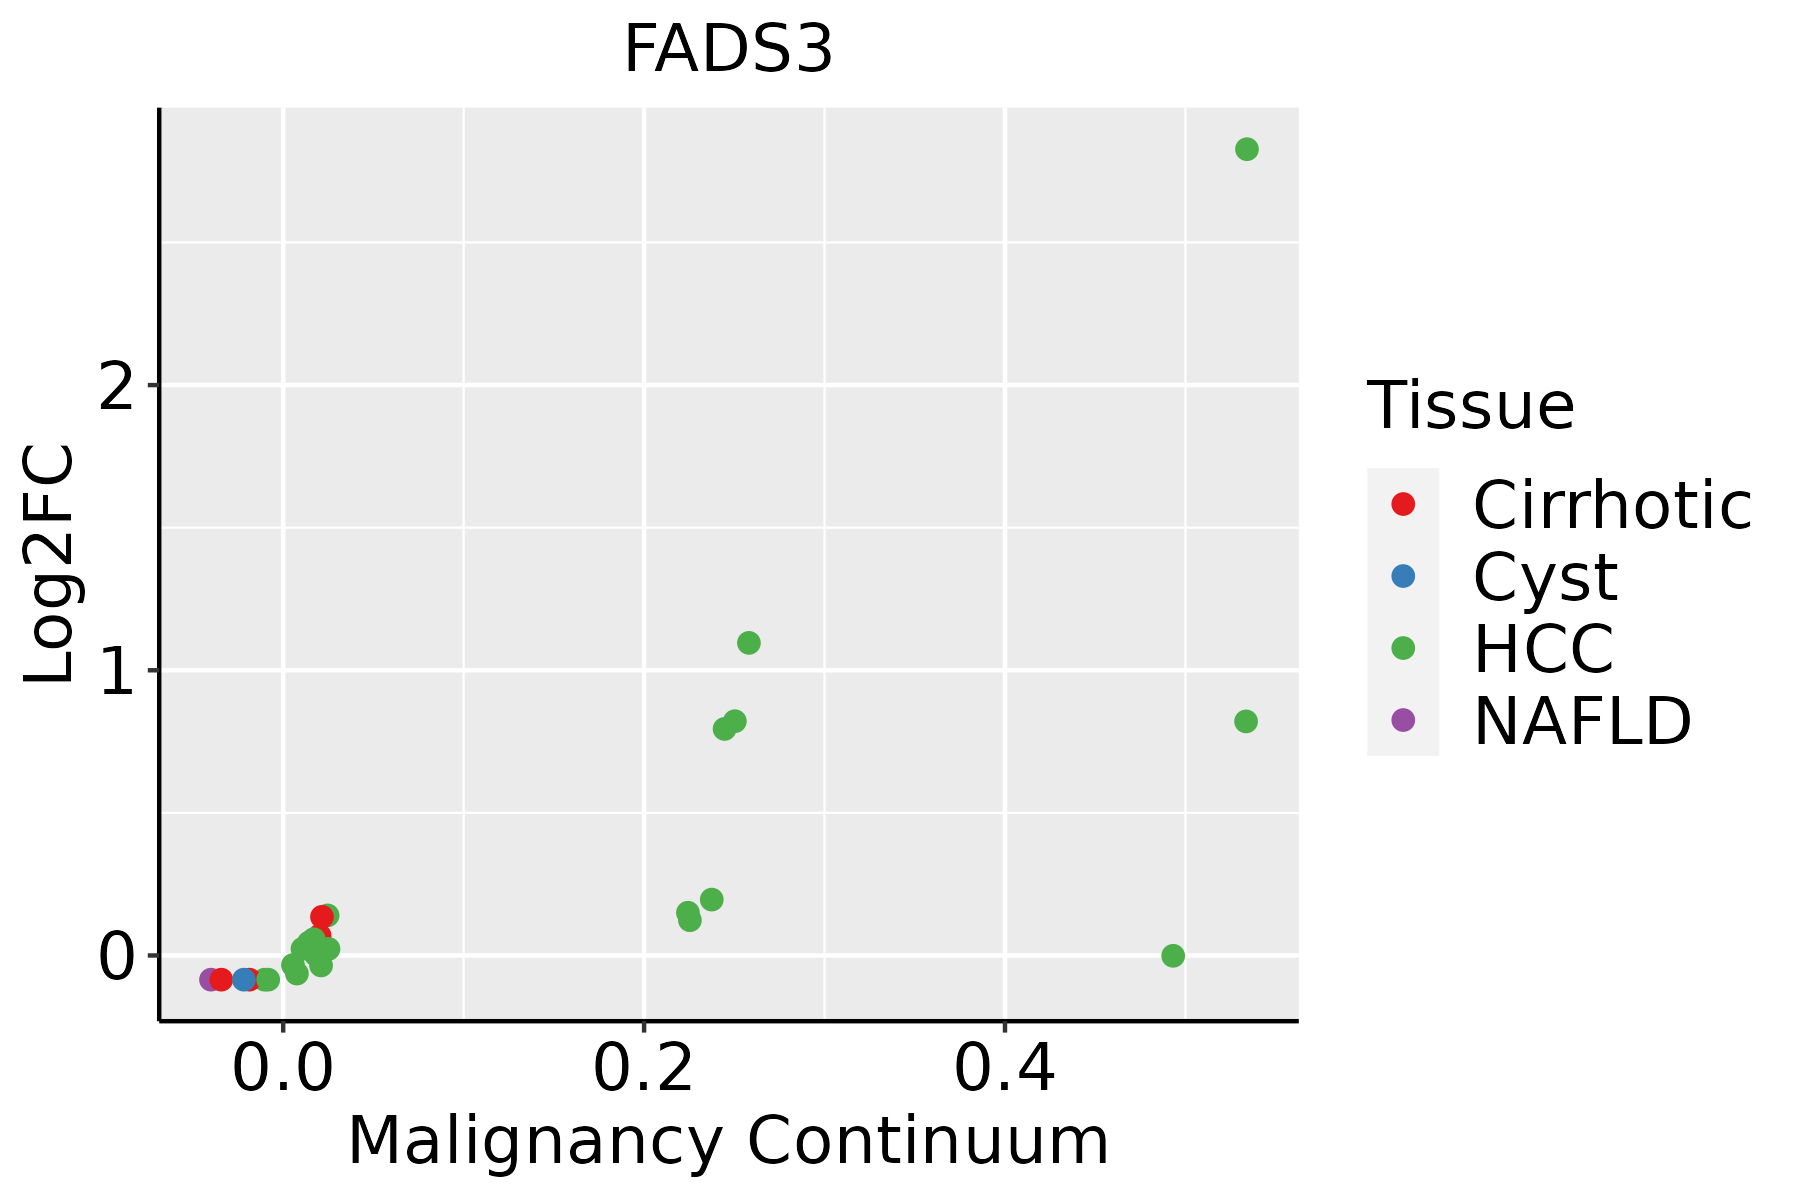 | HCC: Hepatocellular carcinoma |
| NAFLD: Non-alcoholic fatty liver disease | ||
| Oral Cavity |  | EOLP: Erosive Oral lichen planus |
| LP: leukoplakia | ||
| NEOLP: Non-erosive oral lichen planus | ||
| OSCC: Oral squamous cell carcinoma | ||
| Thyroid | 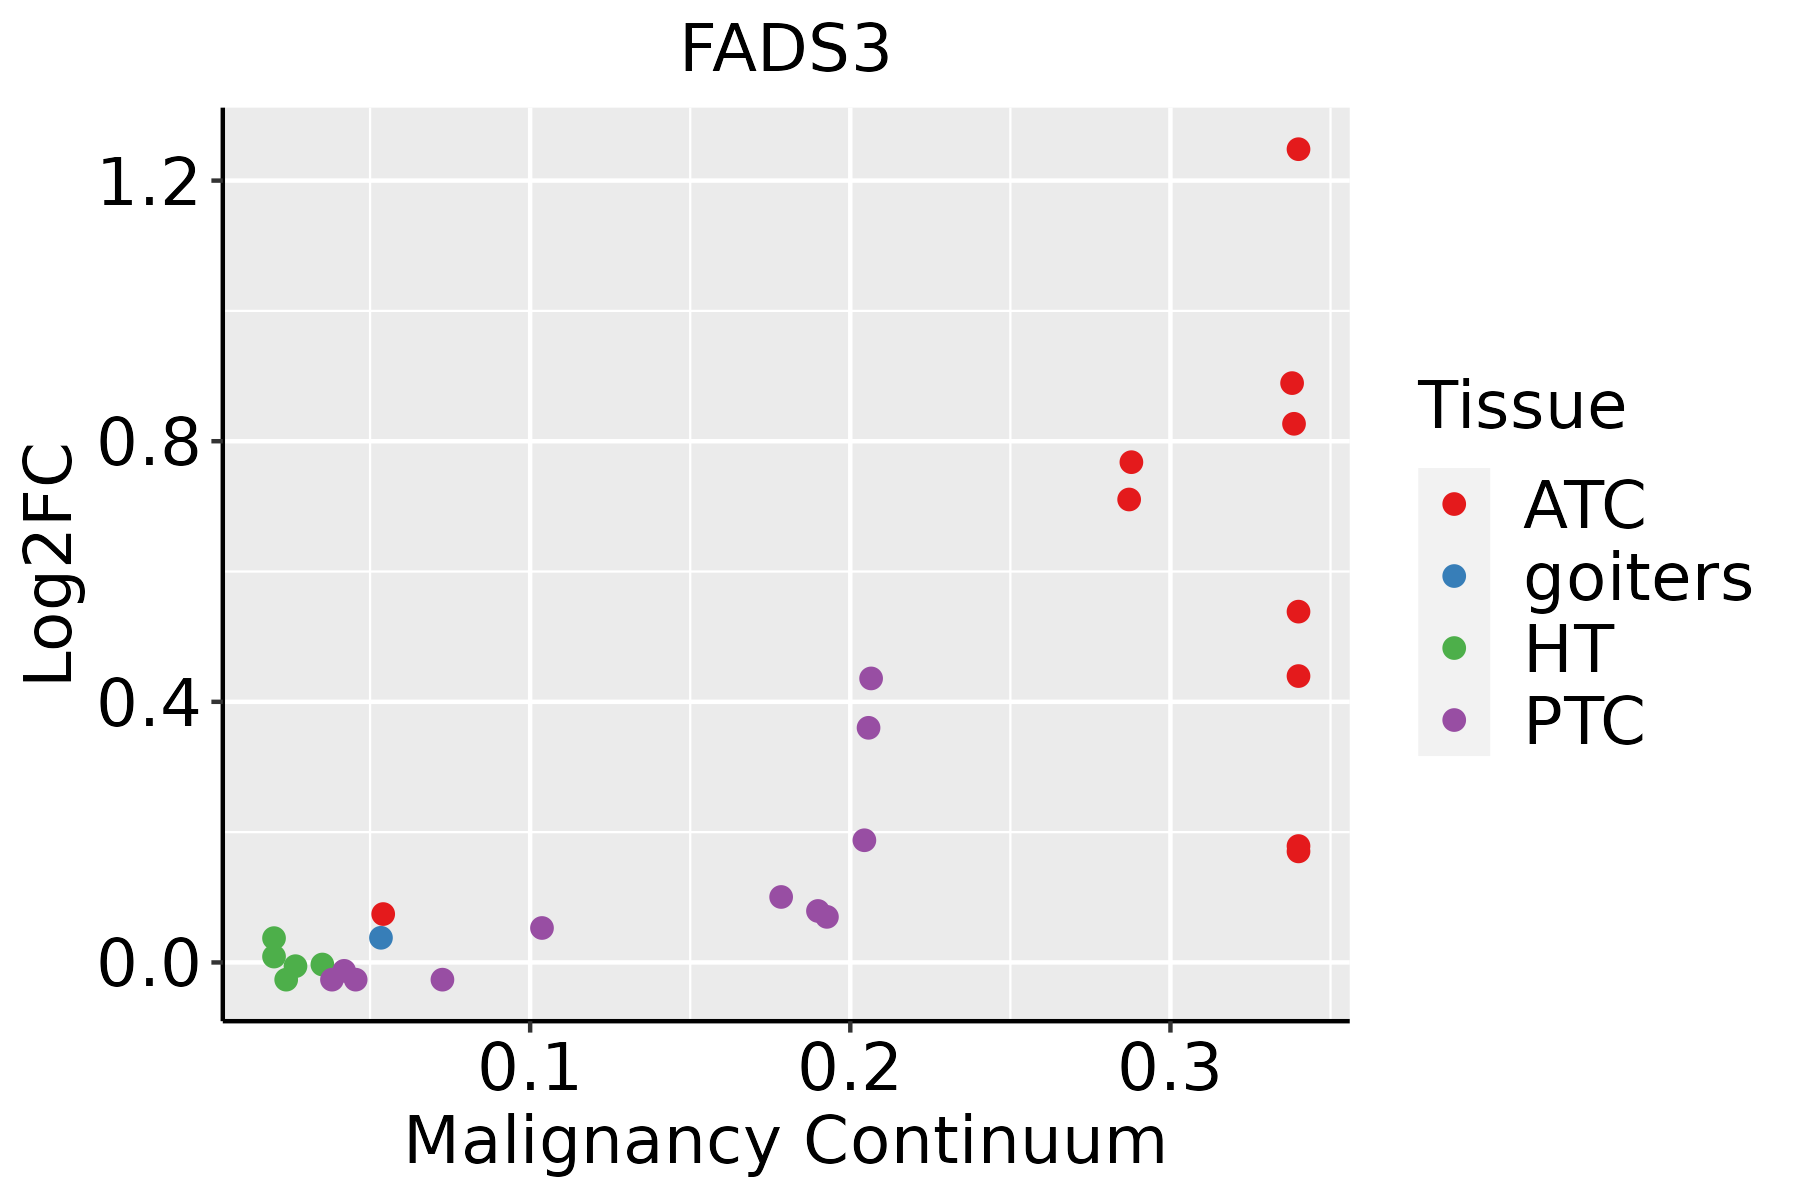 | ATC: Anaplastic thyroid cancer |
| HT: Hashimoto's thyroiditis | ||
| PTC: Papillary thyroid cancer |
| ∗log2FC in expression of this searched gene in stem-like cells from each diseased tissue sample relative to stem-like cells in normal samples in each tissue plotted against the malignancy continuum. Samples are colored based on if they are from different disease stage. |
Top |
Malignant transformation related pathway analysis |
| Find out the enriched GO biological processes and KEGG pathways involved in transition from healthy to precancer to cancer |
| Tissue | Disease Stage | Enriched GO biological Processes |
| Colorectum | AD |  |
| Colorectum | SER |  |
| Colorectum | MSS |  |
| Colorectum | MSI-H |  |
| Colorectum | FAP |  |
| ∗Top 15 enriched GO BP terms are showed in the bar plot of each disease state in each tissue. Each row represents a significant GO biological process which is colored according to the -log10(p.adjust). |
| Page: 1 2 3 4 5 6 7 8 9 |
| GO ID | Tissue | Disease Stage | Description | Gene Ratio | Bg Ratio | pvalue | p.adjust | Count |
| GO:00066433 | Esophagus | ESCC | membrane lipid metabolic process | 130/8552 | 203/18723 | 9.29e-08 | 1.54e-06 | 130 |
| GO:00066652 | Esophagus | ESCC | sphingolipid metabolic process | 96/8552 | 155/18723 | 3.21e-05 | 2.66e-04 | 96 |
| GO:00066318 | Esophagus | ESCC | fatty acid metabolic process | 217/8552 | 390/18723 | 4.21e-05 | 3.39e-04 | 217 |
| GO:00463948 | Esophagus | ESCC | carboxylic acid biosynthetic process | 175/8552 | 314/18723 | 1.98e-04 | 1.26e-03 | 175 |
| GO:00160538 | Esophagus | ESCC | organic acid biosynthetic process | 175/8552 | 316/18723 | 3.04e-04 | 1.82e-03 | 175 |
| GO:000663112 | Liver | Cirrhotic | fatty acid metabolic process | 165/4634 | 390/18723 | 1.29e-14 | 1.26e-12 | 165 |
| GO:001605312 | Liver | Cirrhotic | organic acid biosynthetic process | 139/4634 | 316/18723 | 4.28e-14 | 3.83e-12 | 139 |
| GO:004639412 | Liver | Cirrhotic | carboxylic acid biosynthetic process | 137/4634 | 314/18723 | 1.40e-13 | 1.14e-11 | 137 |
| GO:007233011 | Liver | Cirrhotic | monocarboxylic acid biosynthetic process | 93/4634 | 214/18723 | 1.43e-09 | 6.16e-08 | 93 |
| GO:000663311 | Liver | Cirrhotic | fatty acid biosynthetic process | 70/4634 | 163/18723 | 2.57e-07 | 6.41e-06 | 70 |
| GO:0006643 | Liver | Cirrhotic | membrane lipid metabolic process | 69/4634 | 203/18723 | 1.89e-03 | 1.19e-02 | 69 |
| GO:003355911 | Liver | Cirrhotic | unsaturated fatty acid metabolic process | 43/4634 | 116/18723 | 2.09e-03 | 1.29e-02 | 43 |
| GO:001605321 | Liver | HCC | organic acid biosynthetic process | 200/7958 | 316/18723 | 5.24e-14 | 3.22e-12 | 200 |
| GO:000663122 | Liver | HCC | fatty acid metabolic process | 238/7958 | 390/18723 | 8.24e-14 | 4.84e-12 | 238 |
| GO:004639421 | Liver | HCC | carboxylic acid biosynthetic process | 198/7958 | 314/18723 | 1.19e-13 | 6.78e-12 | 198 |
| GO:007233021 | Liver | HCC | monocarboxylic acid biosynthetic process | 129/7958 | 214/18723 | 1.08e-07 | 2.09e-06 | 129 |
| GO:000663321 | Liver | HCC | fatty acid biosynthetic process | 96/7958 | 163/18723 | 1.71e-05 | 1.85e-04 | 96 |
| GO:00066431 | Liver | HCC | membrane lipid metabolic process | 115/7958 | 203/18723 | 3.17e-05 | 3.22e-04 | 115 |
| GO:0006665 | Liver | HCC | sphingolipid metabolic process | 85/7958 | 155/18723 | 1.27e-03 | 6.92e-03 | 85 |
| GO:00066432 | Oral cavity | OSCC | membrane lipid metabolic process | 111/7305 | 203/18723 | 4.02e-06 | 4.69e-05 | 111 |
| Page: 1 2 |
| Pathway ID | Tissue | Disease Stage | Description | Gene Ratio | Bg Ratio | pvalue | p.adjust | qvalue | Count |
| Page: 1 |
Top |
Cell-cell communication analysis |
| Identification of potential cell-cell interactions between two cell types and their ligand-receptor pairs for different disease states |
| Ligand | Receptor | LRpair | Pathway | Tissue | Disease Stage |
| Page: 1 |
Top |
Single-cell gene regulatory network inference analysis |
| Find out the significant the regulons (TFs) and the target genes of each regulon across cell types for different disease states |
| TF | Cell Type | Tissue | Disease Stage | Target Gene | RSS | Regulon Activity |
| ∗The dot plots of a searched regulon are shown for all cell subpopulations in each disease state of each tissue based on the regulon specific score inferred using pySCENIC and by calculating the average expression. |
| Page: 1 |
Top |
Somatic mutation of malignant transformation related genes |
| Annotation of somatic variants for genes involved in malignant transformation |
| Hugo Symbol | Variant Class | Variant Classification | dbSNP RS | HGVSc | HGVSp | HGVSp Short | SWISSPROT | BIOTYPE | SIFT | PolyPhen | Tumor Sample Barcode | Tissue | Histology | Sex | Age | Stage | Therapy Types | Drugs | Outcome |
| FADS3 | SNV | Missense_Mutation | c.1181N>C | p.Arg394Thr | p.R394T | Q9Y5Q0 | protein_coding | deleterious(0) | probably_damaging(0.995) | TCGA-A2-A0YK-01 | Breast | breast invasive carcinoma | Female | <65 | I/II | Chemotherapy | cytoxan | SD | |
| FADS3 | SNV | Missense_Mutation | novel | c.653N>A | p.Arg218His | p.R218H | Q9Y5Q0 | protein_coding | tolerated(0.15) | benign(0.381) | TCGA-2W-A8YY-01 | Cervix | cervical & endocervical cancer | Female | <65 | I/II | Chemotherapy | cisplatin | CR |
| FADS3 | SNV | Missense_Mutation | novel | c.1246N>A | p.Glu416Lys | p.E416K | Q9Y5Q0 | protein_coding | tolerated(0.38) | benign(0.069) | TCGA-VS-A9V3-01 | Cervix | cervical & endocervical cancer | Female | <65 | I/II | Chemotherapy | cisplatin | PD |
| FADS3 | SNV | Missense_Mutation | rs763877655 | c.1321N>A | p.Ala441Thr | p.A441T | Q9Y5Q0 | protein_coding | tolerated(0.05) | possibly_damaging(0.84) | TCGA-AA-3941-01 | Colorectum | colon adenocarcinoma | Female | >=65 | I/II | Unknown | Unknown | SD |
| FADS3 | SNV | Missense_Mutation | c.605N>C | p.Phe202Ser | p.F202S | Q9Y5Q0 | protein_coding | deleterious(0) | possibly_damaging(0.808) | TCGA-CK-5916-01 | Colorectum | colon adenocarcinoma | Female | >=65 | I/II | Unknown | Unknown | PD | |
| FADS3 | SNV | Missense_Mutation | c.1267N>A | p.Ala423Thr | p.A423T | Q9Y5Q0 | protein_coding | deleterious(0) | probably_damaging(0.985) | TCGA-CM-6162-01 | Colorectum | colon adenocarcinoma | Female | <65 | III/IV | Chemotherapy | oxaliplatin | SD | |
| FADS3 | SNV | Missense_Mutation | c.254N>A | p.Arg85His | p.R85H | Q9Y5Q0 | protein_coding | deleterious(0.03) | benign(0.381) | TCGA-D5-6924-01 | Colorectum | colon adenocarcinoma | Male | >=65 | I/II | Unknown | Unknown | SD | |
| FADS3 | SNV | Missense_Mutation | rs767888295 | c.607N>A | p.Val203Met | p.V203M | Q9Y5Q0 | protein_coding | deleterious(0.01) | probably_damaging(0.921) | TCGA-G4-6306-01 | Colorectum | colon adenocarcinoma | Male | >=65 | I/II | Unknown | Unknown | SD |
| FADS3 | SNV | Missense_Mutation | c.1099N>A | p.Val367Met | p.V367M | Q9Y5Q0 | protein_coding | deleterious(0) | probably_damaging(0.984) | TCGA-AG-A02N-01 | Colorectum | rectum adenocarcinoma | Male | >=65 | I/II | Chemotherapy | folinic | CR | |
| FADS3 | SNV | Missense_Mutation | novel | c.675N>T | p.Lys225Asn | p.K225N | Q9Y5Q0 | protein_coding | deleterious(0) | probably_damaging(0.999) | TCGA-A5-A1OF-01 | Endometrium | uterine corpus endometrioid carcinoma | Female | <65 | I/II | Unknown | Unknown | SD |
| Page: 1 2 3 4 |
Top |
Related drugs of malignant transformation related genes |
| Identification of chemicals and drugs interact with genes involved in malignant transfromation |
| (DGIdb 4.0) |
| Entrez ID | Symbol | Category | Interaction Types | Drug Claim Name | Drug Name | PMIDs |
| Page: 1 |

Copyright 2023-Present -The University of Texas Health Science Center at Houston |