
|
|||||
|
 | |
| |
| |
| |
| |
| |
|
Gene: FADS2 |
Gene summary for FADS2 |
| Gene information | Species | Human | Gene symbol | FADS2 | Gene ID | 9415 |
| Gene name | fatty acid desaturase 2 | |
| Gene Alias | D6D | |
| Cytomap | 11q12.2 | |
| Gene Type | protein-coding | GO ID | GO:0001676 | UniProtAcc | O95864 |
Top |
Malignant transformation analysis |
| Identification of the aberrant gene expression in precancerous and cancerous lesions by comparing the gene expression of stem-like cells in diseased tissues with normal stem cells |
| Entrez ID | Symbol | Replicates | Species | Organ | Tissue | Adj P-value | Log2FC | Malignancy |
| 9415 | FADS2 | GSM4909281 | Human | Breast | IDC | 5.76e-24 | 4.58e-01 | 0.21 |
| 9415 | FADS2 | GSM4909285 | Human | Breast | IDC | 1.17e-24 | 3.61e-01 | 0.21 |
| 9415 | FADS2 | GSM4909290 | Human | Breast | IDC | 2.48e-32 | 7.56e-01 | 0.2096 |
| 9415 | FADS2 | GSM4909293 | Human | Breast | IDC | 4.85e-02 | 1.08e-01 | 0.1581 |
| 9415 | FADS2 | GSM4909301 | Human | Breast | IDC | 6.35e-13 | 3.67e-01 | 0.1577 |
| 9415 | FADS2 | M2 | Human | Breast | IDC | 1.62e-02 | 4.68e-01 | 0.21 |
| 9415 | FADS2 | P2 | Human | Breast | IDC | 3.24e-09 | 5.78e-01 | 0.21 |
| 9415 | FADS2 | LZE2T | Human | Esophagus | ESCC | 1.47e-14 | 1.42e+00 | 0.082 |
| 9415 | FADS2 | LZE4T | Human | Esophagus | ESCC | 3.33e-14 | 4.41e-01 | 0.0811 |
| 9415 | FADS2 | LZE7T | Human | Esophagus | ESCC | 2.56e-05 | 3.18e-01 | 0.0667 |
| 9415 | FADS2 | LZE22T | Human | Esophagus | ESCC | 1.57e-03 | 4.66e-01 | 0.068 |
| 9415 | FADS2 | P2T-E | Human | Esophagus | ESCC | 2.27e-21 | 4.34e-01 | 0.1177 |
| 9415 | FADS2 | P4T-E | Human | Esophagus | ESCC | 2.98e-27 | 6.20e-01 | 0.1323 |
| 9415 | FADS2 | P5T-E | Human | Esophagus | ESCC | 5.00e-17 | 3.68e-01 | 0.1327 |
| 9415 | FADS2 | P9T-E | Human | Esophagus | ESCC | 3.82e-08 | 2.66e-01 | 0.1131 |
| 9415 | FADS2 | P10T-E | Human | Esophagus | ESCC | 5.57e-40 | 7.65e-01 | 0.116 |
| 9415 | FADS2 | P11T-E | Human | Esophagus | ESCC | 1.72e-04 | 2.80e-01 | 0.1426 |
| 9415 | FADS2 | P12T-E | Human | Esophagus | ESCC | 2.86e-20 | 3.43e-01 | 0.1122 |
| 9415 | FADS2 | P15T-E | Human | Esophagus | ESCC | 3.38e-04 | 1.46e-01 | 0.1149 |
| 9415 | FADS2 | P16T-E | Human | Esophagus | ESCC | 2.39e-24 | 5.46e-01 | 0.1153 |
| Page: 1 2 3 4 |
| Tissue | Expression Dynamics | Abbreviation |
| Breast | 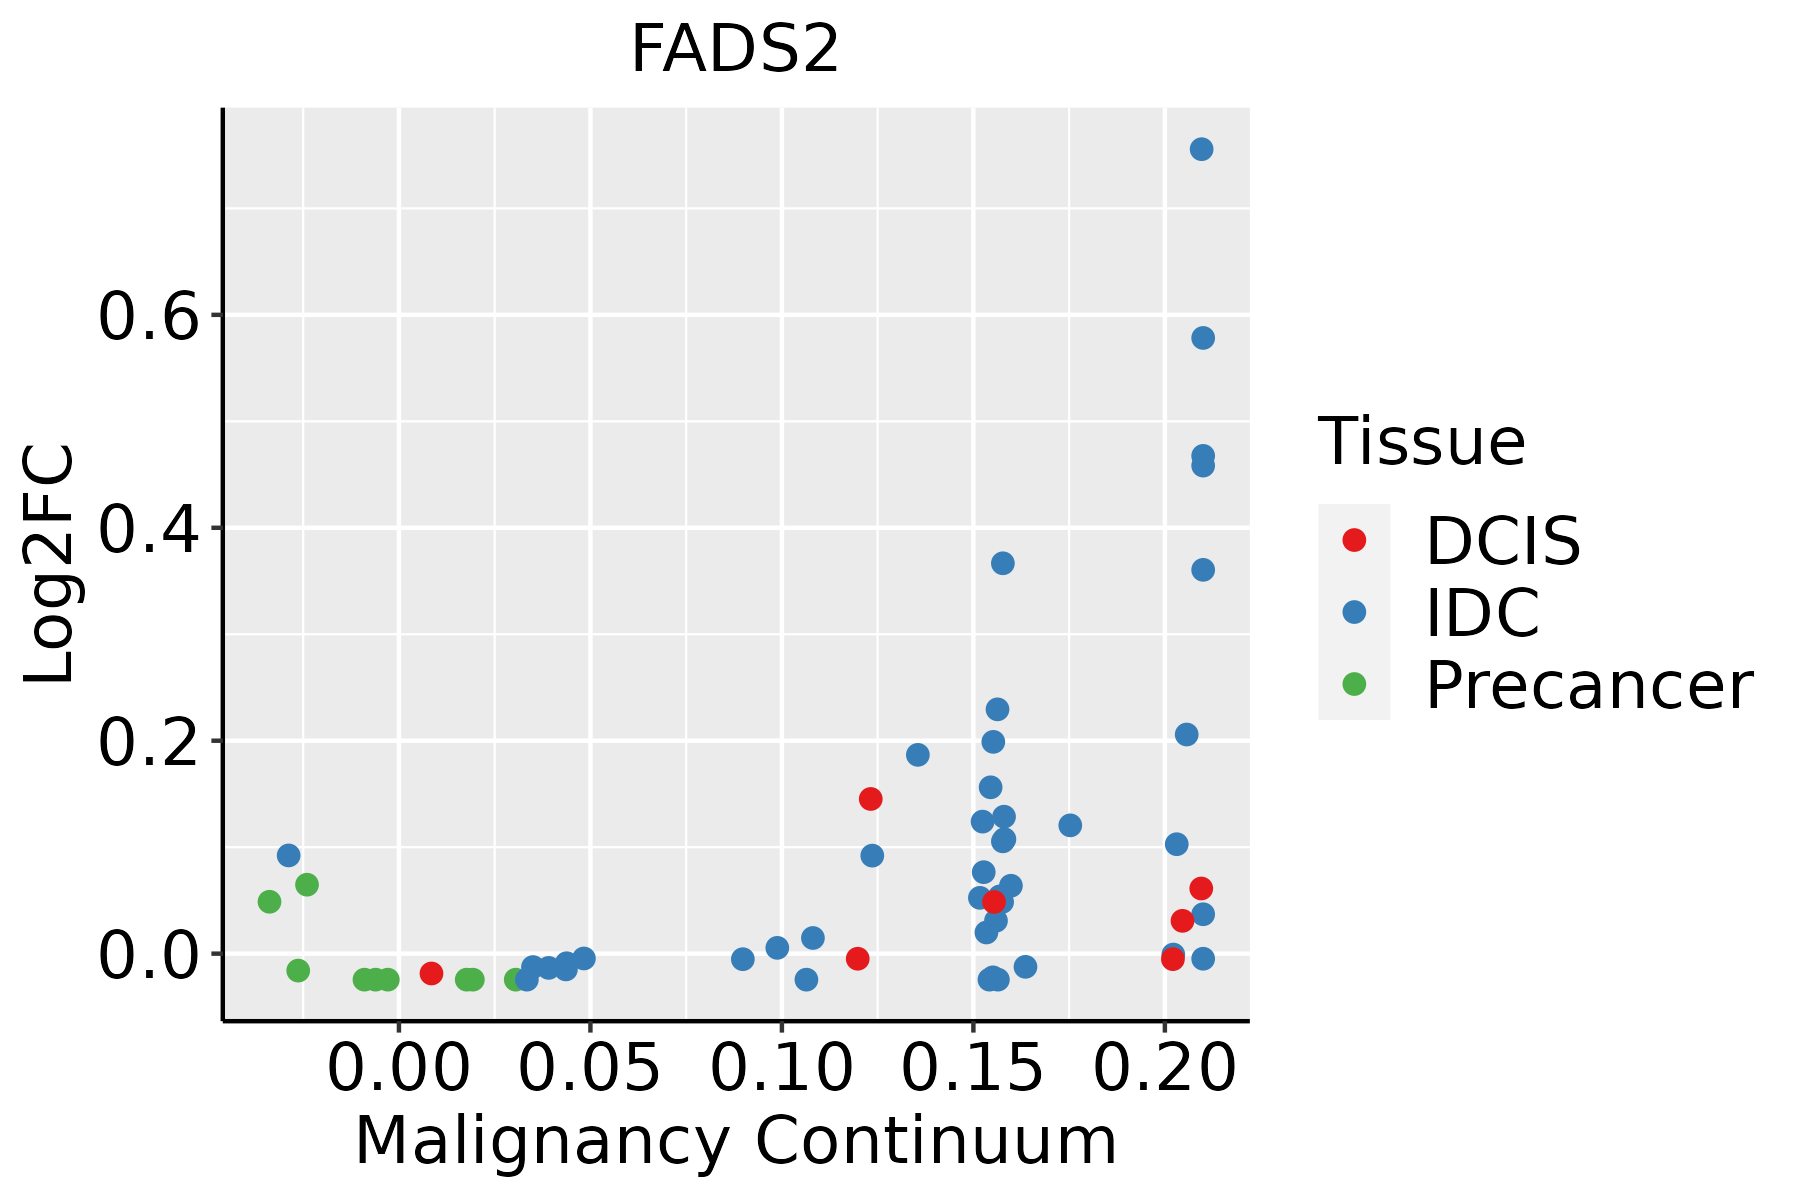 | IDC: Invasive ductal carcinoma |
| DCIS: Ductal carcinoma in situ | ||
| Precancer(BRCA1-mut): Precancerous lesion from BRCA1 mutation carriers | ||
| Esophagus |  | ESCC: Esophageal squamous cell carcinoma |
| HGIN: High-grade intraepithelial neoplasias | ||
| LGIN: Low-grade intraepithelial neoplasias | ||
| Liver | 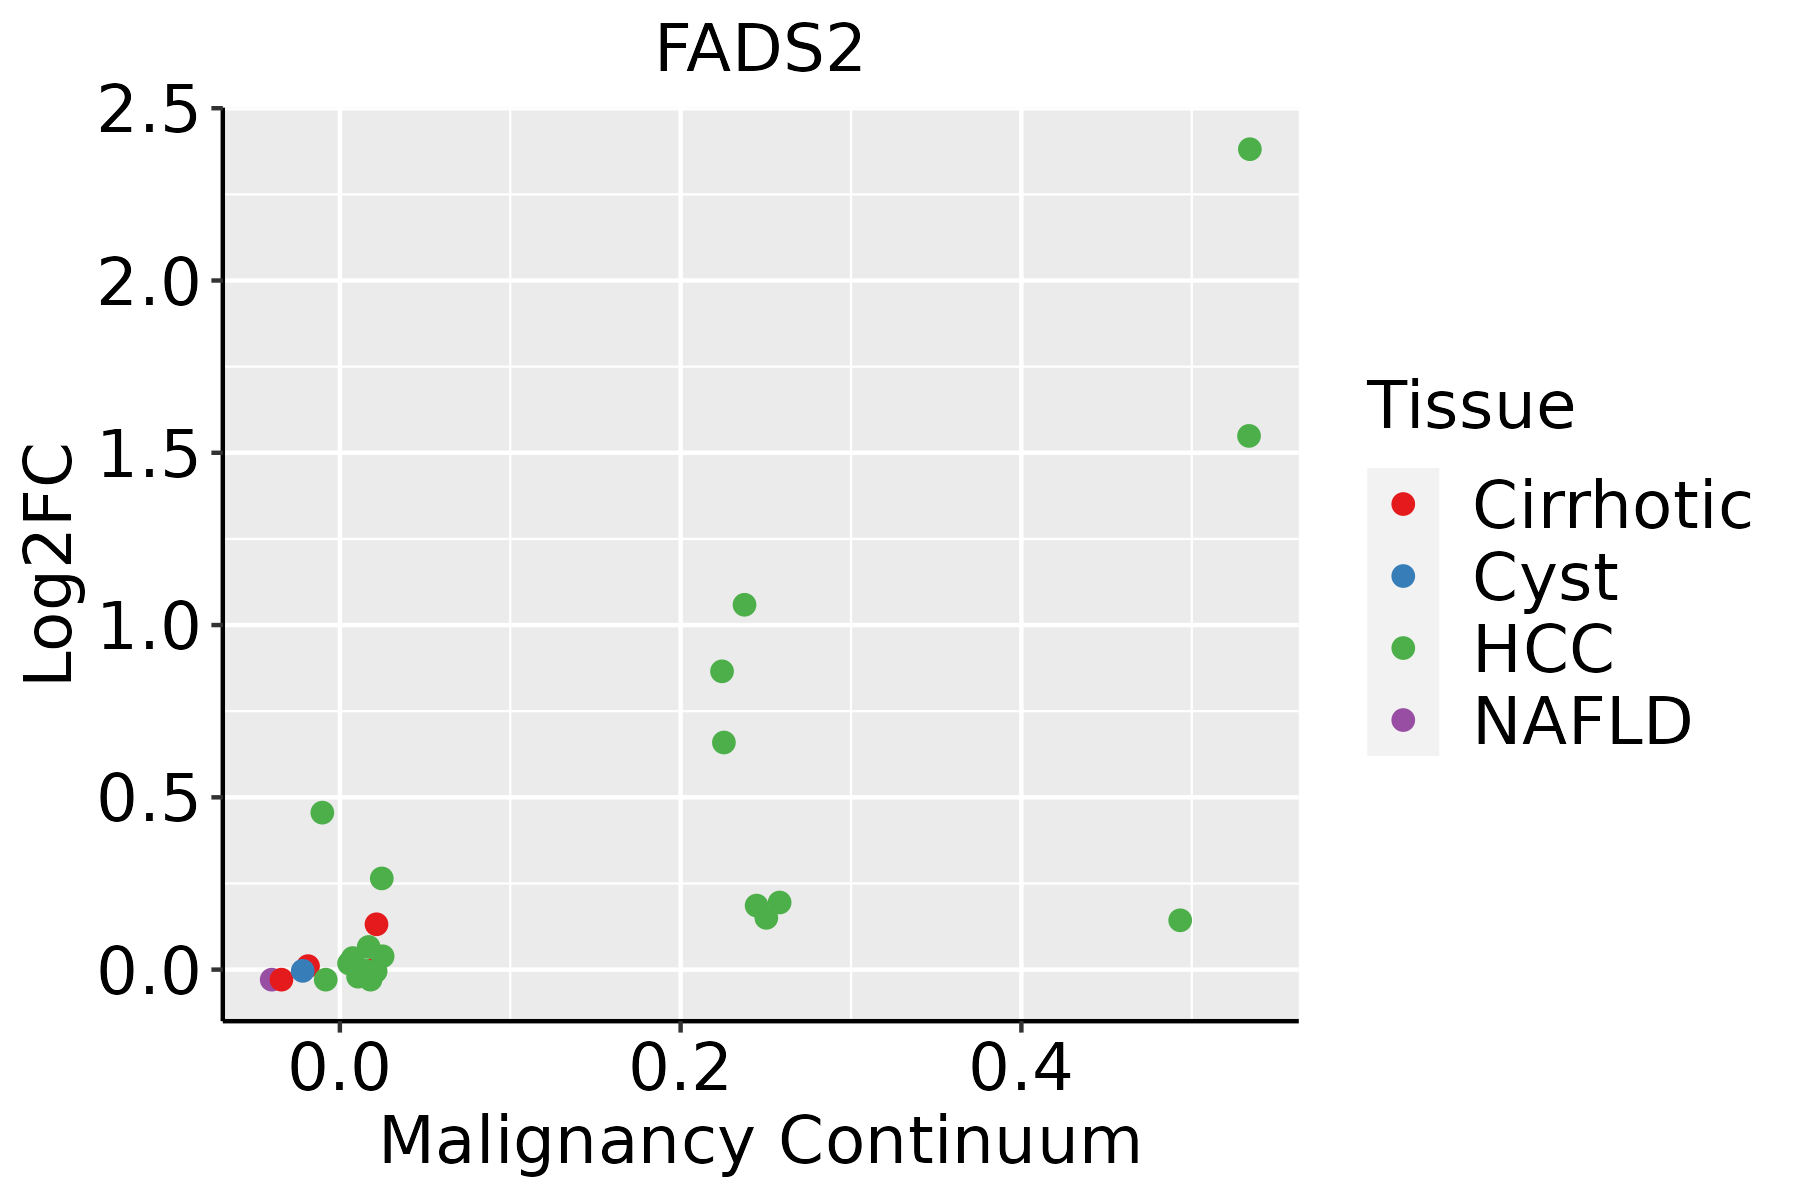 | HCC: Hepatocellular carcinoma |
| NAFLD: Non-alcoholic fatty liver disease | ||
| Oral Cavity | 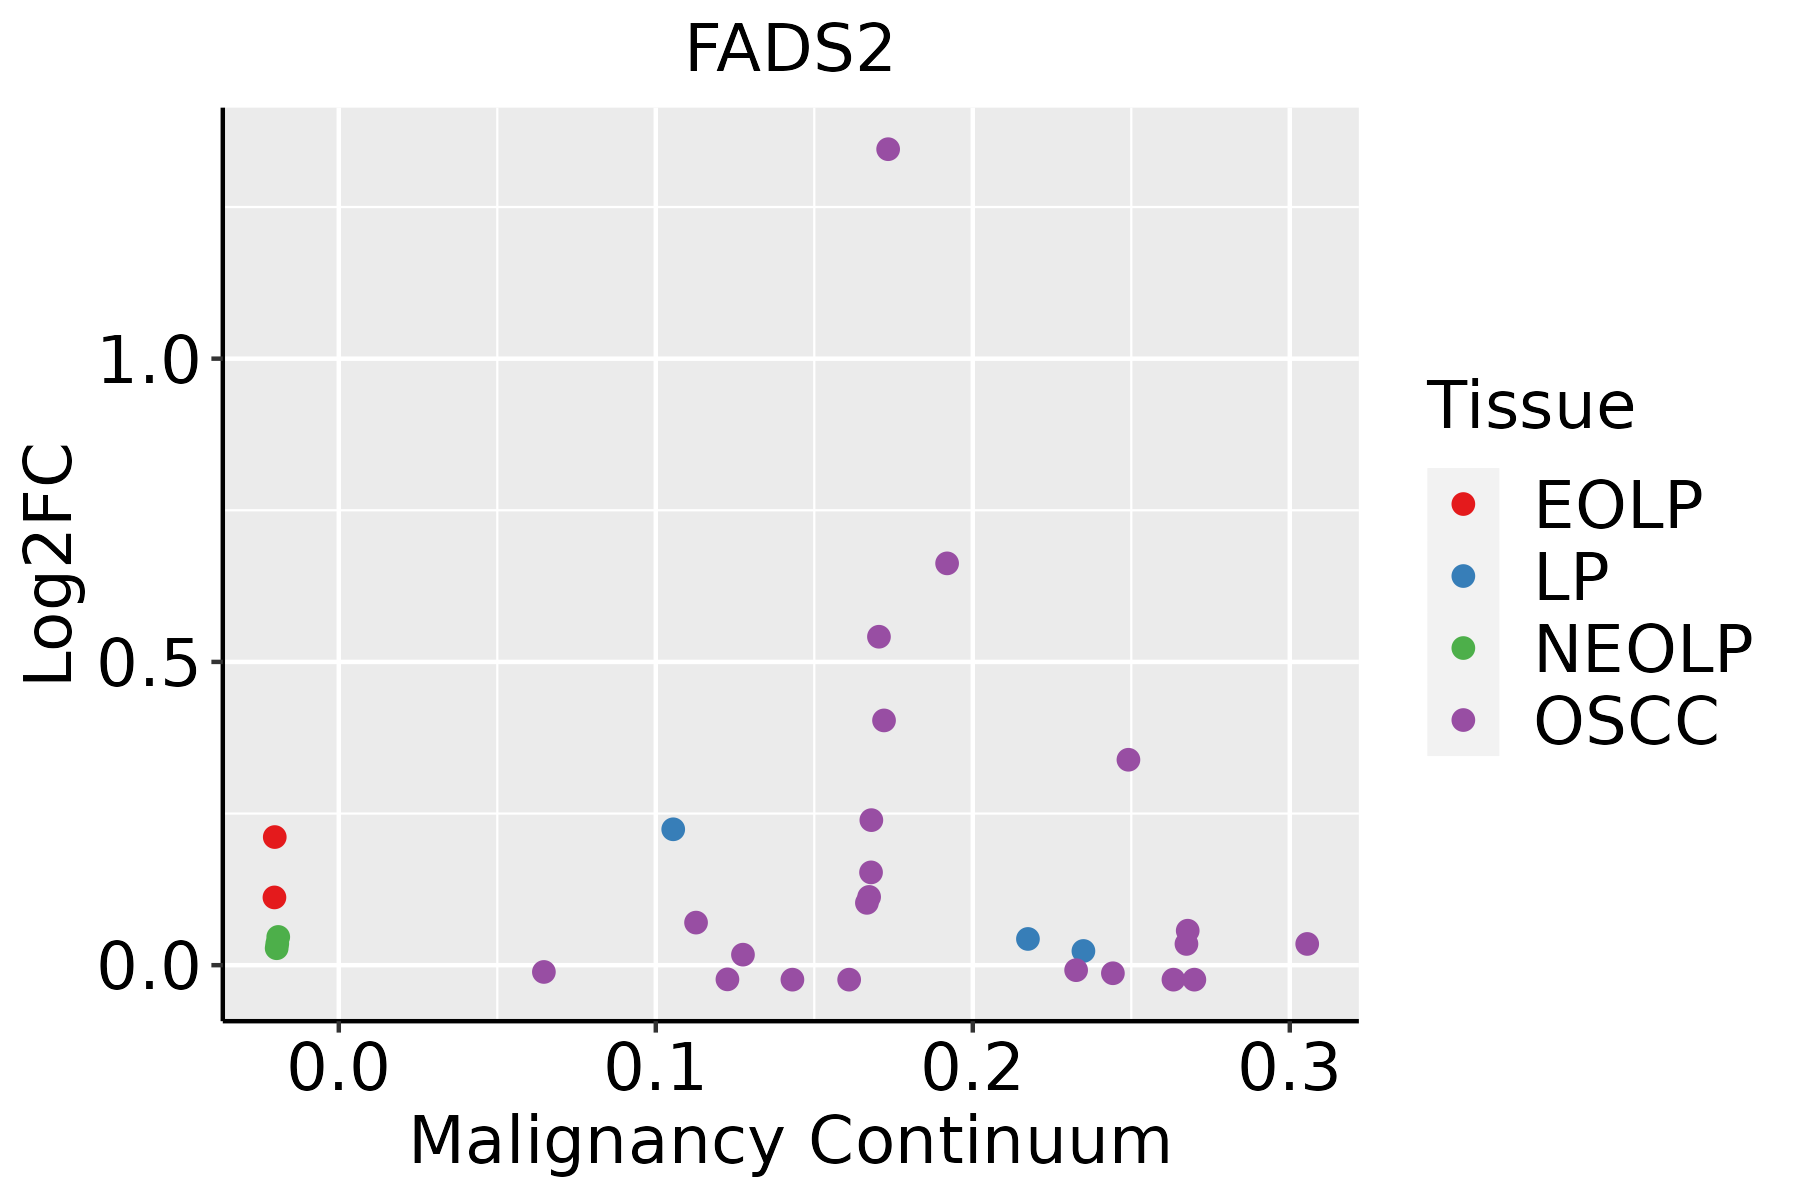 | EOLP: Erosive Oral lichen planus |
| LP: leukoplakia | ||
| NEOLP: Non-erosive oral lichen planus | ||
| OSCC: Oral squamous cell carcinoma | ||
| Prostate | 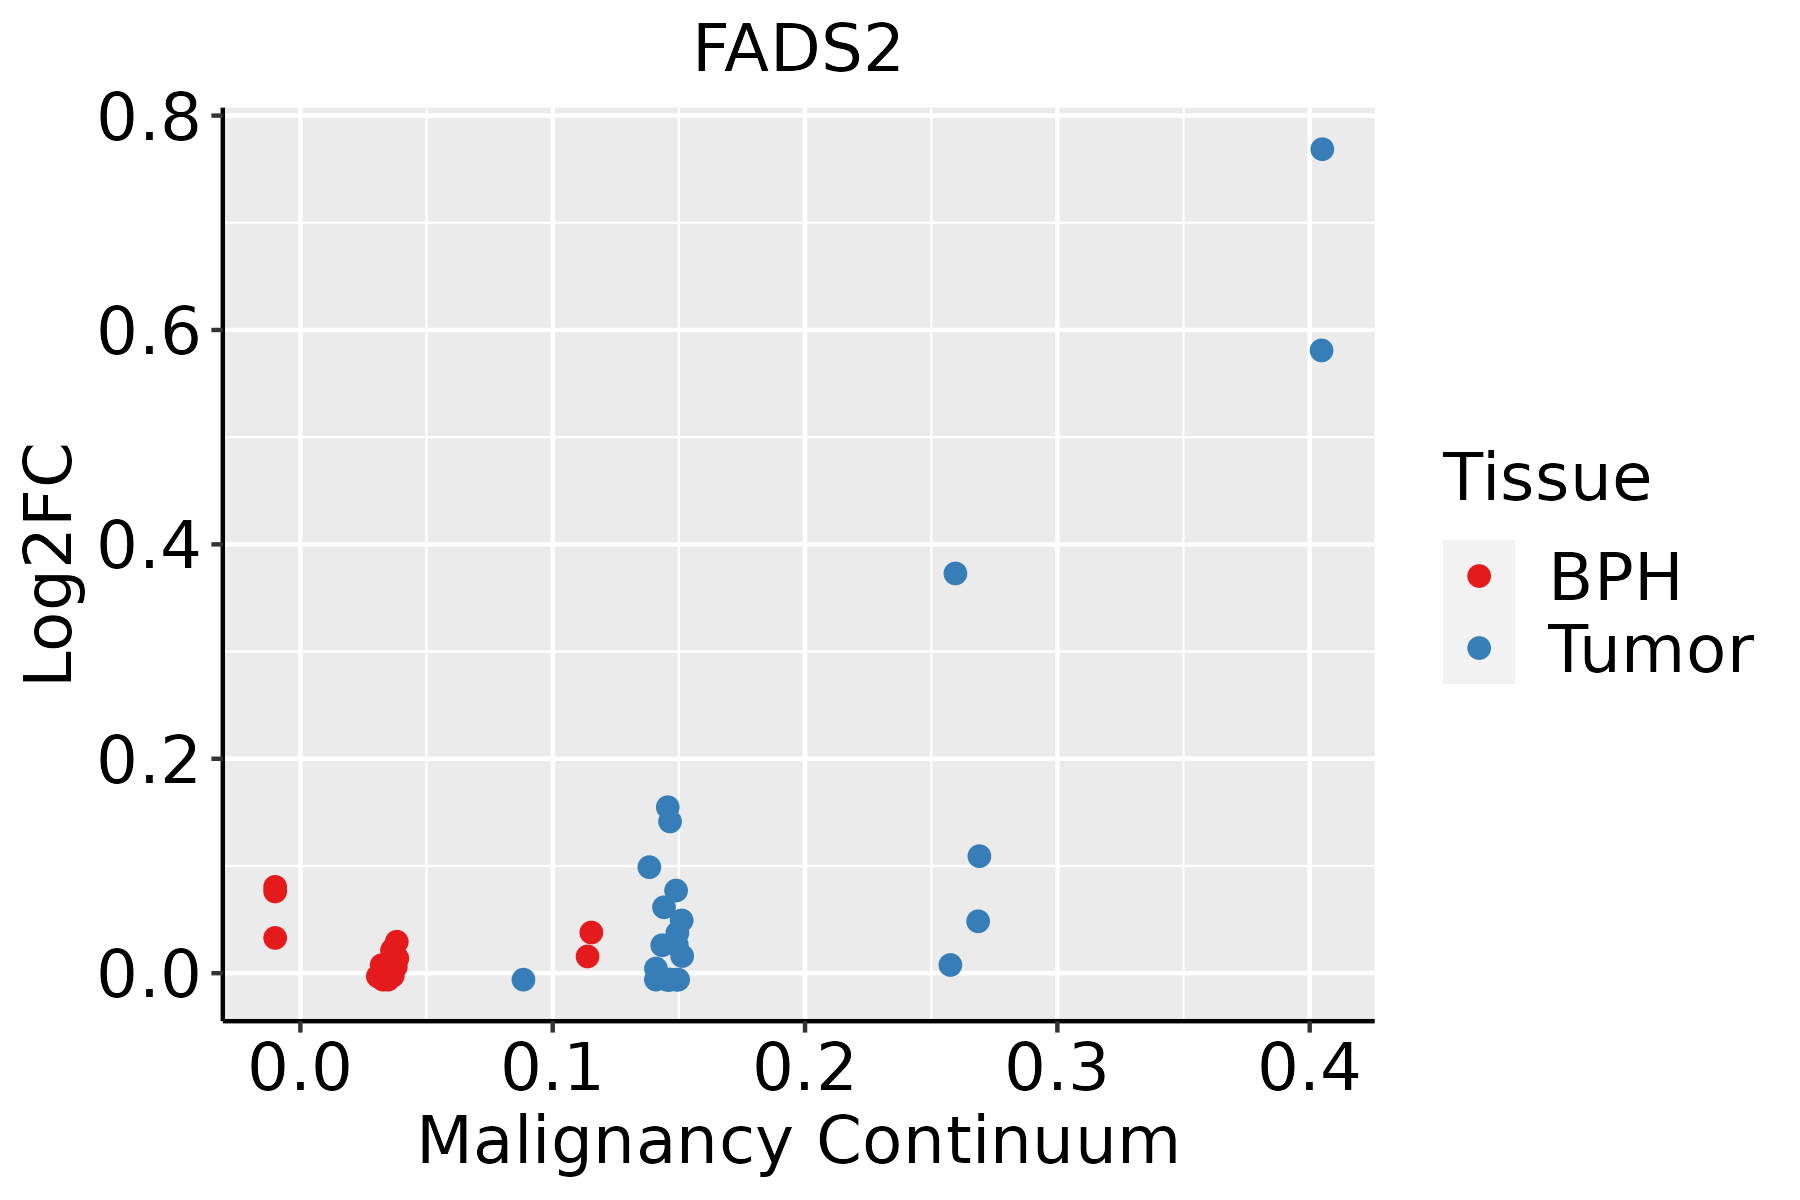 | BPH: Benign Prostatic Hyperplasia |
| Thyroid |  | ATC: Anaplastic thyroid cancer |
| HT: Hashimoto's thyroiditis | ||
| PTC: Papillary thyroid cancer |
| ∗log2FC in expression of this searched gene in stem-like cells from each diseased tissue sample relative to stem-like cells in normal samples in each tissue plotted against the malignancy continuum. Samples are colored based on if they are from different disease stage. |
Top |
Malignant transformation related pathway analysis |
| Find out the enriched GO biological processes and KEGG pathways involved in transition from healthy to precancer to cancer |
| Tissue | Disease Stage | Enriched GO biological Processes |
| Colorectum | AD |  |
| Colorectum | SER |  |
| Colorectum | MSS |  |
| Colorectum | MSI-H |  |
| Colorectum | FAP |  |
| ∗Top 15 enriched GO BP terms are showed in the bar plot of each disease state in each tissue. Each row represents a significant GO biological process which is colored according to the -log10(p.adjust). |
| Page: 1 2 3 4 5 6 7 8 9 |
| GO ID | Tissue | Disease Stage | Description | Gene Ratio | Bg Ratio | pvalue | p.adjust | Count |
| GO:007233012 | Breast | IDC | monocarboxylic acid biosynthetic process | 29/1434 | 214/18723 | 1.91e-03 | 1.83e-02 | 29 |
| GO:001605313 | Breast | IDC | organic acid biosynthetic process | 39/1434 | 316/18723 | 2.13e-03 | 1.99e-02 | 39 |
| GO:000663312 | Breast | IDC | fatty acid biosynthetic process | 23/1434 | 163/18723 | 3.21e-03 | 2.70e-02 | 23 |
| GO:004639413 | Breast | IDC | carboxylic acid biosynthetic process | 38/1434 | 314/18723 | 3.39e-03 | 2.83e-02 | 38 |
| GO:00066318 | Esophagus | ESCC | fatty acid metabolic process | 217/8552 | 390/18723 | 4.21e-05 | 3.39e-04 | 217 |
| GO:00463948 | Esophagus | ESCC | carboxylic acid biosynthetic process | 175/8552 | 314/18723 | 1.98e-04 | 1.26e-03 | 175 |
| GO:00160538 | Esophagus | ESCC | organic acid biosynthetic process | 175/8552 | 316/18723 | 3.04e-04 | 1.82e-03 | 175 |
| GO:001605321 | Liver | HCC | organic acid biosynthetic process | 200/7958 | 316/18723 | 5.24e-14 | 3.22e-12 | 200 |
| GO:000663122 | Liver | HCC | fatty acid metabolic process | 238/7958 | 390/18723 | 8.24e-14 | 4.84e-12 | 238 |
| GO:004639421 | Liver | HCC | carboxylic acid biosynthetic process | 198/7958 | 314/18723 | 1.19e-13 | 6.78e-12 | 198 |
| GO:007233021 | Liver | HCC | monocarboxylic acid biosynthetic process | 129/7958 | 214/18723 | 1.08e-07 | 2.09e-06 | 129 |
| GO:000663321 | Liver | HCC | fatty acid biosynthetic process | 96/7958 | 163/18723 | 1.71e-05 | 1.85e-04 | 96 |
| GO:0036109 | Liver | HCC | alpha-linolenic acid metabolic process | 9/7958 | 10/18723 | 2.79e-03 | 1.31e-02 | 9 |
| GO:000167621 | Liver | HCC | long-chain fatty acid metabolic process | 60/7958 | 112/18723 | 1.17e-02 | 4.28e-02 | 60 |
| GO:00160537 | Oral cavity | OSCC | organic acid biosynthetic process | 155/7305 | 316/18723 | 1.64e-04 | 1.13e-03 | 155 |
| GO:00463947 | Oral cavity | OSCC | carboxylic acid biosynthetic process | 154/7305 | 314/18723 | 1.73e-04 | 1.19e-03 | 154 |
| GO:00066317 | Oral cavity | OSCC | fatty acid metabolic process | 186/7305 | 390/18723 | 2.65e-04 | 1.69e-03 | 186 |
| GO:00066363 | Oral cavity | OSCC | unsaturated fatty acid biosynthetic process | 28/7305 | 51/18723 | 1.54e-02 | 4.99e-02 | 28 |
| GO:000663611 | Oral cavity | EOLP | unsaturated fatty acid biosynthetic process | 13/2218 | 51/18723 | 5.43e-03 | 2.82e-02 | 13 |
| Page: 1 |
| Pathway ID | Tissue | Disease Stage | Description | Gene Ratio | Bg Ratio | pvalue | p.adjust | qvalue | Count |
| hsa012129 | Esophagus | ESCC | Fatty acid metabolism | 41/4205 | 57/8465 | 5.13e-04 | 1.75e-03 | 8.98e-04 | 41 |
| hsa0121214 | Esophagus | ESCC | Fatty acid metabolism | 41/4205 | 57/8465 | 5.13e-04 | 1.75e-03 | 8.98e-04 | 41 |
| hsa012124 | Liver | HCC | Fatty acid metabolism | 45/4020 | 57/8465 | 1.05e-06 | 1.10e-05 | 6.09e-06 | 45 |
| hsa033204 | Liver | HCC | PPAR signaling pathway | 48/4020 | 75/8465 | 2.83e-03 | 9.37e-03 | 5.21e-03 | 48 |
| hsa010402 | Liver | HCC | Biosynthesis of unsaturated fatty acids | 19/4020 | 27/8465 | 1.37e-02 | 3.33e-02 | 1.85e-02 | 19 |
| hsa012125 | Liver | HCC | Fatty acid metabolism | 45/4020 | 57/8465 | 1.05e-06 | 1.10e-05 | 6.09e-06 | 45 |
| hsa033205 | Liver | HCC | PPAR signaling pathway | 48/4020 | 75/8465 | 2.83e-03 | 9.37e-03 | 5.21e-03 | 48 |
| hsa010403 | Liver | HCC | Biosynthesis of unsaturated fatty acids | 19/4020 | 27/8465 | 1.37e-02 | 3.33e-02 | 1.85e-02 | 19 |
| hsa0121221 | Prostate | Tumor | Fatty acid metabolism | 23/1791 | 57/8465 | 7.60e-04 | 3.59e-03 | 2.23e-03 | 23 |
| hsa010404 | Prostate | Tumor | Biosynthesis of unsaturated fatty acids | 12/1791 | 27/8465 | 5.53e-03 | 1.93e-02 | 1.19e-02 | 12 |
| hsa0121231 | Prostate | Tumor | Fatty acid metabolism | 23/1791 | 57/8465 | 7.60e-04 | 3.59e-03 | 2.23e-03 | 23 |
| hsa0104011 | Prostate | Tumor | Biosynthesis of unsaturated fatty acids | 12/1791 | 27/8465 | 5.53e-03 | 1.93e-02 | 1.19e-02 | 12 |
| Page: 1 |
Top |
Cell-cell communication analysis |
| Identification of potential cell-cell interactions between two cell types and their ligand-receptor pairs for different disease states |
| Ligand | Receptor | LRpair | Pathway | Tissue | Disease Stage |
| Page: 1 |
Top |
Single-cell gene regulatory network inference analysis |
| Find out the significant the regulons (TFs) and the target genes of each regulon across cell types for different disease states |
| TF | Cell Type | Tissue | Disease Stage | Target Gene | RSS | Regulon Activity |
| ∗The dot plots of a searched regulon are shown for all cell subpopulations in each disease state of each tissue based on the regulon specific score inferred using pySCENIC and by calculating the average expression. |
| Page: 1 |
Top |
Somatic mutation of malignant transformation related genes |
| Annotation of somatic variants for genes involved in malignant transformation |
| Hugo Symbol | Variant Class | Variant Classification | dbSNP RS | HGVSc | HGVSp | HGVSp Short | SWISSPROT | BIOTYPE | SIFT | PolyPhen | Tumor Sample Barcode | Tissue | Histology | Sex | Age | Stage | Therapy Types | Drugs | Outcome |
| FADS2 | SNV | Missense_Mutation | c.415N>T | p.His139Tyr | p.H139Y | O95864 | protein_coding | deleterious(0.01) | possibly_damaging(0.461) | TCGA-B6-A0I5-01 | Breast | breast invasive carcinoma | Female | <65 | I/II | Unknown | Unknown | SD | |
| FADS2 | SNV | Missense_Mutation | rs750796701 | c.400N>T | p.Leu134Phe | p.L134F | O95864 | protein_coding | tolerated(1) | benign(0) | TCGA-BH-A0HF-01 | Breast | breast invasive carcinoma | Female | >=65 | I/II | Hormone Therapy | arimidex | SD |
| FADS2 | SNV | Missense_Mutation | c.1113C>G | p.Phe371Leu | p.F371L | O95864 | protein_coding | deleterious(0.02) | benign(0.174) | TCGA-BH-A18T-01 | Breast | breast invasive carcinoma | Female | >=65 | I/II | Unknown | Unknown | PD | |
| FADS2 | SNV | Missense_Mutation | c.1033N>G | p.Met345Val | p.M345V | O95864 | protein_coding | deleterious(0) | possibly_damaging(0.542) | TCGA-D8-A1XQ-01 | Breast | breast invasive carcinoma | Female | >=65 | I/II | Unknown | Unknown | SD | |
| FADS2 | SNV | Missense_Mutation | c.873N>C | p.Lys291Asn | p.K291N | O95864 | protein_coding | deleterious(0.01) | benign(0.197) | TCGA-E2-A14W-01 | Breast | breast invasive carcinoma | Male | >=65 | I/II | Chemotherapy | cytoxan | SD | |
| FADS2 | SNV | Missense_Mutation | c.975N>A | p.Phe325Leu | p.F325L | O95864 | protein_coding | tolerated(0.83) | benign(0.021) | TCGA-GM-A2DH-01 | Breast | breast invasive carcinoma | Female | <65 | I/II | Chemotherapy | taxol | CR | |
| FADS2 | insertion | Nonsense_Mutation | novel | c.316_317insGTATTCGGTCTTGTCCTTTTCATTGACCACCCTGGAC | p.Asn106SerfsTer9 | p.N106Sfs*9 | O95864 | protein_coding | TCGA-A2-A0D1-01 | Breast | breast invasive carcinoma | Female | >=65 | I/II | Chemotherapy | taxotere | SD | ||
| FADS2 | SNV | Missense_Mutation | rs777219575 | c.424N>A | p.Ala142Thr | p.A142T | O95864 | protein_coding | deleterious(0.04) | benign(0.102) | TCGA-2W-A8YY-01 | Cervix | cervical & endocervical cancer | Female | <65 | I/II | Chemotherapy | cisplatin | CR |
| FADS2 | SNV | Missense_Mutation | novel | c.416A>T | p.His139Leu | p.H139L | O95864 | protein_coding | deleterious(0) | possibly_damaging(0.461) | TCGA-AA-3870-01 | Colorectum | colon adenocarcinoma | Female | >=65 | III/IV | Chemotherapy | folinic | CR |
| FADS2 | SNV | Missense_Mutation | c.694G>A | p.Asp232Asn | p.D232N | O95864 | protein_coding | deleterious(0.01) | probably_damaging(1) | TCGA-AA-A00O-01 | Colorectum | colon adenocarcinoma | Female | >=65 | III/IV | Unknown | Unknown | SD |
| Page: 1 2 3 4 |
Top |
Related drugs of malignant transformation related genes |
| Identification of chemicals and drugs interact with genes involved in malignant transfromation |
| (DGIdb 4.0) |
| Entrez ID | Symbol | Category | Interaction Types | Drug Claim Name | Drug Name | PMIDs |
| Page: 1 |

Copyright 2023-Present -The University of Texas Health Science Center at Houston |