
|
|||||
|
 | |
| |
| |
| |
| |
| |
|
Gene: FADS1 |
Gene summary for FADS1 |
| Gene information | Species | Human | Gene symbol | FADS1 | Gene ID | 3992 |
| Gene name | fatty acid desaturase 1 | |
| Gene Alias | D5D | |
| Cytomap | 11q12.2 | |
| Gene Type | protein-coding | GO ID | GO:0001676 | UniProtAcc | A0A0A0MR51 |
Top |
Malignant transformation analysis |
| Identification of the aberrant gene expression in precancerous and cancerous lesions by comparing the gene expression of stem-like cells in diseased tissues with normal stem cells |
| Entrez ID | Symbol | Replicates | Species | Organ | Tissue | Adj P-value | Log2FC | Malignancy |
| 3992 | FADS1 | LZE2T | Human | Esophagus | ESCC | 6.80e-08 | 1.27e+00 | 0.082 |
| 3992 | FADS1 | LZE4T | Human | Esophagus | ESCC | 8.09e-09 | 3.91e-01 | 0.0811 |
| 3992 | FADS1 | LZE7T | Human | Esophagus | ESCC | 2.42e-06 | 5.85e-01 | 0.0667 |
| 3992 | FADS1 | LZE24T | Human | Esophagus | ESCC | 2.62e-10 | 3.29e-01 | 0.0596 |
| 3992 | FADS1 | P2T-E | Human | Esophagus | ESCC | 9.86e-34 | 5.50e-01 | 0.1177 |
| 3992 | FADS1 | P4T-E | Human | Esophagus | ESCC | 2.92e-49 | 1.13e+00 | 0.1323 |
| 3992 | FADS1 | P5T-E | Human | Esophagus | ESCC | 5.22e-43 | 9.18e-01 | 0.1327 |
| 3992 | FADS1 | P8T-E | Human | Esophagus | ESCC | 4.17e-05 | 1.13e-01 | 0.0889 |
| 3992 | FADS1 | P9T-E | Human | Esophagus | ESCC | 1.53e-10 | 3.25e-01 | 0.1131 |
| 3992 | FADS1 | P10T-E | Human | Esophagus | ESCC | 2.65e-49 | 9.57e-01 | 0.116 |
| 3992 | FADS1 | P11T-E | Human | Esophagus | ESCC | 6.77e-15 | 6.99e-01 | 0.1426 |
| 3992 | FADS1 | P12T-E | Human | Esophagus | ESCC | 1.00e-24 | 4.91e-01 | 0.1122 |
| 3992 | FADS1 | P15T-E | Human | Esophagus | ESCC | 9.03e-08 | 1.96e-01 | 0.1149 |
| 3992 | FADS1 | P16T-E | Human | Esophagus | ESCC | 3.03e-18 | 4.68e-01 | 0.1153 |
| 3992 | FADS1 | P19T-E | Human | Esophagus | ESCC | 5.31e-14 | 1.09e+00 | 0.1662 |
| 3992 | FADS1 | P21T-E | Human | Esophagus | ESCC | 4.48e-05 | 1.95e-01 | 0.1617 |
| 3992 | FADS1 | P22T-E | Human | Esophagus | ESCC | 9.44e-07 | 1.62e-01 | 0.1236 |
| 3992 | FADS1 | P23T-E | Human | Esophagus | ESCC | 4.63e-06 | 4.61e-01 | 0.108 |
| 3992 | FADS1 | P24T-E | Human | Esophagus | ESCC | 2.93e-15 | 3.85e-01 | 0.1287 |
| 3992 | FADS1 | P26T-E | Human | Esophagus | ESCC | 1.61e-32 | 6.44e-01 | 0.1276 |
| Page: 1 2 3 4 |
| Tissue | Expression Dynamics | Abbreviation |
| Esophagus | 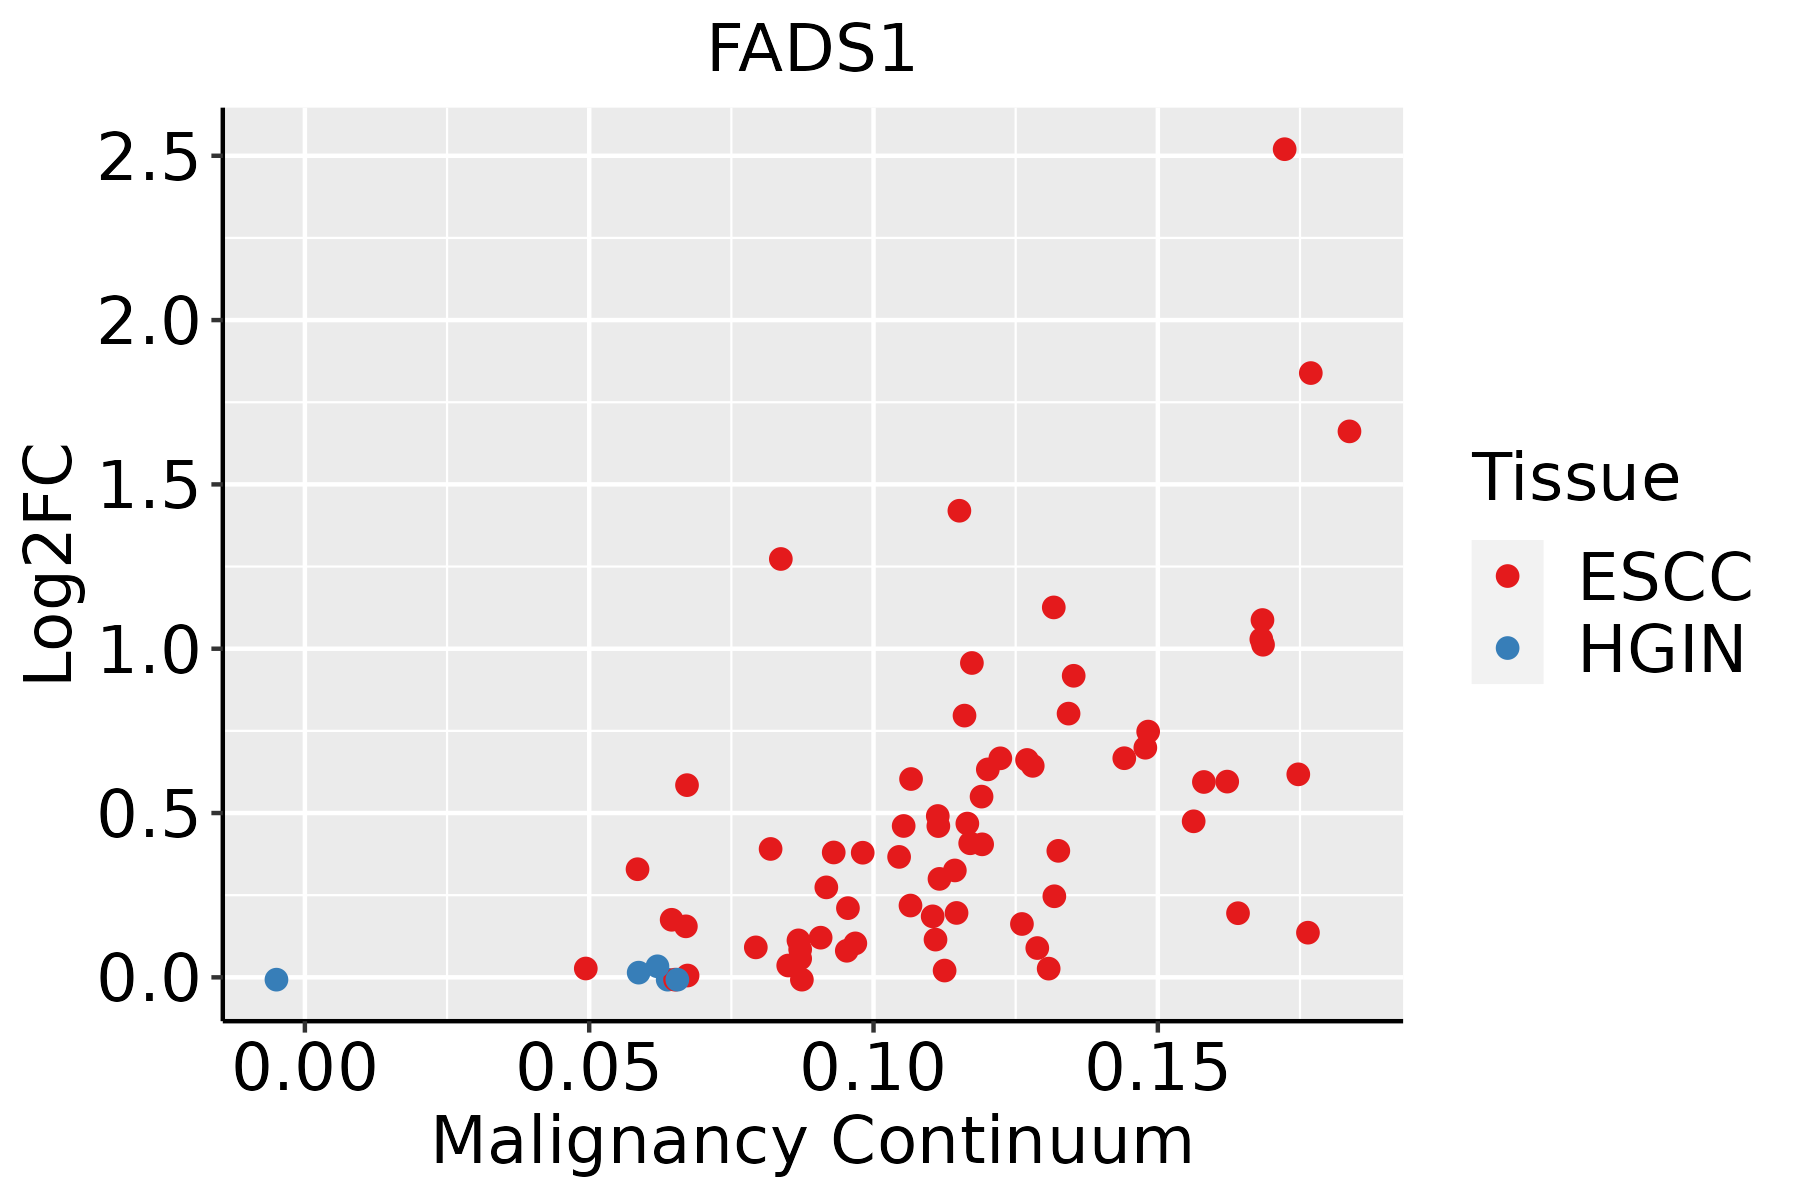 | ESCC: Esophageal squamous cell carcinoma |
| HGIN: High-grade intraepithelial neoplasias | ||
| LGIN: Low-grade intraepithelial neoplasias | ||
| Liver |  | HCC: Hepatocellular carcinoma |
| NAFLD: Non-alcoholic fatty liver disease | ||
| Oral Cavity | 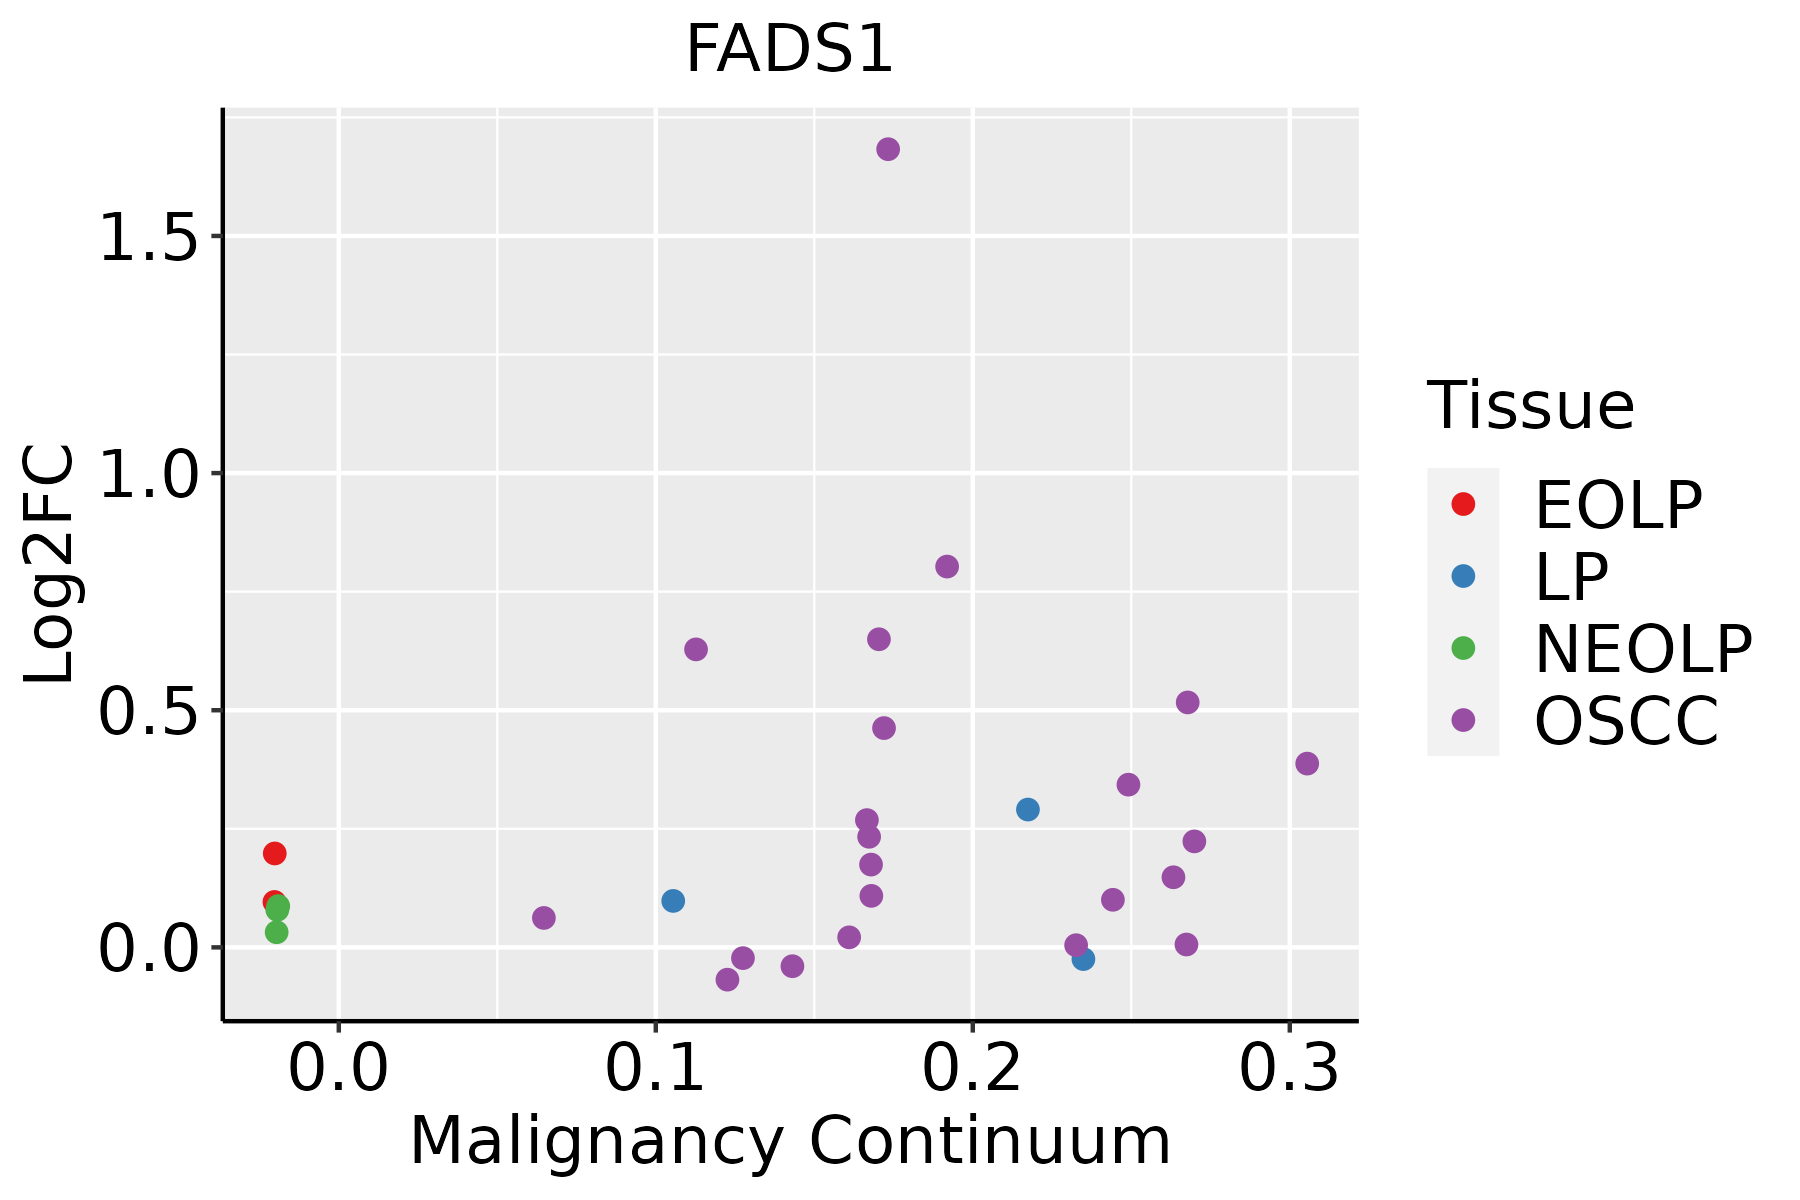 | EOLP: Erosive Oral lichen planus |
| LP: leukoplakia | ||
| NEOLP: Non-erosive oral lichen planus | ||
| OSCC: Oral squamous cell carcinoma | ||
| Thyroid |  | ATC: Anaplastic thyroid cancer |
| HT: Hashimoto's thyroiditis | ||
| PTC: Papillary thyroid cancer |
| ∗log2FC in expression of this searched gene in stem-like cells from each diseased tissue sample relative to stem-like cells in normal samples in each tissue plotted against the malignancy continuum. Samples are colored based on if they are from different disease stage. |
Top |
Malignant transformation related pathway analysis |
| Find out the enriched GO biological processes and KEGG pathways involved in transition from healthy to precancer to cancer |
| Tissue | Disease Stage | Enriched GO biological Processes |
| Colorectum | AD |  |
| Colorectum | SER |  |
| Colorectum | MSS |  |
| Colorectum | MSI-H |  |
| Colorectum | FAP |  |
| ∗Top 15 enriched GO BP terms are showed in the bar plot of each disease state in each tissue. Each row represents a significant GO biological process which is colored according to the -log10(p.adjust). |
| Page: 1 2 3 4 5 6 7 8 9 |
| GO ID | Tissue | Disease Stage | Description | Gene Ratio | Bg Ratio | pvalue | p.adjust | Count |
| GO:0071496111 | Esophagus | ESCC | cellular response to external stimulus | 215/8552 | 320/18723 | 4.29e-15 | 2.43e-13 | 215 |
| GO:0031668111 | Esophagus | ESCC | cellular response to extracellular stimulus | 168/8552 | 246/18723 | 4.93e-13 | 2.23e-11 | 168 |
| GO:0031669110 | Esophagus | ESCC | cellular response to nutrient levels | 148/8552 | 215/18723 | 4.58e-12 | 1.76e-10 | 148 |
| GO:0031667111 | Esophagus | ESCC | response to nutrient levels | 289/8552 | 474/18723 | 9.25e-12 | 3.47e-10 | 289 |
| GO:0009267110 | Esophagus | ESCC | cellular response to starvation | 110/8552 | 156/18723 | 2.63e-10 | 7.37e-09 | 110 |
| GO:004259419 | Esophagus | ESCC | response to starvation | 133/8552 | 197/18723 | 4.31e-10 | 1.14e-08 | 133 |
| GO:00086544 | Esophagus | ESCC | phospholipid biosynthetic process | 162/8552 | 253/18723 | 2.59e-09 | 5.73e-08 | 162 |
| GO:00066446 | Esophagus | ESCC | phospholipid metabolic process | 218/8552 | 383/18723 | 5.37e-06 | 5.59e-05 | 218 |
| GO:00066318 | Esophagus | ESCC | fatty acid metabolic process | 217/8552 | 390/18723 | 4.21e-05 | 3.39e-04 | 217 |
| GO:00463948 | Esophagus | ESCC | carboxylic acid biosynthetic process | 175/8552 | 314/18723 | 1.98e-04 | 1.26e-03 | 175 |
| GO:00160538 | Esophagus | ESCC | organic acid biosynthetic process | 175/8552 | 316/18723 | 3.04e-04 | 1.82e-03 | 175 |
| GO:000663112 | Liver | Cirrhotic | fatty acid metabolic process | 165/4634 | 390/18723 | 1.29e-14 | 1.26e-12 | 165 |
| GO:001605312 | Liver | Cirrhotic | organic acid biosynthetic process | 139/4634 | 316/18723 | 4.28e-14 | 3.83e-12 | 139 |
| GO:004639412 | Liver | Cirrhotic | carboxylic acid biosynthetic process | 137/4634 | 314/18723 | 1.40e-13 | 1.14e-11 | 137 |
| GO:007233011 | Liver | Cirrhotic | monocarboxylic acid biosynthetic process | 93/4634 | 214/18723 | 1.43e-09 | 6.16e-08 | 93 |
| GO:004259412 | Liver | Cirrhotic | response to starvation | 87/4634 | 197/18723 | 1.85e-09 | 7.78e-08 | 87 |
| GO:003166712 | Liver | Cirrhotic | response to nutrient levels | 174/4634 | 474/18723 | 3.08e-09 | 1.27e-07 | 174 |
| GO:007149612 | Liver | Cirrhotic | cellular response to external stimulus | 123/4634 | 320/18723 | 3.27e-08 | 1.10e-06 | 123 |
| GO:000663311 | Liver | Cirrhotic | fatty acid biosynthetic process | 70/4634 | 163/18723 | 2.57e-07 | 6.41e-06 | 70 |
| GO:00316686 | Liver | Cirrhotic | cellular response to extracellular stimulus | 96/4634 | 246/18723 | 4.55e-07 | 1.05e-05 | 96 |
| Page: 1 2 3 4 |
| Pathway ID | Tissue | Disease Stage | Description | Gene Ratio | Bg Ratio | pvalue | p.adjust | qvalue | Count |
| hsa012129 | Esophagus | ESCC | Fatty acid metabolism | 41/4205 | 57/8465 | 5.13e-04 | 1.75e-03 | 8.98e-04 | 41 |
| hsa0121214 | Esophagus | ESCC | Fatty acid metabolism | 41/4205 | 57/8465 | 5.13e-04 | 1.75e-03 | 8.98e-04 | 41 |
| hsa012124 | Liver | HCC | Fatty acid metabolism | 45/4020 | 57/8465 | 1.05e-06 | 1.10e-05 | 6.09e-06 | 45 |
| hsa010402 | Liver | HCC | Biosynthesis of unsaturated fatty acids | 19/4020 | 27/8465 | 1.37e-02 | 3.33e-02 | 1.85e-02 | 19 |
| hsa012125 | Liver | HCC | Fatty acid metabolism | 45/4020 | 57/8465 | 1.05e-06 | 1.10e-05 | 6.09e-06 | 45 |
| hsa010403 | Liver | HCC | Biosynthesis of unsaturated fatty acids | 19/4020 | 27/8465 | 1.37e-02 | 3.33e-02 | 1.85e-02 | 19 |
| hsa012128 | Oral cavity | OSCC | Fatty acid metabolism | 35/3704 | 57/8465 | 5.37e-03 | 1.29e-02 | 6.55e-03 | 35 |
| hsa0121213 | Oral cavity | OSCC | Fatty acid metabolism | 35/3704 | 57/8465 | 5.37e-03 | 1.29e-02 | 6.55e-03 | 35 |
| Page: 1 |
Top |
Cell-cell communication analysis |
| Identification of potential cell-cell interactions between two cell types and their ligand-receptor pairs for different disease states |
| Ligand | Receptor | LRpair | Pathway | Tissue | Disease Stage |
| Page: 1 |
Top |
Single-cell gene regulatory network inference analysis |
| Find out the significant the regulons (TFs) and the target genes of each regulon across cell types for different disease states |
| TF | Cell Type | Tissue | Disease Stage | Target Gene | RSS | Regulon Activity |
| ∗The dot plots of a searched regulon are shown for all cell subpopulations in each disease state of each tissue based on the regulon specific score inferred using pySCENIC and by calculating the average expression. |
| Page: 1 |
Top |
Somatic mutation of malignant transformation related genes |
| Annotation of somatic variants for genes involved in malignant transformation |
| Hugo Symbol | Variant Class | Variant Classification | dbSNP RS | HGVSc | HGVSp | HGVSp Short | SWISSPROT | BIOTYPE | SIFT | PolyPhen | Tumor Sample Barcode | Tissue | Histology | Sex | Age | Stage | Therapy Types | Drugs | Outcome |
| FADS1 | SNV | Missense_Mutation | novel | c.1068G>A | p.Met356Ile | p.M356I | protein_coding | tolerated(0.33) | possibly_damaging(0.833) | TCGA-3C-AALI-01 | Breast | breast invasive carcinoma | Female | <65 | I/II | Unspecific | Poly E | Complete Response | |
| FADS1 | SNV | Missense_Mutation | novel | c.1495N>A | p.Leu499Ile | p.L499I | protein_coding | deleterious(0) | probably_damaging(0.999) | TCGA-AN-A046-01 | Breast | breast invasive carcinoma | Female | >=65 | I/II | Unknown | Unknown | SD | |
| FADS1 | insertion | In_Frame_Ins | novel | c.1165_1166insCTGTCTGCCCCCATTTTGTCCCTGCAGCTC | p.Asn389delinsThrValCysProHisPheValProAlaAlaHis | p.N389delinsTVCPHFVPAAH | protein_coding | TCGA-B6-A0IK-01 | Breast | breast invasive carcinoma | Female | <65 | III/IV | Unknown | Unknown | PD | |||
| FADS1 | SNV | Missense_Mutation | c.1408N>C | p.Glu470Gln | p.E470Q | protein_coding | tolerated(0.53) | benign(0.034) | TCGA-IR-A3LH-01 | Cervix | cervical & endocervical cancer | Female | <65 | I/II | Chemotherapy | cisplatin | CR | ||
| FADS1 | SNV | Missense_Mutation | novel | c.200N>G | p.Thr67Ser | p.T67S | protein_coding | tolerated(0.76) | benign(0.019) | TCGA-CM-6166-01 | Colorectum | colon adenocarcinoma | Female | <65 | I/II | Unknown | Unknown | SD | |
| FADS1 | SNV | Missense_Mutation | novel | c.478N>T | p.Thr160Ser | p.T160S | protein_coding | tolerated(0.56) | benign(0.044) | TCGA-AG-A014-01 | Colorectum | rectum adenocarcinoma | Male | >=65 | I/II | Unknown | Unknown | SD | |
| FADS1 | insertion | Frame_Shift_Ins | novel | c.198_199insGTGAAGT | p.Thr67ValfsTer34 | p.T67Vfs*34 | protein_coding | TCGA-CM-6166-01 | Colorectum | colon adenocarcinoma | Female | <65 | I/II | Unknown | Unknown | SD | |||
| FADS1 | SNV | Missense_Mutation | rs375723539 | c.662C>T | p.Ala221Val | p.A221V | protein_coding | tolerated(0.16) | benign(0.112) | TCGA-A5-A0G1-01 | Endometrium | uterine corpus endometrioid carcinoma | Female | >=65 | I/II | Unknown | Unknown | SD | |
| FADS1 | SNV | Missense_Mutation | novel | c.1492N>C | p.Tyr498His | p.Y498H | protein_coding | deleterious(0.01) | probably_damaging(1) | TCGA-AJ-A3OJ-01 | Endometrium | uterine corpus endometrioid carcinoma | Female | <65 | I/II | Chemotherapy | carboplatin | CR | |
| FADS1 | SNV | Missense_Mutation | c.885N>A | p.Phe295Leu | p.F295L | protein_coding | tolerated(0.41) | benign(0.036) | TCGA-AP-A056-01 | Endometrium | uterine corpus endometrioid carcinoma | Female | <65 | I/II | Unknown | Unknown | SD |
| Page: 1 2 3 |
Top |
Related drugs of malignant transformation related genes |
| Identification of chemicals and drugs interact with genes involved in malignant transfromation |
| (DGIdb 4.0) |
| Entrez ID | Symbol | Category | Interaction Types | Drug Claim Name | Drug Name | PMIDs |
| Page: 1 |

Copyright 2023-Present -The University of Texas Health Science Center at Houston |