
|
|||||
|
 | |
| |
| |
| |
| |
| |
|
Gene: FADD |
Gene summary for FADD |
| Gene information | Species | Human | Gene symbol | FADD | Gene ID | 8772 |
| Gene name | Fas associated via death domain | |
| Gene Alias | GIG3 | |
| Cytomap | 11q13.3 | |
| Gene Type | protein-coding | GO ID | GO:0001655 | UniProtAcc | Q13158 |
Top |
Malignant transformation analysis |
| Identification of the aberrant gene expression in precancerous and cancerous lesions by comparing the gene expression of stem-like cells in diseased tissues with normal stem cells |
| Entrez ID | Symbol | Replicates | Species | Organ | Tissue | Adj P-value | Log2FC | Malignancy |
| 8772 | FADD | LZE4T | Human | Esophagus | ESCC | 3.08e-18 | 5.80e-01 | 0.0811 |
| 8772 | FADD | LZE5T | Human | Esophagus | ESCC | 9.93e-08 | 5.04e-01 | 0.0514 |
| 8772 | FADD | LZE8T | Human | Esophagus | ESCC | 8.22e-06 | 1.76e-01 | 0.067 |
| 8772 | FADD | LZE20T | Human | Esophagus | ESCC | 1.47e-17 | 6.62e-01 | 0.0662 |
| 8772 | FADD | LZE21D1 | Human | Esophagus | HGIN | 1.77e-03 | 6.20e-01 | 0.0632 |
| 8772 | FADD | LZE22T | Human | Esophagus | ESCC | 6.33e-08 | 9.59e-01 | 0.068 |
| 8772 | FADD | LZE24T | Human | Esophagus | ESCC | 9.82e-10 | 2.66e-01 | 0.0596 |
| 8772 | FADD | LZE21T | Human | Esophagus | ESCC | 1.08e-11 | 1.22e+00 | 0.0655 |
| 8772 | FADD | P1T-E | Human | Esophagus | ESCC | 1.45e-24 | 1.11e+00 | 0.0875 |
| 8772 | FADD | P2T-E | Human | Esophagus | ESCC | 2.36e-108 | 2.14e+00 | 0.1177 |
| 8772 | FADD | P4T-E | Human | Esophagus | ESCC | 3.61e-21 | 5.62e-01 | 0.1323 |
| 8772 | FADD | P5T-E | Human | Esophagus | ESCC | 2.72e-27 | 5.36e-01 | 0.1327 |
| 8772 | FADD | P8T-E | Human | Esophagus | ESCC | 8.52e-76 | 1.47e+00 | 0.0889 |
| 8772 | FADD | P9T-E | Human | Esophagus | ESCC | 7.29e-13 | 2.63e-01 | 0.1131 |
| 8772 | FADD | P10T-E | Human | Esophagus | ESCC | 3.41e-09 | 1.55e-01 | 0.116 |
| 8772 | FADD | P11T-E | Human | Esophagus | ESCC | 6.07e-09 | 4.33e-01 | 0.1426 |
| 8772 | FADD | P12T-E | Human | Esophagus | ESCC | 6.68e-33 | 3.20e-01 | 0.1122 |
| 8772 | FADD | P15T-E | Human | Esophagus | ESCC | 6.18e-25 | 6.75e-01 | 0.1149 |
| 8772 | FADD | P16T-E | Human | Esophagus | ESCC | 1.77e-90 | 1.80e+00 | 0.1153 |
| 8772 | FADD | P17T-E | Human | Esophagus | ESCC | 5.79e-24 | 1.84e+00 | 0.1278 |
| Page: 1 2 3 4 5 |
| Tissue | Expression Dynamics | Abbreviation |
| Esophagus | 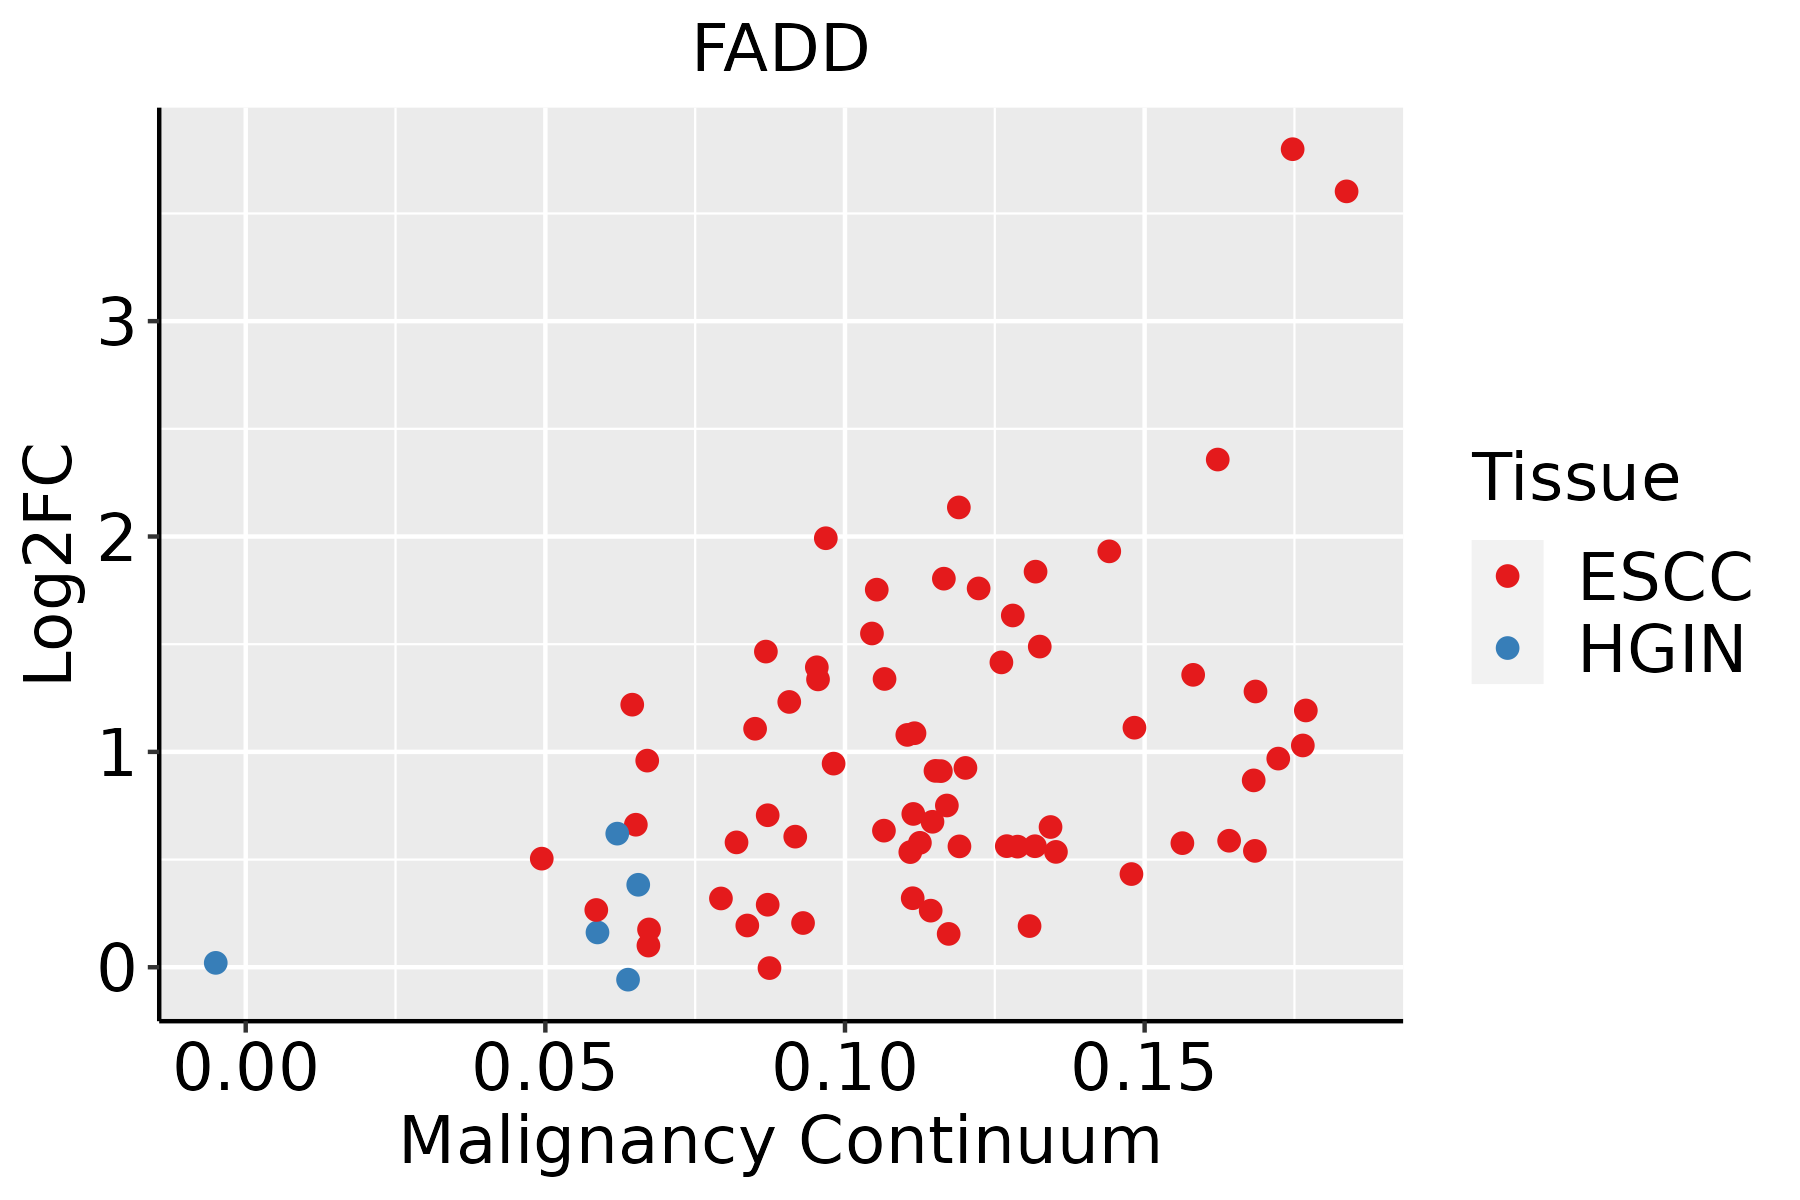 | ESCC: Esophageal squamous cell carcinoma |
| HGIN: High-grade intraepithelial neoplasias | ||
| LGIN: Low-grade intraepithelial neoplasias | ||
| Liver | 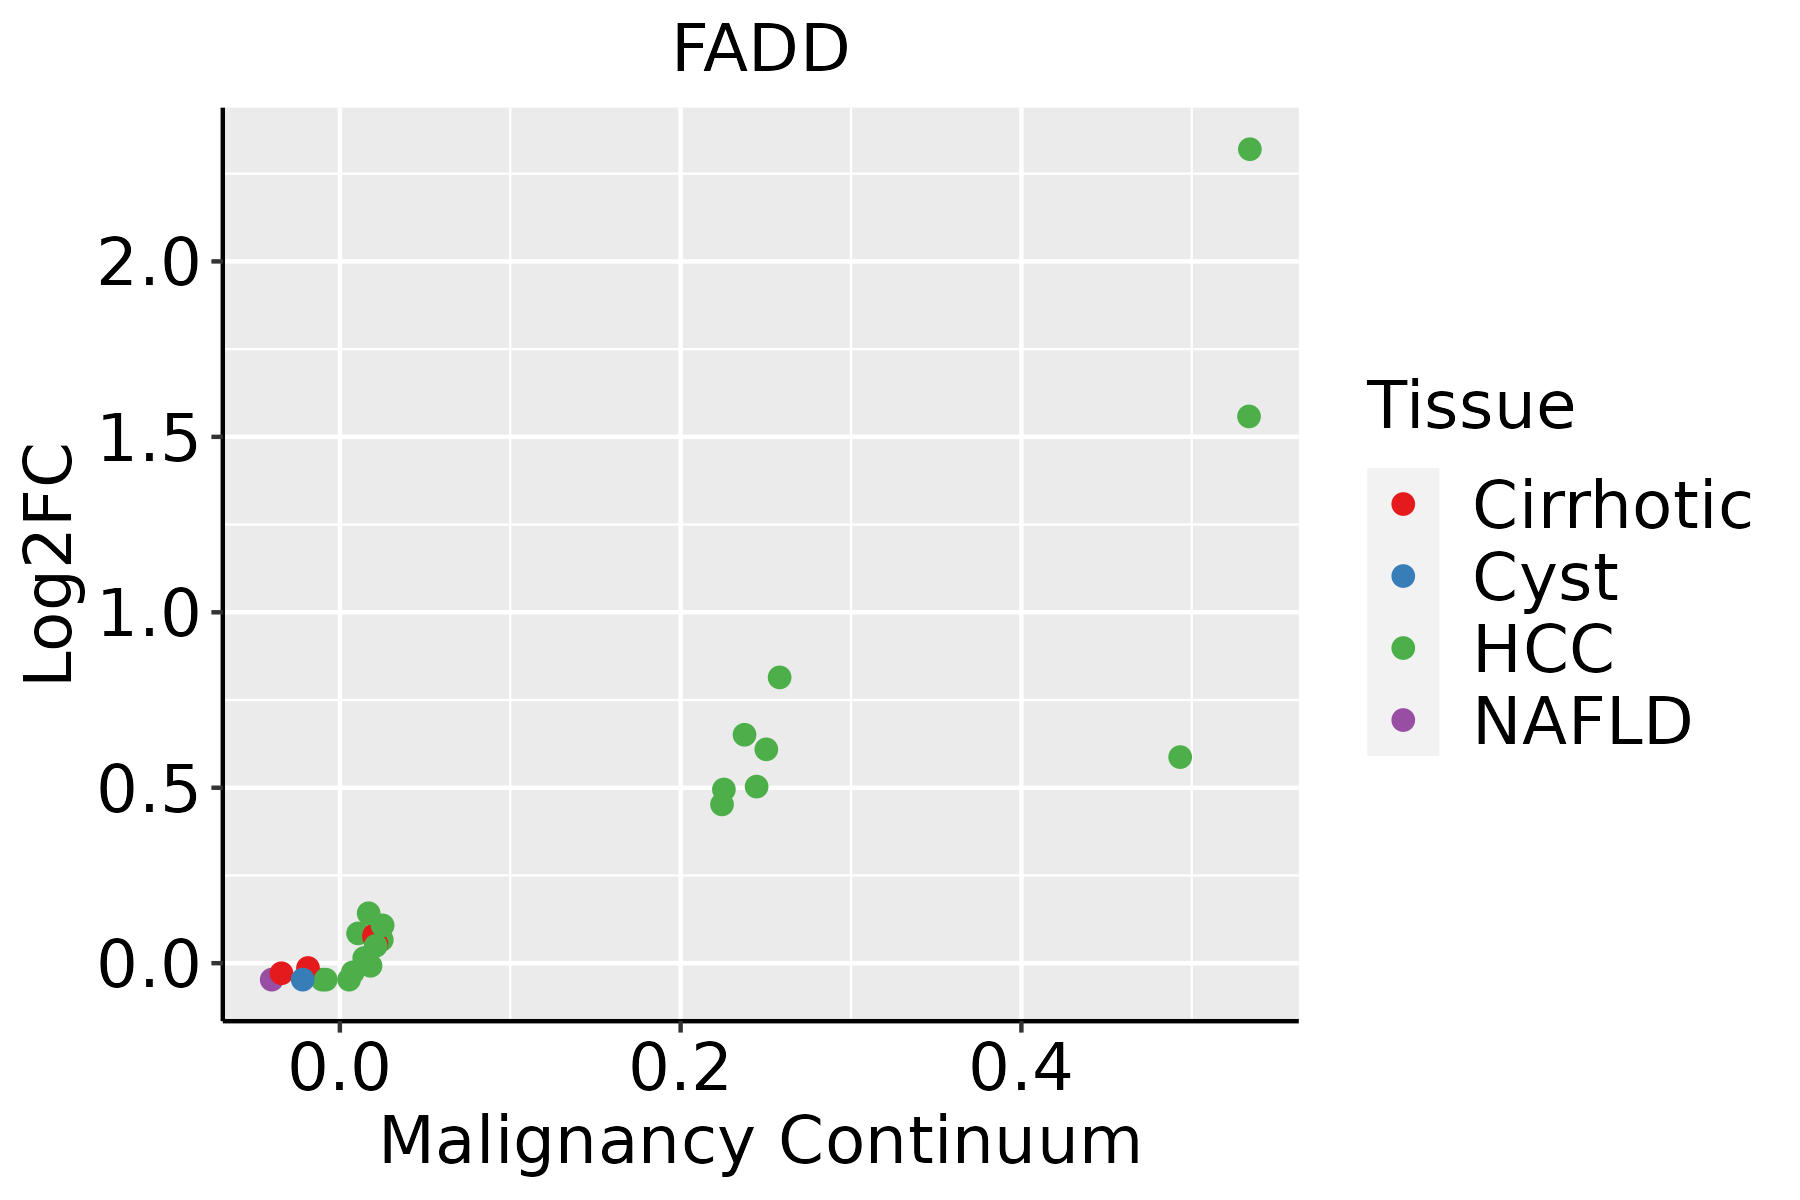 | HCC: Hepatocellular carcinoma |
| NAFLD: Non-alcoholic fatty liver disease | ||
| Oral Cavity | 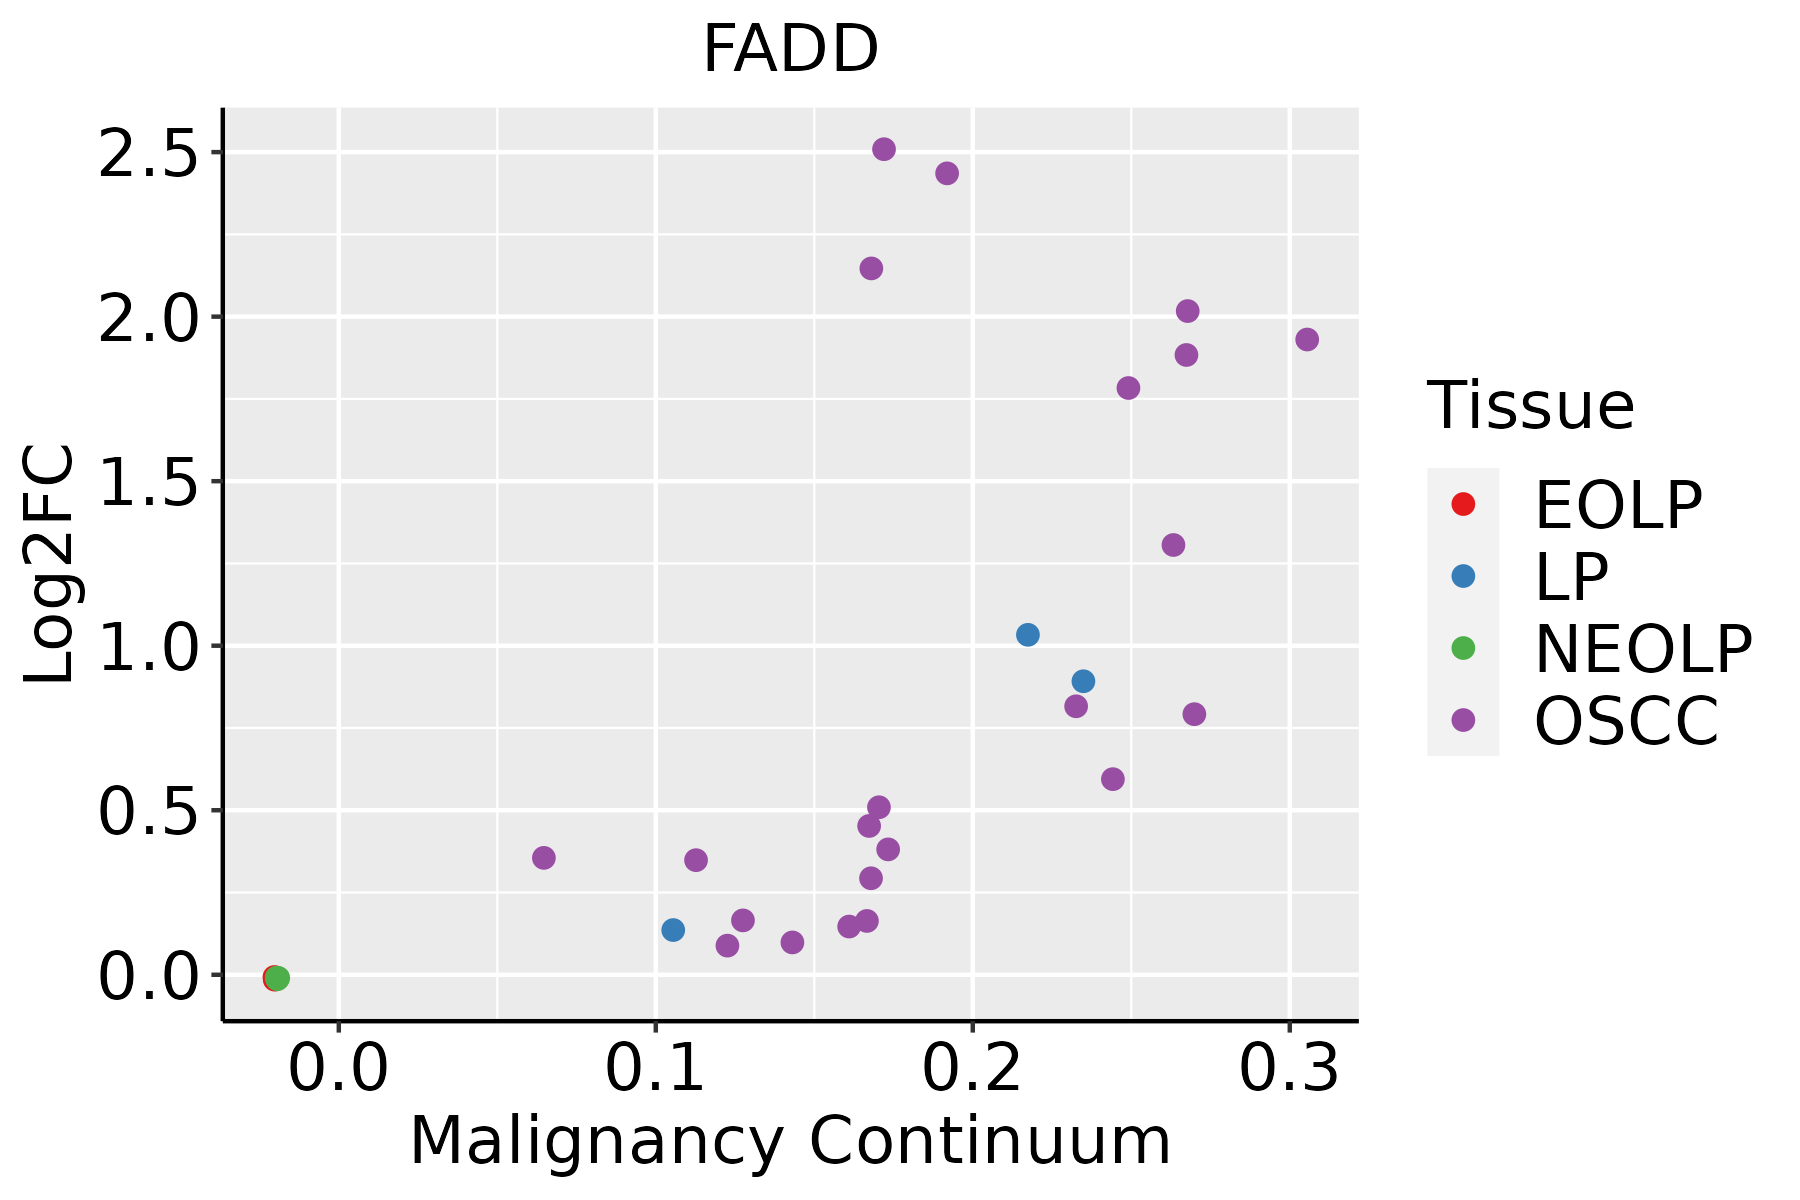 | EOLP: Erosive Oral lichen planus |
| LP: leukoplakia | ||
| NEOLP: Non-erosive oral lichen planus | ||
| OSCC: Oral squamous cell carcinoma | ||
| Skin | 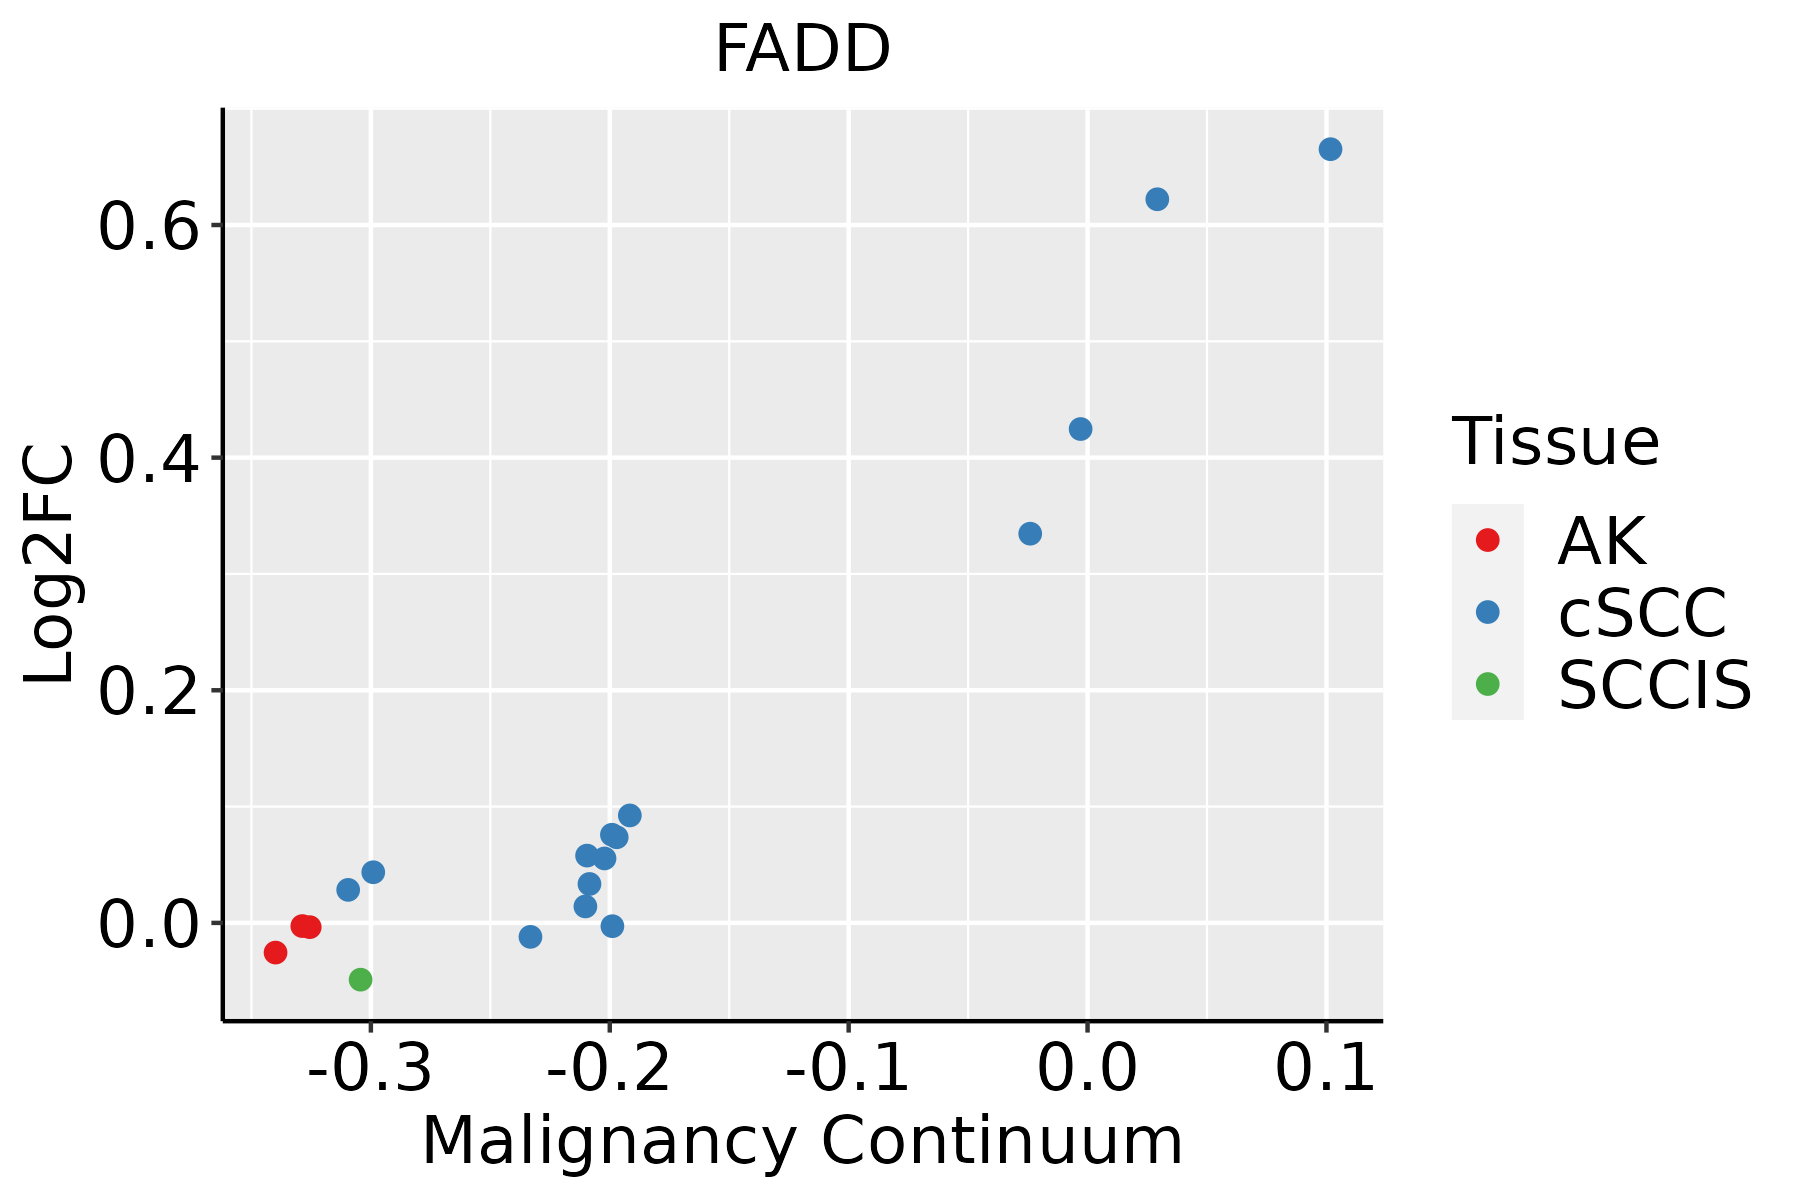 | AK: Actinic keratosis |
| cSCC: Cutaneous squamous cell carcinoma | ||
| SCCIS:squamous cell carcinoma in situ |
| ∗log2FC in expression of this searched gene in stem-like cells from each diseased tissue sample relative to stem-like cells in normal samples in each tissue plotted against the malignancy continuum. Samples are colored based on if they are from different disease stage. |
Top |
Malignant transformation related pathway analysis |
| Find out the enriched GO biological processes and KEGG pathways involved in transition from healthy to precancer to cancer |
| Tissue | Disease Stage | Enriched GO biological Processes |
| Colorectum | AD |  |
| Colorectum | SER |  |
| Colorectum | MSS |  |
| Colorectum | MSI-H |  |
| Colorectum | FAP |  |
| ∗Top 15 enriched GO BP terms are showed in the bar plot of each disease state in each tissue. Each row represents a significant GO biological process which is colored according to the -log10(p.adjust). |
| Page: 1 2 3 4 5 6 7 8 9 |
| GO ID | Tissue | Disease Stage | Description | Gene Ratio | Bg Ratio | pvalue | p.adjust | Count |
| GO:004586227 | Esophagus | HGIN | positive regulation of proteolysis | 107/2587 | 372/18723 | 2.61e-14 | 4.60e-12 | 107 |
| GO:200123327 | Esophagus | HGIN | regulation of apoptotic signaling pathway | 97/2587 | 356/18723 | 1.36e-11 | 1.57e-09 | 97 |
| GO:200123519 | Esophagus | HGIN | positive regulation of apoptotic signaling pathway | 41/2587 | 126/18723 | 6.06e-08 | 3.22e-06 | 41 |
| GO:200011626 | Esophagus | HGIN | regulation of cysteine-type endopeptidase activity | 63/2587 | 235/18723 | 9.71e-08 | 5.02e-06 | 63 |
| GO:005254726 | Esophagus | HGIN | regulation of peptidase activity | 102/2587 | 461/18723 | 6.29e-07 | 2.72e-05 | 102 |
| GO:001095225 | Esophagus | HGIN | positive regulation of peptidase activity | 53/2587 | 197/18723 | 8.70e-07 | 3.59e-05 | 53 |
| GO:004312220 | Esophagus | HGIN | regulation of I-kappaB kinase/NF-kappaB signaling | 63/2587 | 249/18723 | 8.91e-07 | 3.61e-05 | 63 |
| GO:005254826 | Esophagus | HGIN | regulation of endopeptidase activity | 96/2587 | 432/18723 | 1.09e-06 | 4.30e-05 | 96 |
| GO:009719126 | Esophagus | HGIN | extrinsic apoptotic signaling pathway | 56/2587 | 219/18723 | 2.48e-06 | 8.80e-05 | 56 |
| GO:000724918 | Esophagus | HGIN | I-kappaB kinase/NF-kappaB signaling | 67/2587 | 281/18723 | 3.84e-06 | 1.29e-04 | 67 |
| GO:004312317 | Esophagus | HGIN | positive regulation of I-kappaB kinase/NF-kappaB signaling | 49/2587 | 186/18723 | 4.22e-06 | 1.40e-04 | 49 |
| GO:007099727 | Esophagus | HGIN | neuron death | 81/2587 | 361/18723 | 5.01e-06 | 1.61e-04 | 81 |
| GO:200105620 | Esophagus | HGIN | positive regulation of cysteine-type endopeptidase activity | 41/2587 | 148/18723 | 6.65e-06 | 2.07e-04 | 41 |
| GO:001095020 | Esophagus | HGIN | positive regulation of endopeptidase activity | 47/2587 | 179/18723 | 7.23e-06 | 2.20e-04 | 47 |
| GO:005160417 | Esophagus | HGIN | protein maturation | 68/2587 | 294/18723 | 9.77e-06 | 2.86e-04 | 68 |
| GO:003009927 | Esophagus | HGIN | myeloid cell differentiation | 83/2587 | 381/18723 | 1.26e-05 | 3.52e-04 | 83 |
| GO:007149626 | Esophagus | HGIN | cellular response to external stimulus | 71/2587 | 320/18723 | 2.77e-05 | 7.19e-04 | 71 |
| GO:004563725 | Esophagus | HGIN | regulation of myeloid cell differentiation | 49/2587 | 210/18723 | 1.28e-04 | 2.61e-03 | 49 |
| GO:004873225 | Esophagus | HGIN | gland development | 88/2587 | 436/18723 | 1.34e-04 | 2.71e-03 | 88 |
| GO:00027617 | Esophagus | HGIN | regulation of myeloid leukocyte differentiation | 31/2587 | 120/18723 | 3.35e-04 | 5.50e-03 | 31 |
| Page: 1 2 3 4 5 6 7 8 9 10 11 12 13 14 15 16 17 |
| Pathway ID | Tissue | Disease Stage | Description | Gene Ratio | Bg Ratio | pvalue | p.adjust | qvalue | Count |
| hsa0502230 | Esophagus | HGIN | Pathways of neurodegeneration - multiple diseases | 153/1383 | 476/8465 | 1.22e-18 | 4.41e-17 | 3.50e-17 | 153 |
| hsa0501030 | Esophagus | HGIN | Alzheimer disease | 130/1383 | 384/8465 | 5.26e-18 | 1.71e-16 | 1.36e-16 | 130 |
| hsa0513239 | Esophagus | HGIN | Salmonella infection | 69/1383 | 249/8465 | 3.02e-06 | 4.47e-05 | 3.55e-05 | 69 |
| hsa0513039 | Esophagus | HGIN | Pathogenic Escherichia coli infection | 54/1383 | 197/8465 | 4.91e-05 | 6.15e-04 | 4.89e-04 | 54 |
| hsa0516930 | Esophagus | HGIN | Epstein-Barr virus infection | 55/1383 | 202/8465 | 5.13e-05 | 6.19e-04 | 4.92e-04 | 55 |
| hsa0516730 | Esophagus | HGIN | Kaposi sarcoma-associated herpesvirus infection | 51/1383 | 194/8465 | 2.46e-04 | 2.69e-03 | 2.14e-03 | 51 |
| hsa0421020 | Esophagus | HGIN | Apoptosis | 36/1383 | 136/8465 | 1.67e-03 | 1.52e-02 | 1.20e-02 | 36 |
| hsa0517029 | Esophagus | HGIN | Human immunodeficiency virus 1 infection | 51/1383 | 212/8465 | 2.16e-03 | 1.90e-02 | 1.51e-02 | 51 |
| hsa046219 | Esophagus | HGIN | NOD-like receptor signaling pathway | 45/1383 | 186/8465 | 3.40e-03 | 2.54e-02 | 2.02e-02 | 45 |
| hsa0516420 | Esophagus | HGIN | Influenza A | 42/1383 | 171/8465 | 3.41e-03 | 2.54e-02 | 2.02e-02 | 42 |
| hsa0465726 | Esophagus | HGIN | IL-17 signaling pathway | 25/1383 | 94/8465 | 7.52e-03 | 4.63e-02 | 3.68e-02 | 25 |
| hsa0516330 | Esophagus | HGIN | Human cytomegalovirus infection | 51/1383 | 225/8465 | 7.67e-03 | 4.63e-02 | 3.68e-02 | 51 |
| hsa05022113 | Esophagus | HGIN | Pathways of neurodegeneration - multiple diseases | 153/1383 | 476/8465 | 1.22e-18 | 4.41e-17 | 3.50e-17 | 153 |
| hsa05010113 | Esophagus | HGIN | Alzheimer disease | 130/1383 | 384/8465 | 5.26e-18 | 1.71e-16 | 1.36e-16 | 130 |
| hsa05132115 | Esophagus | HGIN | Salmonella infection | 69/1383 | 249/8465 | 3.02e-06 | 4.47e-05 | 3.55e-05 | 69 |
| hsa05130115 | Esophagus | HGIN | Pathogenic Escherichia coli infection | 54/1383 | 197/8465 | 4.91e-05 | 6.15e-04 | 4.89e-04 | 54 |
| hsa05169114 | Esophagus | HGIN | Epstein-Barr virus infection | 55/1383 | 202/8465 | 5.13e-05 | 6.19e-04 | 4.92e-04 | 55 |
| hsa05167114 | Esophagus | HGIN | Kaposi sarcoma-associated herpesvirus infection | 51/1383 | 194/8465 | 2.46e-04 | 2.69e-03 | 2.14e-03 | 51 |
| hsa04210110 | Esophagus | HGIN | Apoptosis | 36/1383 | 136/8465 | 1.67e-03 | 1.52e-02 | 1.20e-02 | 36 |
| hsa05170112 | Esophagus | HGIN | Human immunodeficiency virus 1 infection | 51/1383 | 212/8465 | 2.16e-03 | 1.90e-02 | 1.51e-02 | 51 |
| Page: 1 2 3 4 5 6 7 8 9 10 |
Top |
Cell-cell communication analysis |
| Identification of potential cell-cell interactions between two cell types and their ligand-receptor pairs for different disease states |
| Ligand | Receptor | LRpair | Pathway | Tissue | Disease Stage |
| Page: 1 |
Top |
Single-cell gene regulatory network inference analysis |
| Find out the significant the regulons (TFs) and the target genes of each regulon across cell types for different disease states |
| TF | Cell Type | Tissue | Disease Stage | Target Gene | RSS | Regulon Activity |
| ∗The dot plots of a searched regulon are shown for all cell subpopulations in each disease state of each tissue based on the regulon specific score inferred using pySCENIC and by calculating the average expression. |
| Page: 1 |
Top |
Somatic mutation of malignant transformation related genes |
| Annotation of somatic variants for genes involved in malignant transformation |
| Hugo Symbol | Variant Class | Variant Classification | dbSNP RS | HGVSc | HGVSp | HGVSp Short | SWISSPROT | BIOTYPE | SIFT | PolyPhen | Tumor Sample Barcode | Tissue | Histology | Sex | Age | Stage | Therapy Types | Drugs | Outcome |
| FADD | deletion | Frame_Shift_Del | novel | c.464delA | p.Asn155ThrfsTer16 | p.N155Tfs*16 | Q13158 | protein_coding | TCGA-EW-A2FV-01 | Breast | breast invasive carcinoma | Female | <65 | III/IV | Chemotherapy | docetaxel | SD | ||
| FADD | SNV | Missense_Mutation | novel | c.163C>A | p.Leu55Met | p.L55M | Q13158 | protein_coding | tolerated(0.06) | probably_damaging(0.995) | TCGA-EA-A3HS-01 | Cervix | cervical & endocervical cancer | Female | <65 | I/II | Unknown | Unknown | SD |
| FADD | SNV | Missense_Mutation | novel | c.404G>A | p.Arg135His | p.R135H | Q13158 | protein_coding | tolerated(0.44) | benign(0.203) | TCGA-VS-A94Z-01 | Cervix | cervical & endocervical cancer | Female | <65 | I/II | Chemotherapy | cisplatin | CR |
| FADD | SNV | Missense_Mutation | novel | c.485N>C | p.Val162Ala | p.V162A | Q13158 | protein_coding | deleterious(0) | probably_damaging(0.939) | TCGA-AA-3845-01 | Colorectum | colon adenocarcinoma | Female | >=65 | I/II | Unknown | Unknown | PD |
| FADD | SNV | Missense_Mutation | novel | c.525C>A | p.Asp175Glu | p.D175E | Q13158 | protein_coding | deleterious(0) | probably_damaging(0.995) | TCGA-AM-5820-01 | Colorectum | colon adenocarcinoma | Female | <65 | I/II | Unknown | Unknown | SD |
| FADD | SNV | Missense_Mutation | c.331N>C | p.Asp111His | p.D111H | Q13158 | protein_coding | deleterious(0.02) | probably_damaging(0.995) | TCGA-D5-6928-01 | Colorectum | colon adenocarcinoma | Male | >=65 | I/II | Unknown | Unknown | SD | |
| FADD | insertion | Frame_Shift_Ins | novel | c.524_525insG | p.Asp175GlufsTer11 | p.D175Efs*11 | Q13158 | protein_coding | TCGA-AM-5820-01 | Colorectum | colon adenocarcinoma | Female | <65 | I/II | Unknown | Unknown | SD | ||
| FADD | SNV | Missense_Mutation | novel | c.14N>C | p.Leu5Pro | p.L5P | Q13158 | protein_coding | deleterious(0) | probably_damaging(0.954) | TCGA-A5-A1OF-01 | Endometrium | uterine corpus endometrioid carcinoma | Female | <65 | I/II | Unknown | Unknown | SD |
| FADD | SNV | Missense_Mutation | novel | c.404N>A | p.Arg135His | p.R135H | Q13158 | protein_coding | tolerated(0.44) | benign(0.203) | TCGA-A5-A1OF-01 | Endometrium | uterine corpus endometrioid carcinoma | Female | <65 | I/II | Unknown | Unknown | SD |
| FADD | SNV | Missense_Mutation | novel | c.80N>A | p.Cys27Tyr | p.C27Y | Q13158 | protein_coding | deleterious(0.01) | probably_damaging(1) | TCGA-AP-A1DK-01 | Endometrium | uterine corpus endometrioid carcinoma | Female | <65 | I/II | Unknown | Unknown | SD |
| Page: 1 2 3 |
Top |
Related drugs of malignant transformation related genes |
| Identification of chemicals and drugs interact with genes involved in malignant transfromation |
| (DGIdb 4.0) |
| Entrez ID | Symbol | Category | Interaction Types | Drug Claim Name | Drug Name | PMIDs |
| 8772 | FADD | NA | FAS LIGAND | 11384965 |
| Page: 1 |

Copyright 2023-Present -The University of Texas Health Science Center at Houston |