
|
|||||
|
 | |
| |
| |
| |
| |
| |
|
Gene: FABP5 |
Gene summary for FABP5 |
| Gene information | Species | Human | Gene symbol | FABP5 | Gene ID | 2171 |
| Gene name | fatty acid binding protein 5 | |
| Gene Alias | E-FABP | |
| Cytomap | 8q21.13 | |
| Gene Type | protein-coding | GO ID | GO:0001516 | UniProtAcc | E7DVW5 |
Top |
Malignant transformation analysis |
| Identification of the aberrant gene expression in precancerous and cancerous lesions by comparing the gene expression of stem-like cells in diseased tissues with normal stem cells |
| Entrez ID | Symbol | Replicates | Species | Organ | Tissue | Adj P-value | Log2FC | Malignancy |
| 2171 | FABP5 | GSM4909281 | Human | Breast | IDC | 3.56e-57 | 9.75e-01 | 0.21 |
| 2171 | FABP5 | GSM4909282 | Human | Breast | IDC | 3.67e-34 | 7.20e-01 | -0.0288 |
| 2171 | FABP5 | GSM4909285 | Human | Breast | IDC | 2.22e-60 | 1.03e+00 | 0.21 |
| 2171 | FABP5 | GSM4909287 | Human | Breast | IDC | 5.03e-11 | 4.90e-01 | 0.2057 |
| 2171 | FABP5 | GSM4909293 | Human | Breast | IDC | 2.26e-06 | 1.03e-01 | 0.1581 |
| 2171 | FABP5 | GSM4909311 | Human | Breast | IDC | 3.11e-02 | -1.78e-01 | 0.1534 |
| 2171 | FABP5 | brca10 | Human | Breast | Precancer | 6.34e-08 | 3.41e-01 | -0.0029 |
| 2171 | FABP5 | NCCBC3 | Human | Breast | DCIS | 6.82e-03 | 3.26e-01 | 0.1198 |
| 2171 | FABP5 | NCCBC5 | Human | Breast | DCIS | 3.93e-08 | 6.35e-01 | 0.2046 |
| 2171 | FABP5 | DCIS2 | Human | Breast | DCIS | 1.69e-29 | 6.51e-02 | 0.0085 |
| 2171 | FABP5 | CA_HPV_1 | Human | Cervix | CC | 1.13e-08 | -5.23e-01 | 0.0264 |
| 2171 | FABP5 | CA_HPV_3 | Human | Cervix | CC | 1.30e-08 | 5.54e-01 | 0.0414 |
| 2171 | FABP5 | HSIL_HPV_1 | Human | Cervix | HSIL_HPV | 3.05e-20 | -9.17e-01 | 0.0116 |
| 2171 | FABP5 | HSIL_HPV_2 | Human | Cervix | HSIL_HPV | 1.38e-22 | -8.44e-01 | 0.0208 |
| 2171 | FABP5 | N_HPV_1 | Human | Cervix | N_HPV | 2.32e-08 | -5.38e-01 | 0.0079 |
| 2171 | FABP5 | N_HPV_2 | Human | Cervix | N_HPV | 1.25e-07 | 4.15e-01 | -0.0131 |
| 2171 | FABP5 | CCI_2 | Human | Cervix | CC | 2.45e-19 | -1.42e+00 | 0.5249 |
| 2171 | FABP5 | CCII_1 | Human | Cervix | CC | 5.98e-22 | -1.24e+00 | 0.3249 |
| 2171 | FABP5 | Tumor | Human | Cervix | CC | 1.44e-33 | 7.57e-01 | 0.1241 |
| 2171 | FABP5 | sample1 | Human | Cervix | CC | 1.31e-03 | 3.97e-01 | 0.0959 |
| Page: 1 2 3 4 5 6 7 8 9 10 |
| Tissue | Expression Dynamics | Abbreviation |
| Breast |  | IDC: Invasive ductal carcinoma |
| DCIS: Ductal carcinoma in situ | ||
| Precancer(BRCA1-mut): Precancerous lesion from BRCA1 mutation carriers | ||
| Cervix | 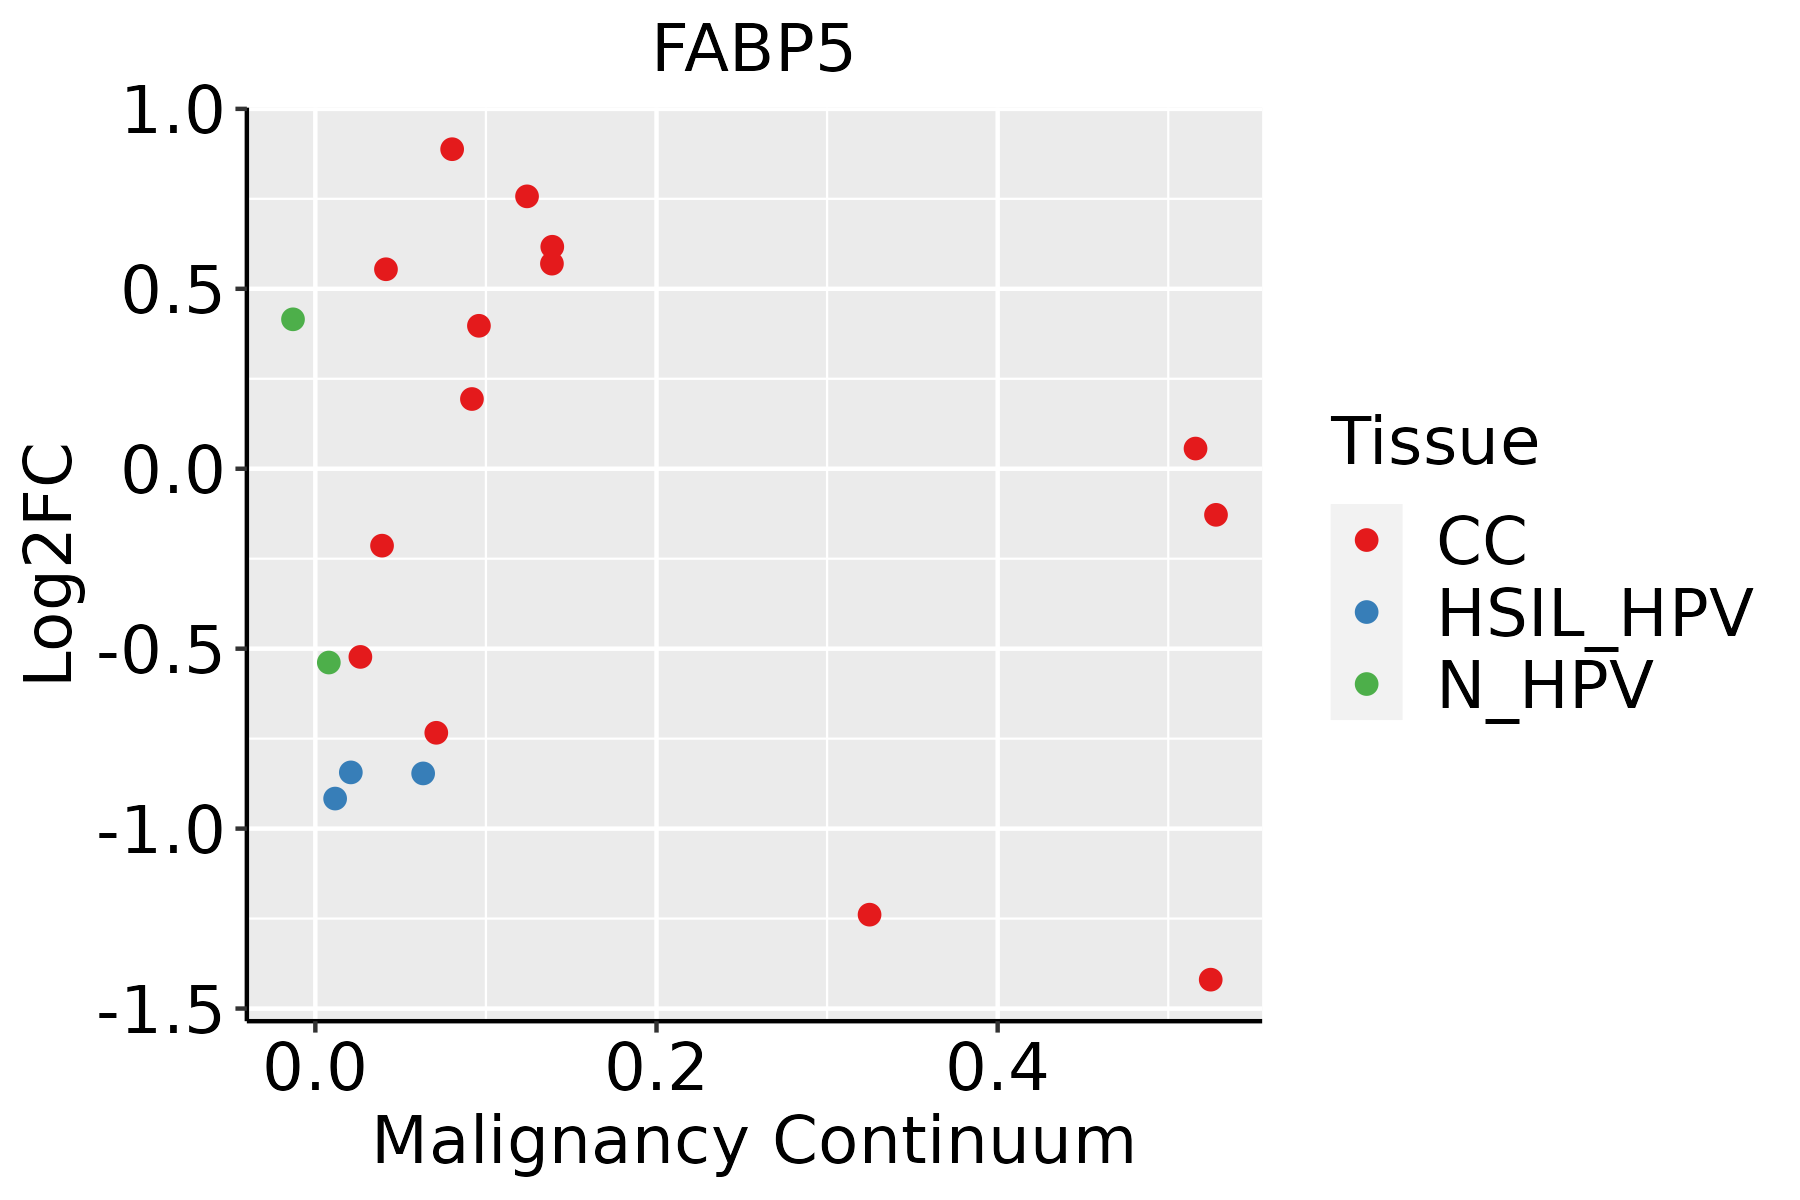 | CC: Cervix cancer |
| HSIL_HPV: HPV-infected high-grade squamous intraepithelial lesions | ||
| N_HPV: HPV-infected normal cervix | ||
| Endometrium | 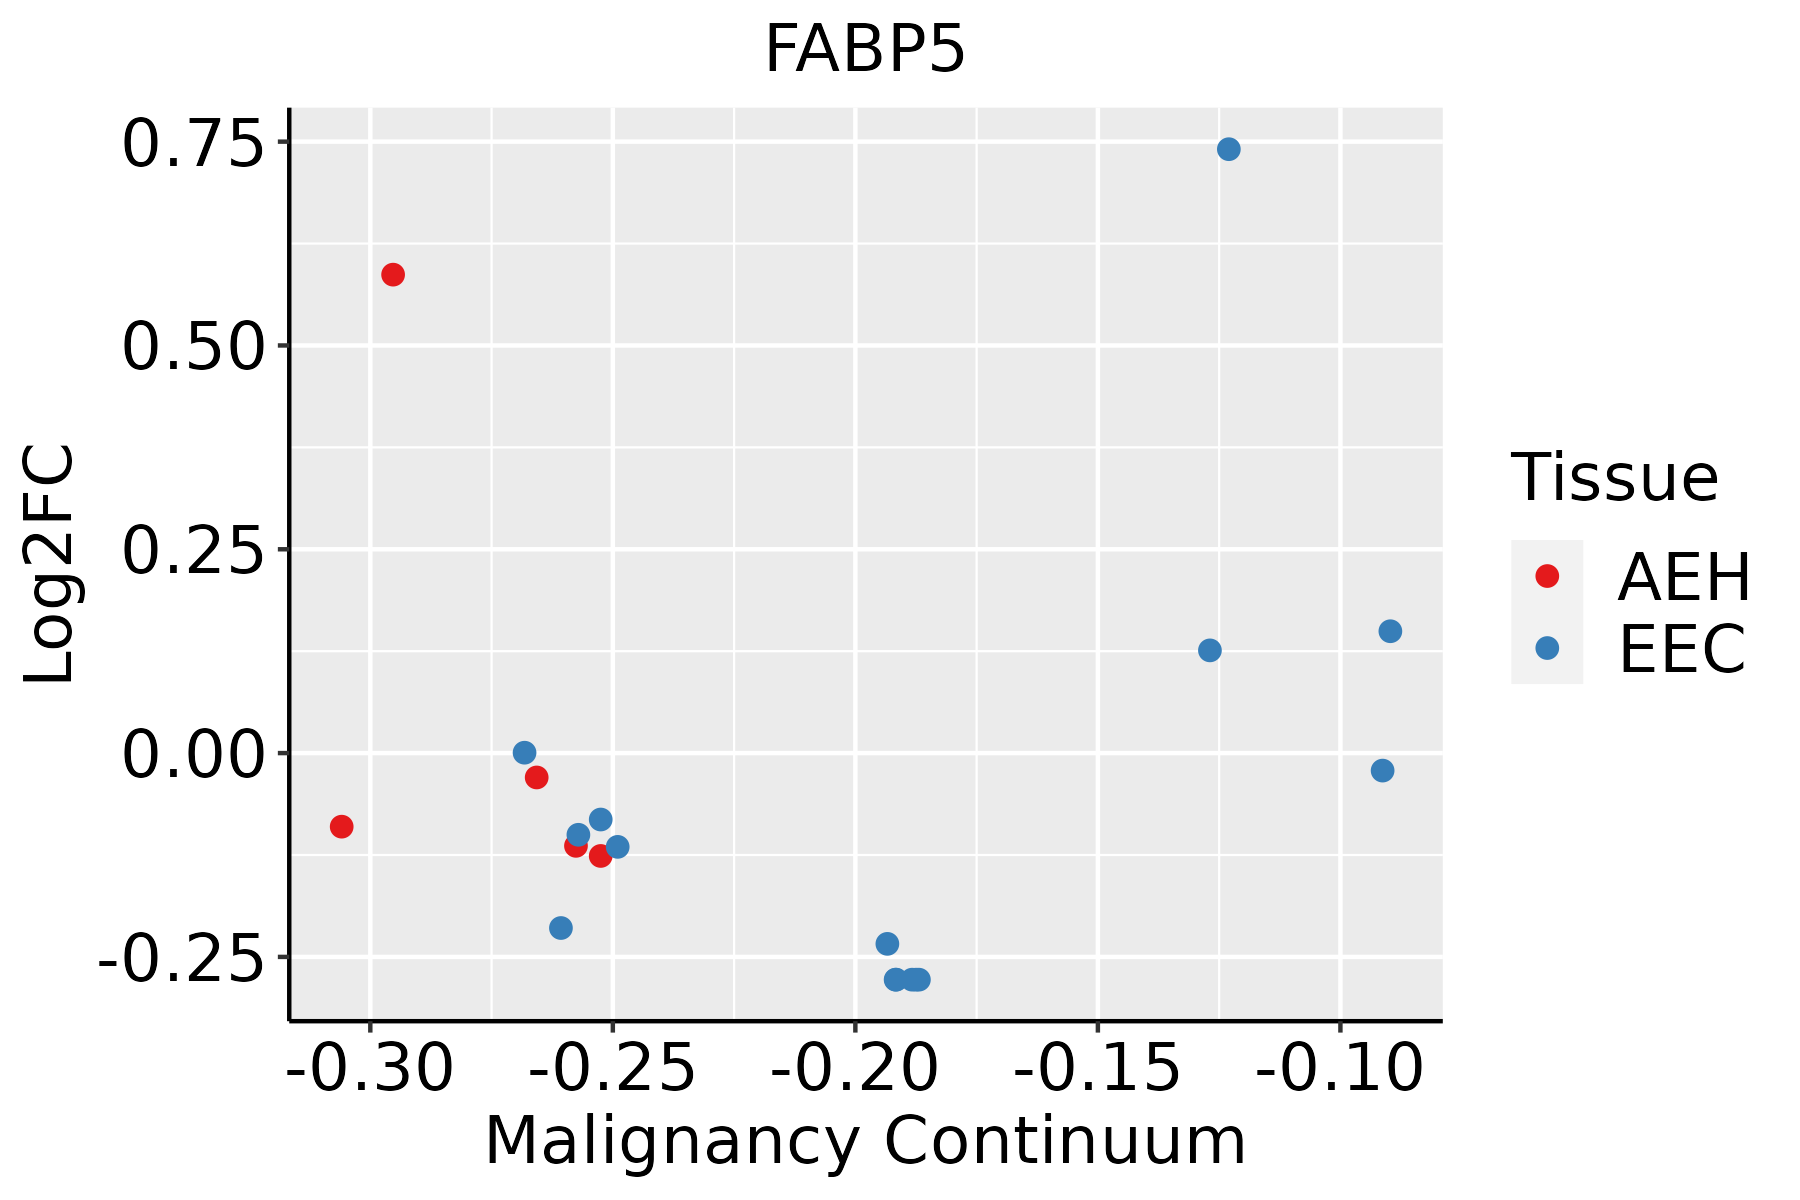 | AEH: Atypical endometrial hyperplasia |
| EEC: Endometrioid Cancer | ||
| Esophagus | 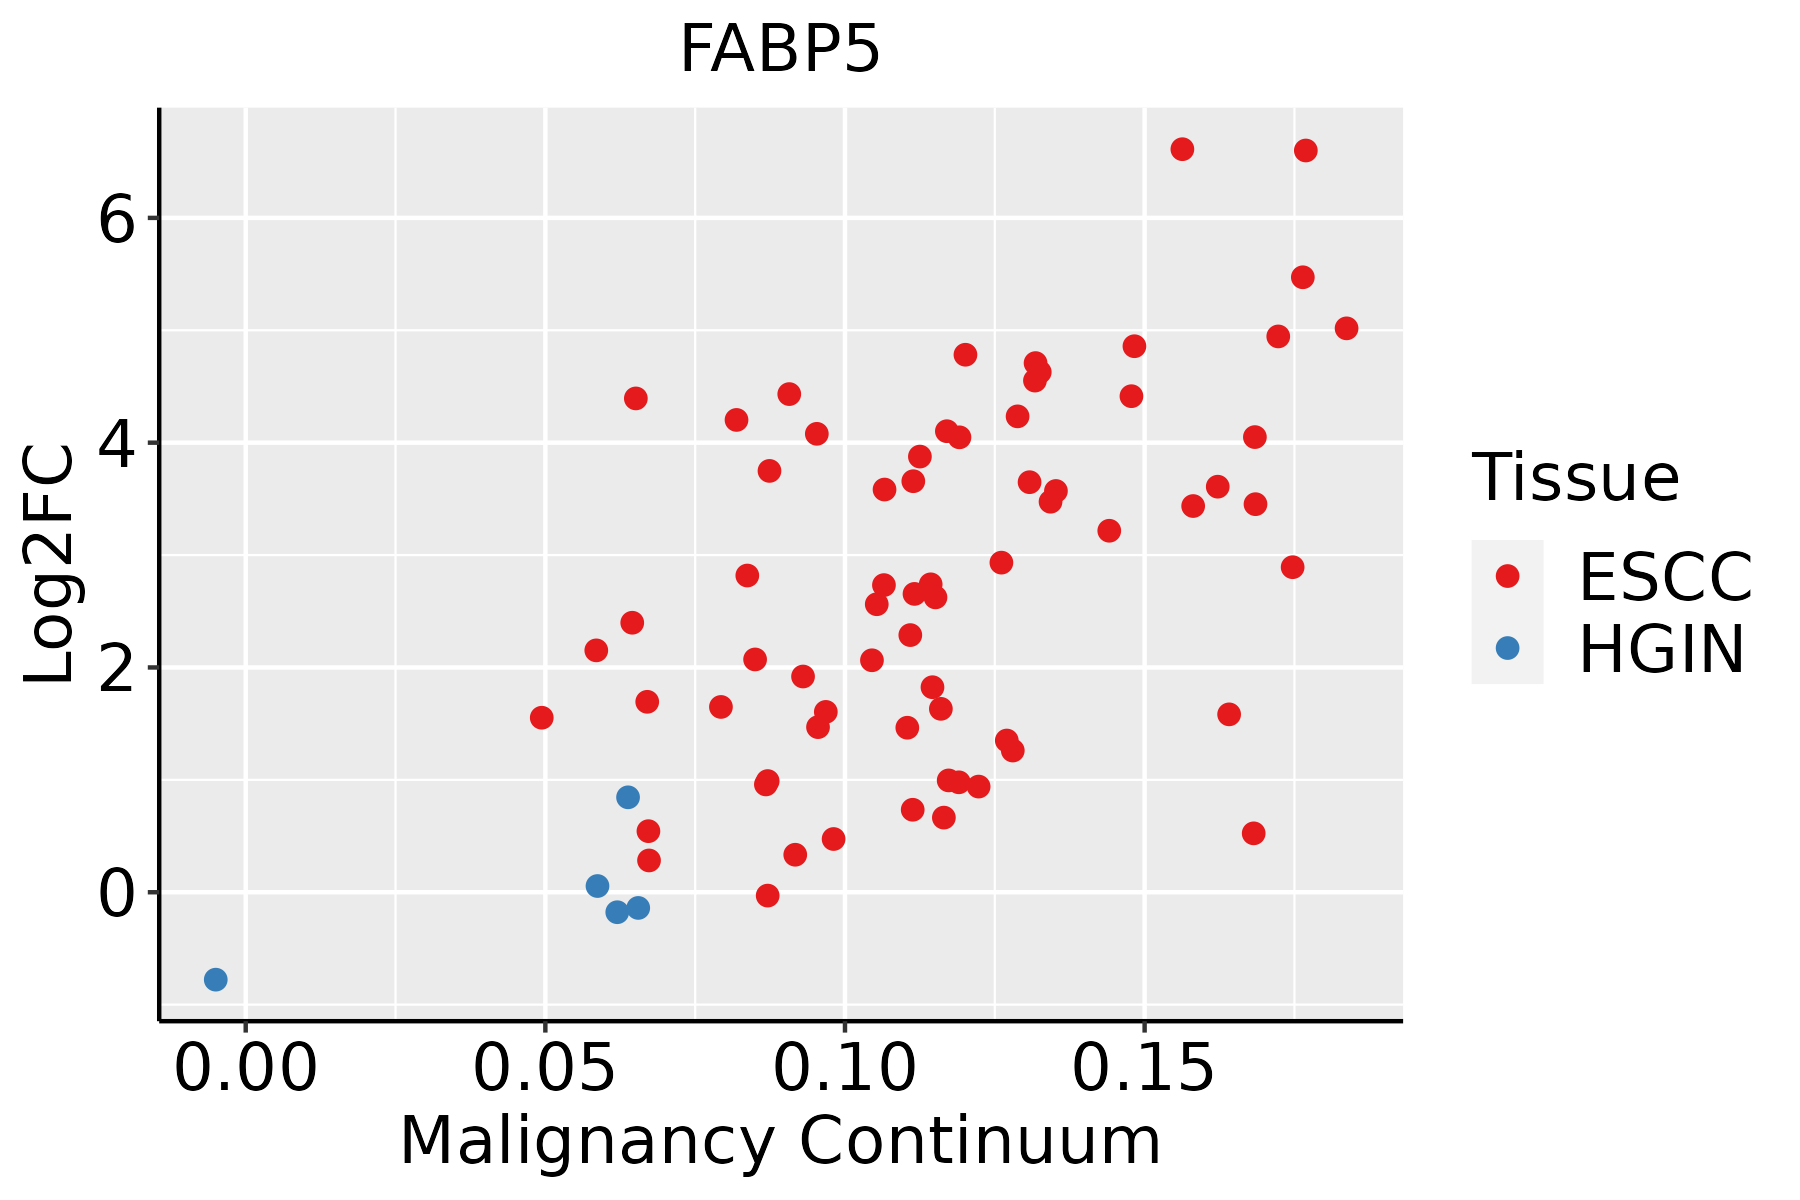 | ESCC: Esophageal squamous cell carcinoma |
| HGIN: High-grade intraepithelial neoplasias | ||
| LGIN: Low-grade intraepithelial neoplasias | ||
| GC |  | CAG: Chronic atrophic gastritis |
| CAG with IM: Chronic atrophic gastritis with intestinal metaplasia | ||
| CSG: Chronic superficial gastritis | ||
| GC: Gastric cancer | ||
| SIM: Severe intestinal metaplasia | ||
| WIM: Wild intestinal metaplasia | ||
| Liver |  | HCC: Hepatocellular carcinoma |
| NAFLD: Non-alcoholic fatty liver disease | ||
| Oral Cavity | 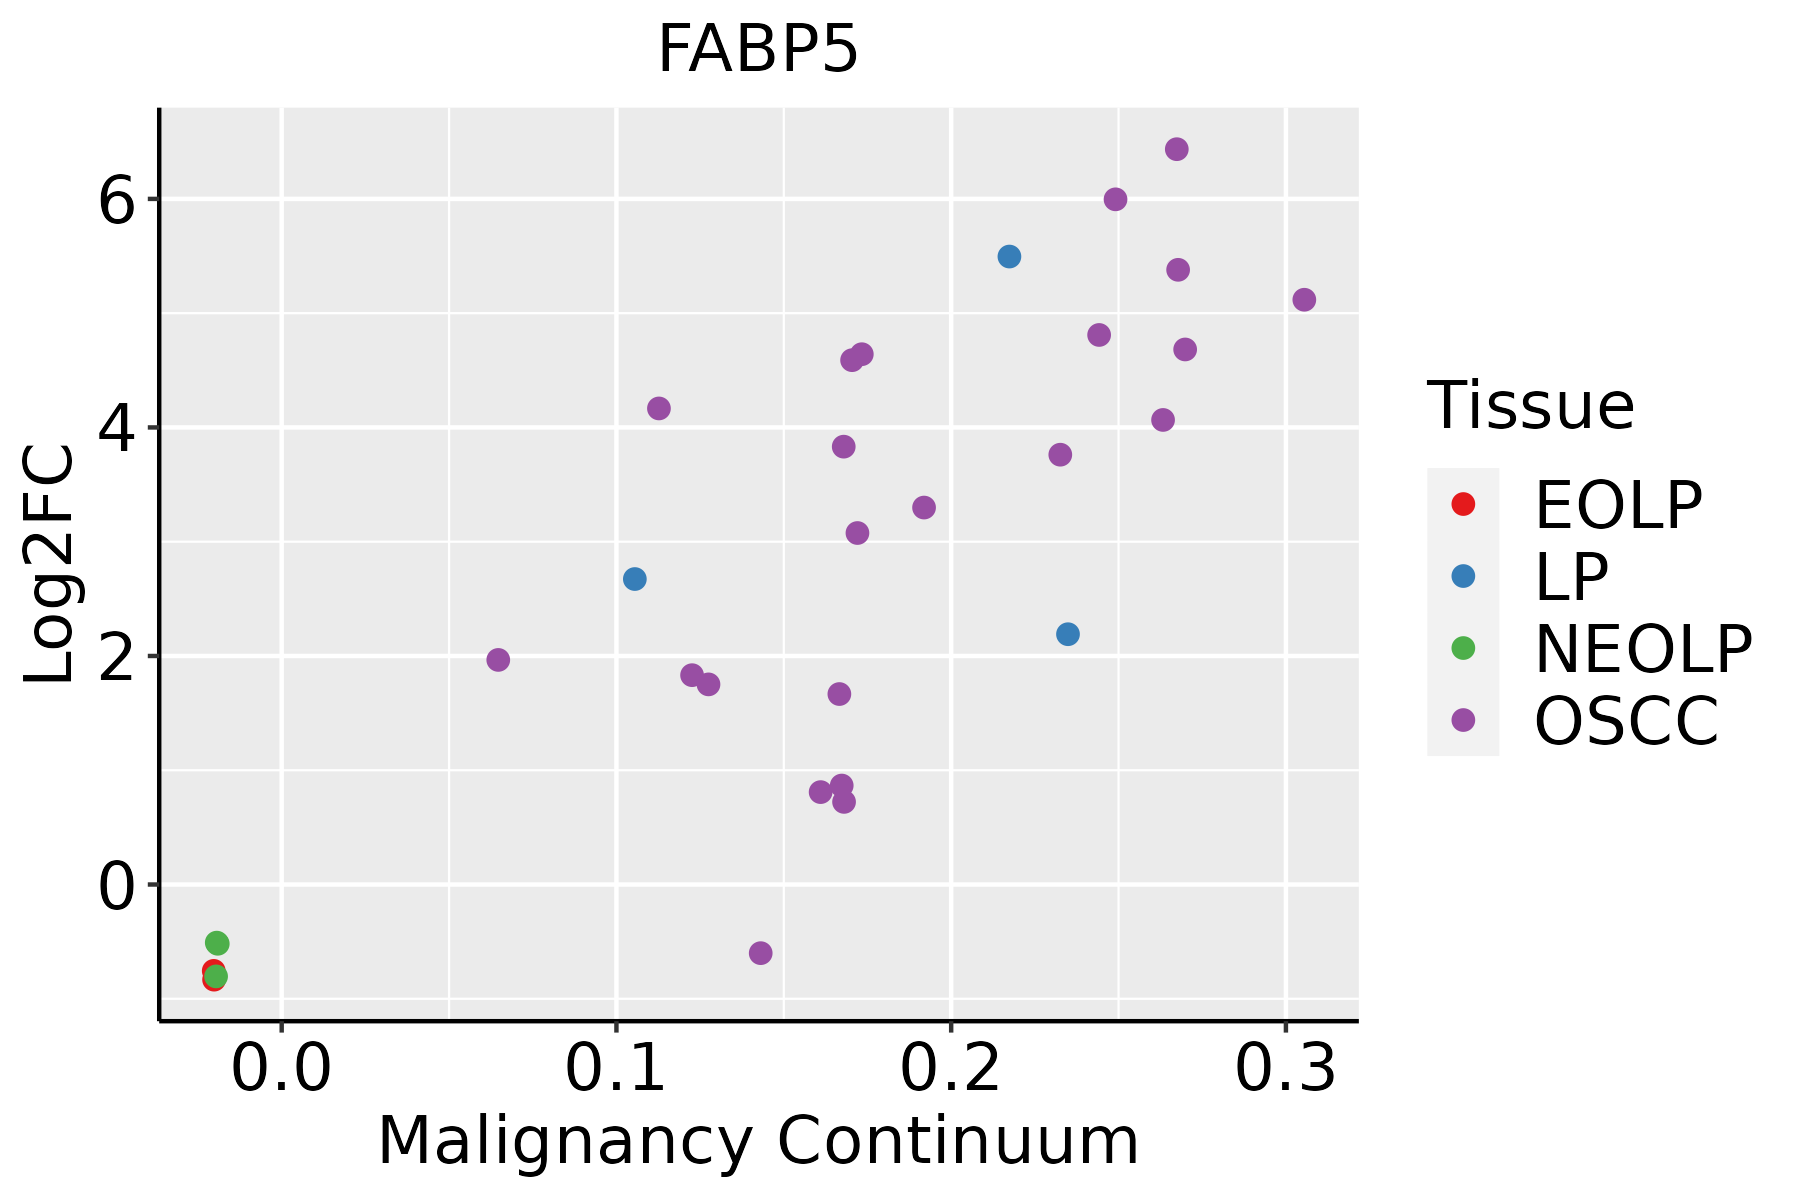 | EOLP: Erosive Oral lichen planus |
| LP: leukoplakia | ||
| NEOLP: Non-erosive oral lichen planus | ||
| OSCC: Oral squamous cell carcinoma | ||
| Prostate |  | BPH: Benign Prostatic Hyperplasia |
| Skin | 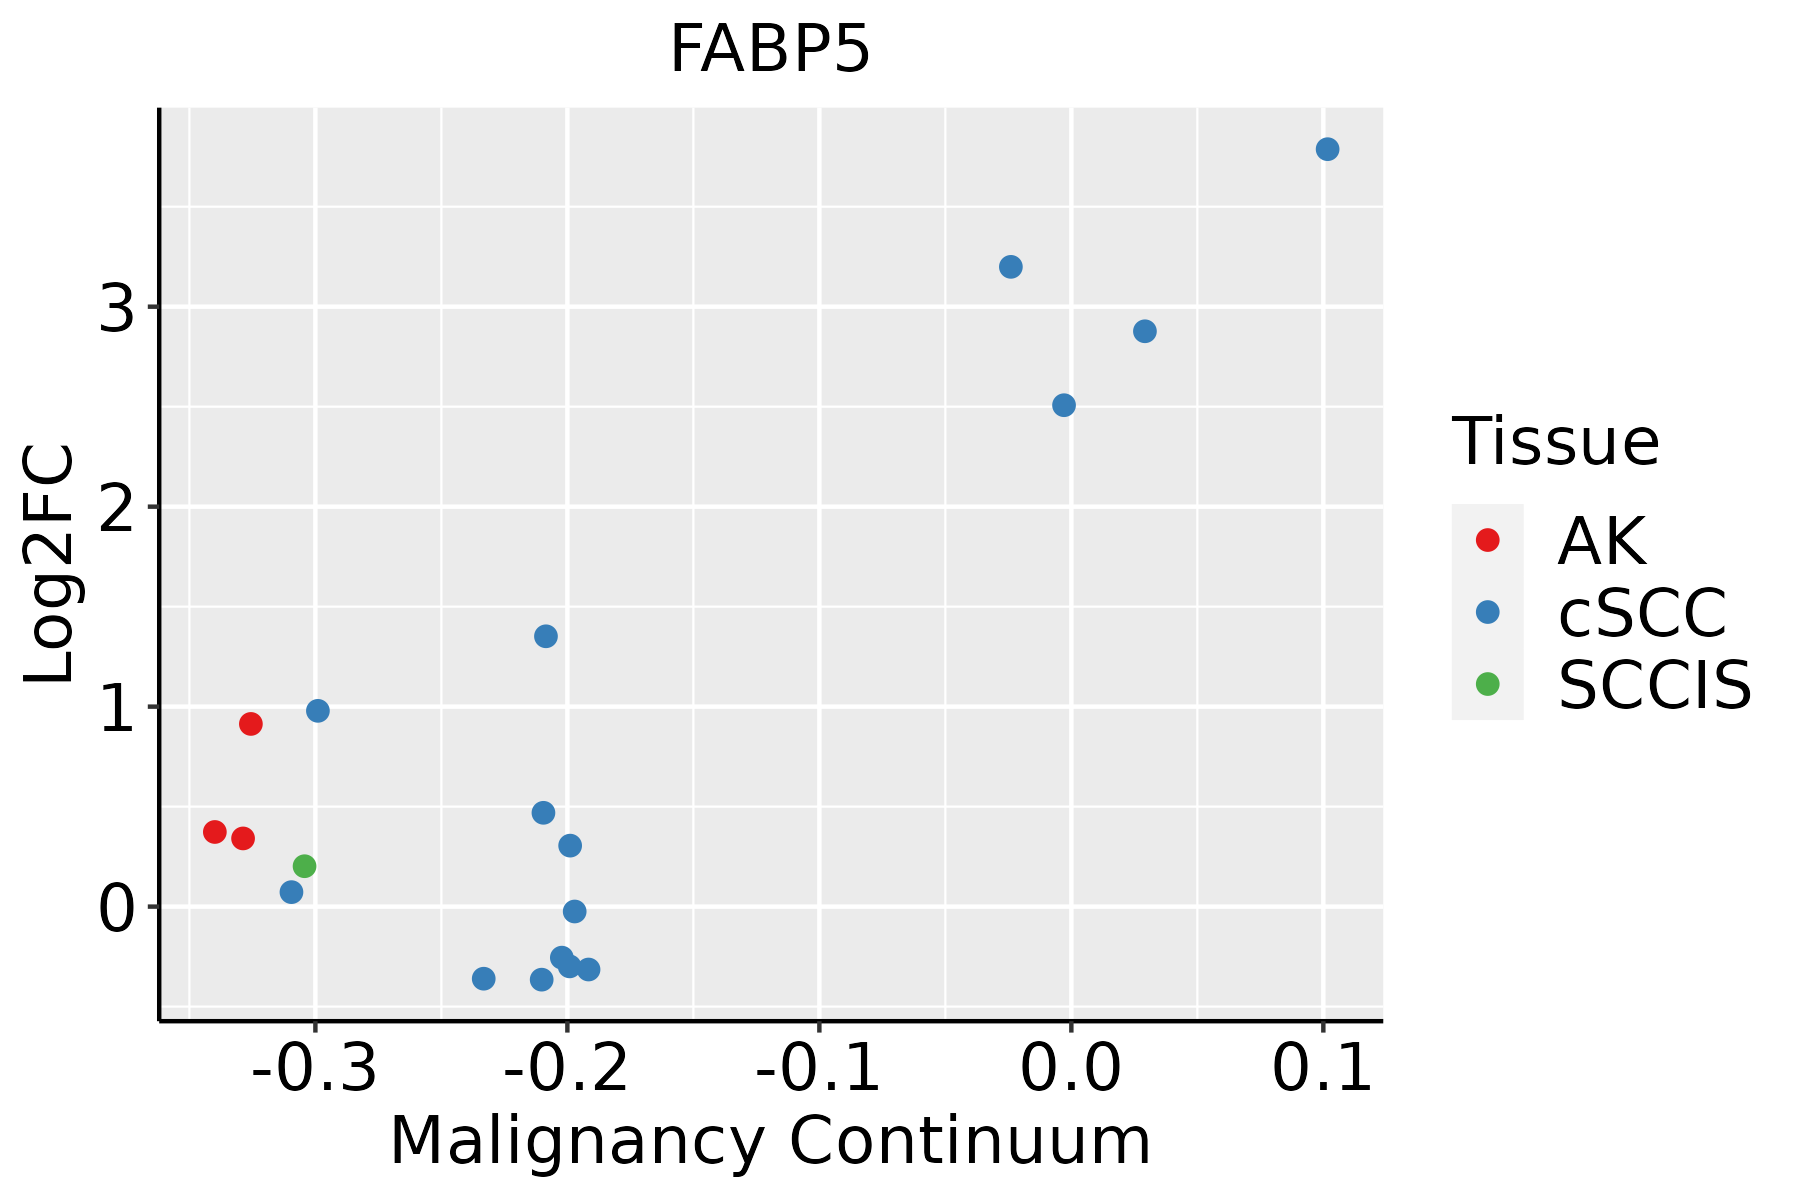 | AK: Actinic keratosis |
| cSCC: Cutaneous squamous cell carcinoma | ||
| SCCIS:squamous cell carcinoma in situ | ||
| Thyroid | 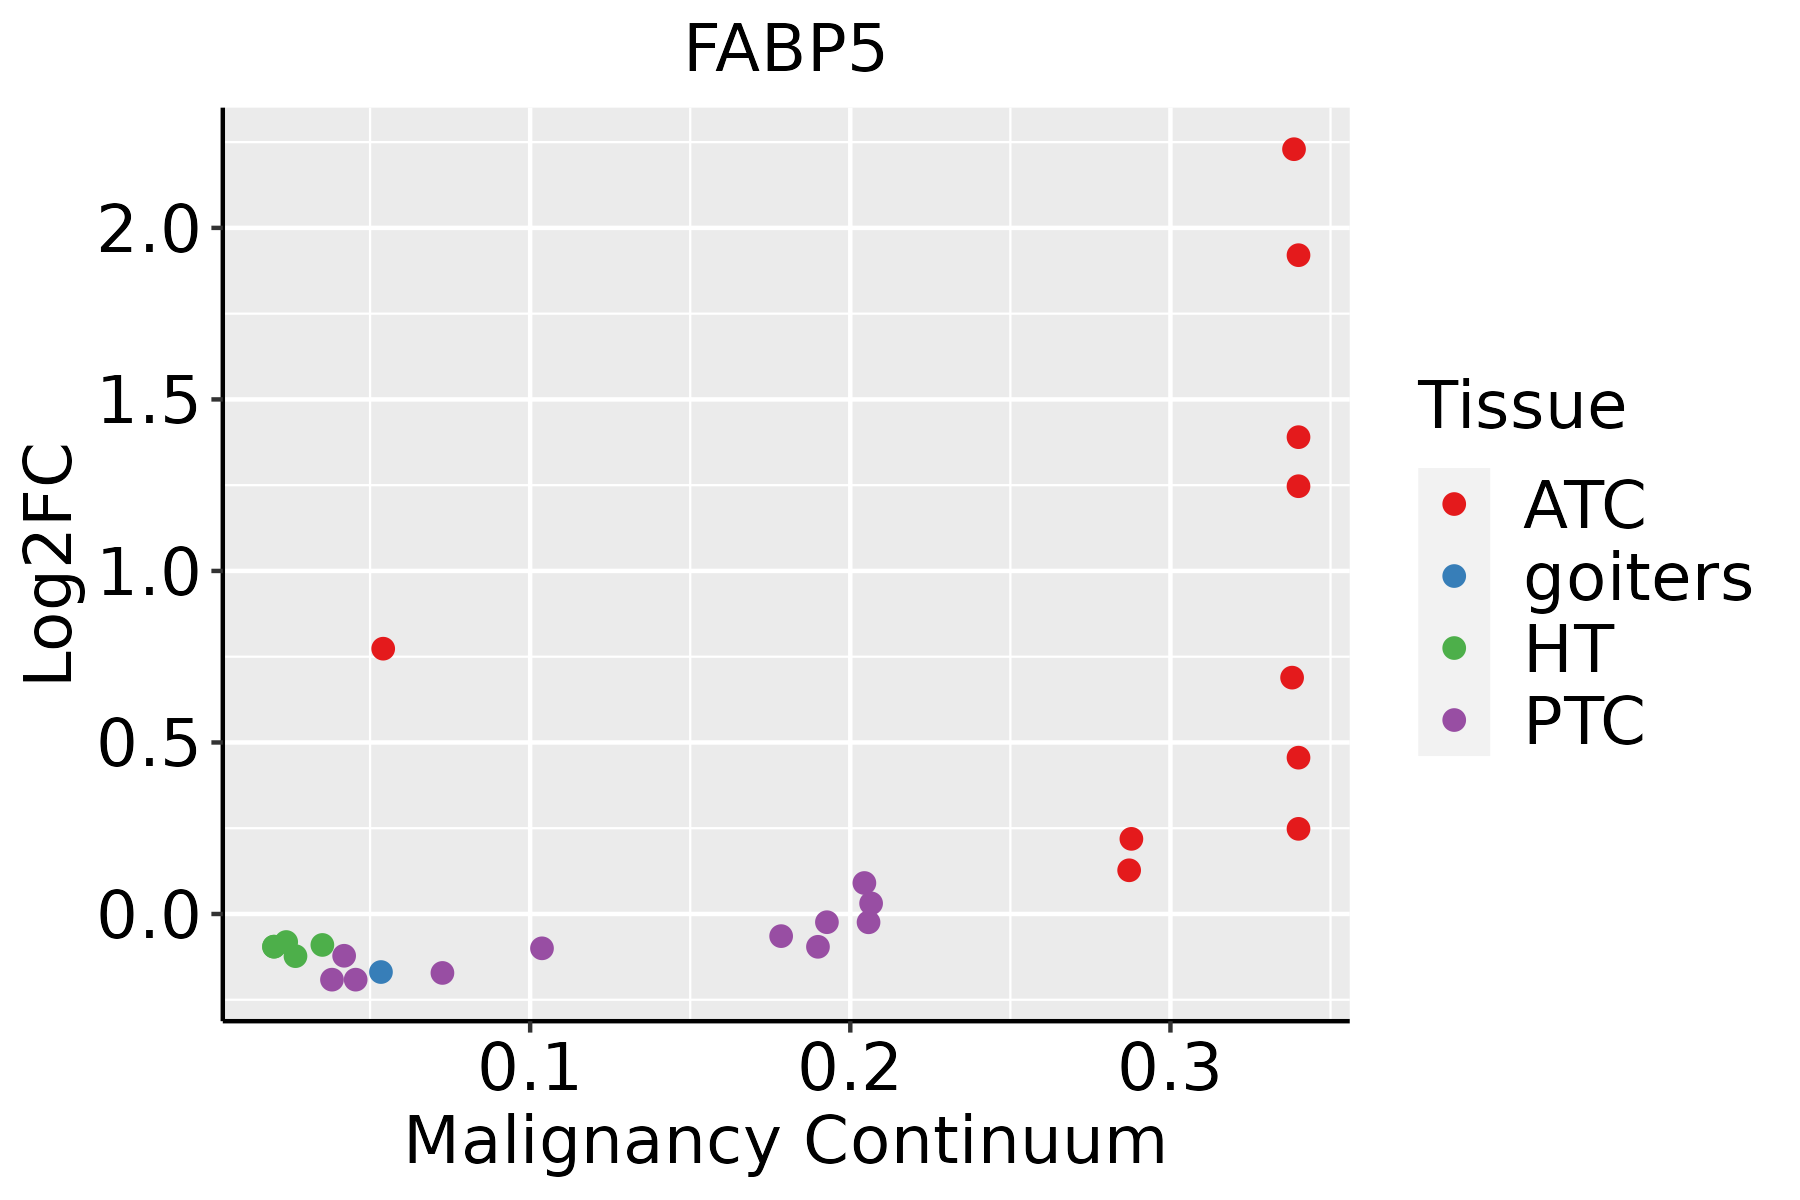 | ATC: Anaplastic thyroid cancer |
| HT: Hashimoto's thyroiditis | ||
| PTC: Papillary thyroid cancer |
| ∗log2FC in expression of this searched gene in stem-like cells from each diseased tissue sample relative to stem-like cells in normal samples in each tissue plotted against the malignancy continuum. Samples are colored based on if they are from different disease stage. |
Top |
Malignant transformation related pathway analysis |
| Find out the enriched GO biological processes and KEGG pathways involved in transition from healthy to precancer to cancer |
| Tissue | Disease Stage | Enriched GO biological Processes |
| Colorectum | AD |  |
| Colorectum | SER |  |
| Colorectum | MSS |  |
| Colorectum | MSI-H |  |
| Colorectum | FAP |  |
| ∗Top 15 enriched GO BP terms are showed in the bar plot of each disease state in each tissue. Each row represents a significant GO biological process which is colored according to the -log10(p.adjust). |
| Page: 1 2 3 4 5 6 7 8 9 |
| GO ID | Tissue | Disease Stage | Description | Gene Ratio | Bg Ratio | pvalue | p.adjust | Count |
| GO:00425938 | Breast | Precancer | glucose homeostasis | 31/1080 | 258/18723 | 8.89e-05 | 1.69e-03 | 31 |
| GO:00335008 | Breast | Precancer | carbohydrate homeostasis | 31/1080 | 259/18723 | 9.56e-05 | 1.79e-03 | 31 |
| GO:00085445 | Breast | Precancer | epidermis development | 35/1080 | 324/18723 | 2.71e-04 | 3.96e-03 | 35 |
| GO:00192164 | Breast | Precancer | regulation of lipid metabolic process | 34/1080 | 331/18723 | 8.14e-04 | 9.55e-03 | 34 |
| GO:00060066 | Breast | Precancer | glucose metabolic process | 23/1080 | 196/18723 | 9.54e-04 | 1.07e-02 | 23 |
| GO:00463946 | Breast | Precancer | carboxylic acid biosynthetic process | 32/1080 | 314/18723 | 1.30e-03 | 1.38e-02 | 32 |
| GO:00723304 | Breast | Precancer | monocarboxylic acid biosynthetic process | 24/1080 | 214/18723 | 1.41e-03 | 1.48e-02 | 24 |
| GO:00160536 | Breast | Precancer | organic acid biosynthetic process | 32/1080 | 316/18723 | 1.44e-03 | 1.50e-02 | 32 |
| GO:00059966 | Breast | Precancer | monosaccharide metabolic process | 27/1080 | 257/18723 | 1.94e-03 | 1.88e-02 | 27 |
| GO:00193186 | Breast | Precancer | hexose metabolic process | 25/1080 | 237/18723 | 2.64e-03 | 2.36e-02 | 25 |
| GO:00066335 | Breast | Precancer | fatty acid biosynthetic process | 19/1080 | 163/18723 | 2.74e-03 | 2.42e-02 | 19 |
| GO:00305228 | Breast | Precancer | intracellular receptor signaling pathway | 27/1080 | 265/18723 | 2.99e-03 | 2.57e-02 | 27 |
| GO:00620126 | Breast | Precancer | regulation of small molecule metabolic process | 32/1080 | 334/18723 | 3.45e-03 | 2.87e-02 | 32 |
| GO:00423044 | Breast | Precancer | regulation of fatty acid biosynthetic process | 8/1080 | 49/18723 | 6.53e-03 | 4.51e-02 | 8 |
| GO:001921612 | Breast | IDC | regulation of lipid metabolic process | 45/1434 | 331/18723 | 1.21e-04 | 2.24e-03 | 45 |
| GO:003052214 | Breast | IDC | intracellular receptor signaling pathway | 37/1434 | 265/18723 | 2.77e-04 | 4.26e-03 | 37 |
| GO:00468904 | Breast | IDC | regulation of lipid biosynthetic process | 26/1434 | 171/18723 | 5.92e-04 | 7.50e-03 | 26 |
| GO:000854412 | Breast | IDC | epidermis development | 41/1434 | 324/18723 | 1.03e-03 | 1.14e-02 | 41 |
| GO:004259313 | Breast | IDC | glucose homeostasis | 34/1434 | 258/18723 | 1.34e-03 | 1.39e-02 | 34 |
| GO:003350013 | Breast | IDC | carbohydrate homeostasis | 34/1434 | 259/18723 | 1.43e-03 | 1.46e-02 | 34 |
| Page: 1 2 3 4 5 6 7 8 9 10 11 12 13 14 15 16 17 |
| Pathway ID | Tissue | Disease Stage | Description | Gene Ratio | Bg Ratio | pvalue | p.adjust | qvalue | Count |
| hsa0332021 | Liver | Cirrhotic | PPAR signaling pathway | 32/2530 | 75/8465 | 1.24e-02 | 3.92e-02 | 2.42e-02 | 32 |
| hsa0332031 | Liver | Cirrhotic | PPAR signaling pathway | 32/2530 | 75/8465 | 1.24e-02 | 3.92e-02 | 2.42e-02 | 32 |
| hsa033204 | Liver | HCC | PPAR signaling pathway | 48/4020 | 75/8465 | 2.83e-03 | 9.37e-03 | 5.21e-03 | 48 |
| hsa033205 | Liver | HCC | PPAR signaling pathway | 48/4020 | 75/8465 | 2.83e-03 | 9.37e-03 | 5.21e-03 | 48 |
| hsa03320 | Stomach | GC | PPAR signaling pathway | 18/708 | 75/8465 | 3.26e-05 | 4.01e-04 | 2.82e-04 | 18 |
| hsa033201 | Stomach | GC | PPAR signaling pathway | 18/708 | 75/8465 | 3.26e-05 | 4.01e-04 | 2.82e-04 | 18 |
| hsa033202 | Stomach | SIM | PPAR signaling pathway | 15/465 | 75/8465 | 1.08e-05 | 1.42e-04 | 1.14e-04 | 15 |
| hsa033203 | Stomach | SIM | PPAR signaling pathway | 15/465 | 75/8465 | 1.08e-05 | 1.42e-04 | 1.14e-04 | 15 |
| Page: 1 |
Top |
Cell-cell communication analysis |
| Identification of potential cell-cell interactions between two cell types and their ligand-receptor pairs for different disease states |
| Ligand | Receptor | LRpair | Pathway | Tissue | Disease Stage |
| Page: 1 |
Top |
Single-cell gene regulatory network inference analysis |
| Find out the significant the regulons (TFs) and the target genes of each regulon across cell types for different disease states |
| TF | Cell Type | Tissue | Disease Stage | Target Gene | RSS | Regulon Activity |
| ∗The dot plots of a searched regulon are shown for all cell subpopulations in each disease state of each tissue based on the regulon specific score inferred using pySCENIC and by calculating the average expression. |
| Page: 1 |
Top |
Somatic mutation of malignant transformation related genes |
| Annotation of somatic variants for genes involved in malignant transformation |
| Hugo Symbol | Variant Class | Variant Classification | dbSNP RS | HGVSc | HGVSp | HGVSp Short | SWISSPROT | BIOTYPE | SIFT | PolyPhen | Tumor Sample Barcode | Tissue | Histology | Sex | Age | Stage | Therapy Types | Drugs | Outcome |
| FABP5 | deletion | Frame_Shift_Del | novel | c.47delG | p.Ser16ThrfsTer8 | p.S16Tfs*8 | Q01469 | protein_coding | TCGA-EW-A2FV-01 | Breast | breast invasive carcinoma | Female | <65 | III/IV | Chemotherapy | docetaxel | SD | ||
| FABP5 | SNV | Missense_Mutation | novel | c.4N>A | p.Ala2Thr | p.A2T | Q01469 | protein_coding | deleterious_low_confidence(0.05) | benign(0.309) | TCGA-AA-3949-01 | Colorectum | colon adenocarcinoma | Female | >=65 | III/IV | Unknown | Unknown | SD |
| FABP5 | SNV | Missense_Mutation | novel | c.165N>C | p.Lys55Asn | p.K55N | Q01469 | protein_coding | deleterious(0.02) | benign(0.345) | TCGA-CA-6717-01 | Colorectum | colon adenocarcinoma | Male | <65 | I/II | Chemotherapy | oxaliplatin | CR |
| FABP5 | SNV | Missense_Mutation | novel | c.312N>C | p.Glu104Asp | p.E104D | Q01469 | protein_coding | deleterious(0.02) | possibly_damaging(0.84) | TCGA-F5-6814-01 | Colorectum | rectum adenocarcinoma | Male | <65 | I/II | Unknown | Unknown | SD |
| FABP5 | SNV | Missense_Mutation | c.346N>A | p.Leu116Ile | p.L116I | Q01469 | protein_coding | deleterious(0.01) | possibly_damaging(0.712) | TCGA-AP-A0LT-01 | Endometrium | uterine corpus endometrioid carcinoma | Female | <65 | I/II | Unknown | Unknown | SD | |
| FABP5 | SNV | Missense_Mutation | rs763394711 | c.263A>G | p.Asn88Ser | p.N88S | Q01469 | protein_coding | tolerated(0.17) | benign(0.001) | TCGA-B5-A0JY-01 | Endometrium | uterine corpus endometrioid carcinoma | Female | <65 | III/IV | Chemotherapy | doxorubicin | SD |
| FABP5 | SNV | Missense_Mutation | novel | c.4G>A | p.Ala2Thr | p.A2T | Q01469 | protein_coding | deleterious_low_confidence(0.05) | benign(0.309) | TCGA-B5-A3FC-01 | Endometrium | uterine corpus endometrioid carcinoma | Female | <65 | I/II | Unknown | Unknown | SD |
| FABP5 | SNV | Missense_Mutation | rs201701039 | c.386G>A | p.Arg129Gln | p.R129Q | Q01469 | protein_coding | deleterious(0.03) | benign(0.345) | TCGA-B5-A3FC-01 | Endometrium | uterine corpus endometrioid carcinoma | Female | <65 | I/II | Unknown | Unknown | SD |
| FABP5 | SNV | Missense_Mutation | novel | c.152N>T | p.Asn51Ile | p.N51I | Q01469 | protein_coding | tolerated(0.41) | benign(0.346) | TCGA-39-5034-01 | Lung | lung squamous cell carcinoma | Female | >=65 | I/II | Unknown | Unknown | PD |
| FABP5 | SNV | Missense_Mutation | rs757111208 | c.314N>T | p.Ser105Ile | p.S105I | Q01469 | protein_coding | deleterious(0.04) | probably_damaging(0.987) | TCGA-60-2723-01 | Lung | lung squamous cell carcinoma | Female | >=65 | I/II | Unknown | Unknown | SD |
| Page: 1 2 |
Top |
Related drugs of malignant transformation related genes |
| Identification of chemicals and drugs interact with genes involved in malignant transfromation |
| (DGIdb 4.0) |
| Entrez ID | Symbol | Category | Interaction Types | Drug Claim Name | Drug Name | PMIDs |
| 2171 | FABP5 | NUCLEAR HORMONE RECEPTOR | PMID27109571-Compound-30 | |||
| 2171 | FABP5 | NUCLEAR HORMONE RECEPTOR | PMID27109571-Compound-12 | |||
| 2171 | FABP5 | NUCLEAR HORMONE RECEPTOR | PMID27109571-Compound-29 | |||
| 2171 | FABP5 | NUCLEAR HORMONE RECEPTOR | PMID27109571-Compound-20 | |||
| 2171 | FABP5 | NUCLEAR HORMONE RECEPTOR | PMID27109571-Compound-17 | |||
| 2171 | FABP5 | NUCLEAR HORMONE RECEPTOR | PMID27109571-Compound-27 | |||
| 2171 | FABP5 | NUCLEAR HORMONE RECEPTOR | PMID27109571-Compound-16 | |||
| 2171 | FABP5 | NUCLEAR HORMONE RECEPTOR | PMID27109571-Compound-26 | |||
| 2171 | FABP5 | NUCLEAR HORMONE RECEPTOR | PMID27109571-Compound-28 | |||
| 2171 | FABP5 | NUCLEAR HORMONE RECEPTOR | PMID27109571-Compound-23 |
| Page: 1 2 3 |

Copyright 2023-Present -The University of Texas Health Science Center at Houston |