
|
|||||
|
 | |
| |
| |
| |
| |
| |
|
Gene: FABP3 |
Gene summary for FABP3 |
| Gene information | Species | Human | Gene symbol | FABP3 | Gene ID | 2170 |
| Gene name | fatty acid binding protein 3 | |
| Gene Alias | FABP11 | |
| Cytomap | 1p35.2 | |
| Gene Type | protein-coding | GO ID | GO:0006082 | UniProtAcc | P05413 |
Top |
Malignant transformation analysis |
| Identification of the aberrant gene expression in precancerous and cancerous lesions by comparing the gene expression of stem-like cells in diseased tissues with normal stem cells |
| Entrez ID | Symbol | Replicates | Species | Organ | Tissue | Adj P-value | Log2FC | Malignancy |
| 2170 | FABP3 | P74T-E | Human | Esophagus | ESCC | 1.01e-09 | 6.65e-01 | 0.1479 |
| 2170 | FABP3 | P79T-E | Human | Esophagus | ESCC | 4.05e-32 | 6.59e-01 | 0.1154 |
| 2170 | FABP3 | P130T-E | Human | Esophagus | ESCC | 3.14e-34 | 9.25e-01 | 0.1676 |
| 2170 | FABP3 | S027 | Human | Liver | HCC | 2.14e-11 | 7.21e-01 | 0.2446 |
| 2170 | FABP3 | S028 | Human | Liver | HCC | 2.09e-20 | 1.18e+00 | 0.2503 |
| 2170 | FABP3 | S029 | Human | Liver | HCC | 1.54e-44 | 2.09e+00 | 0.2581 |
| 2170 | FABP3 | ATC13 | Human | Thyroid | ATC | 6.99e-29 | 7.10e-01 | 0.34 |
| 2170 | FABP3 | ATC5 | Human | Thyroid | ATC | 2.27e-29 | 7.61e-01 | 0.34 |
| Page: 1 |
| Tissue | Expression Dynamics | Abbreviation |
| Esophagus |  | ESCC: Esophageal squamous cell carcinoma |
| HGIN: High-grade intraepithelial neoplasias | ||
| LGIN: Low-grade intraepithelial neoplasias | ||
| Liver | 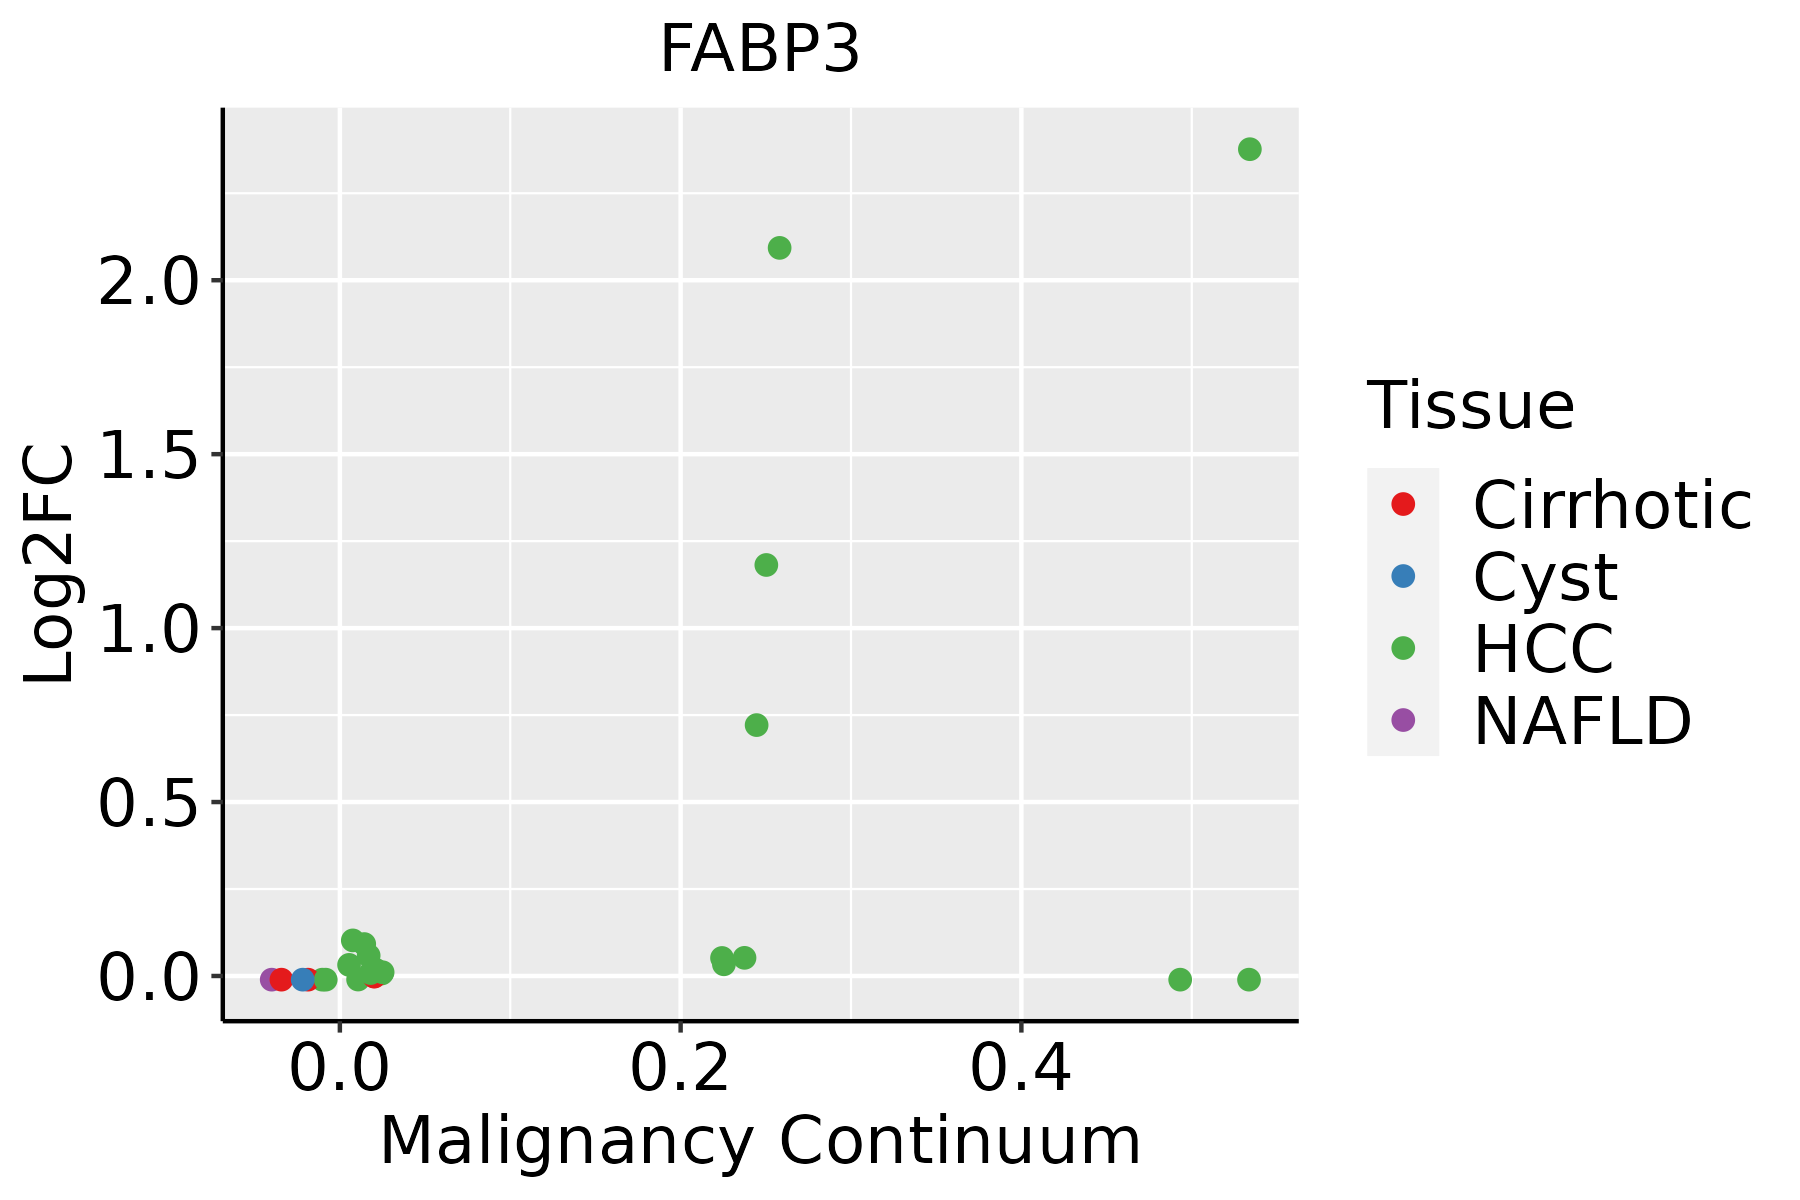 | HCC: Hepatocellular carcinoma |
| NAFLD: Non-alcoholic fatty liver disease | ||
| Thyroid |  | ATC: Anaplastic thyroid cancer |
| HT: Hashimoto's thyroiditis | ||
| PTC: Papillary thyroid cancer |
| ∗log2FC in expression of this searched gene in stem-like cells from each diseased tissue sample relative to stem-like cells in normal samples in each tissue plotted against the malignancy continuum. Samples are colored based on if they are from different disease stage. |
Top |
Malignant transformation related pathway analysis |
| Find out the enriched GO biological processes and KEGG pathways involved in transition from healthy to precancer to cancer |
| Tissue | Disease Stage | Enriched GO biological Processes |
| Colorectum | AD |  |
| Colorectum | SER |  |
| Colorectum | MSS |  |
| Colorectum | MSI-H |  |
| Colorectum | FAP |  |
| ∗Top 15 enriched GO BP terms are showed in the bar plot of each disease state in each tissue. Each row represents a significant GO biological process which is colored according to the -log10(p.adjust). |
| Page: 1 2 3 4 5 6 7 8 9 |
| GO ID | Tissue | Disease Stage | Description | Gene Ratio | Bg Ratio | pvalue | p.adjust | Count |
| GO:00086544 | Esophagus | ESCC | phospholipid biosynthetic process | 162/8552 | 253/18723 | 2.59e-09 | 5.73e-08 | 162 |
| GO:00464744 | Esophagus | ESCC | glycerophospholipid biosynthetic process | 135/8552 | 211/18723 | 5.75e-08 | 1.02e-06 | 135 |
| GO:00450175 | Esophagus | ESCC | glycerolipid biosynthetic process | 154/8552 | 252/18723 | 5.20e-07 | 6.96e-06 | 154 |
| GO:0043434111 | Esophagus | ESCC | response to peptide hormone | 234/8552 | 414/18723 | 4.93e-06 | 5.21e-05 | 234 |
| GO:00066446 | Esophagus | ESCC | phospholipid metabolic process | 218/8552 | 383/18723 | 5.37e-06 | 5.59e-05 | 218 |
| GO:003286818 | Esophagus | ESCC | response to insulin | 156/8552 | 264/18723 | 7.21e-06 | 7.20e-05 | 156 |
| GO:00193958 | Esophagus | ESCC | fatty acid oxidation | 69/8552 | 103/18723 | 9.95e-06 | 9.44e-05 | 69 |
| GO:00344407 | Esophagus | ESCC | lipid oxidation | 71/8552 | 108/18723 | 2.00e-05 | 1.74e-04 | 71 |
| GO:00454449 | Esophagus | ESCC | fat cell differentiation | 135/8552 | 229/18723 | 3.38e-05 | 2.78e-04 | 135 |
| GO:00066318 | Esophagus | ESCC | fatty acid metabolic process | 217/8552 | 390/18723 | 4.21e-05 | 3.39e-04 | 217 |
| GO:00066561 | Esophagus | ESCC | phosphatidylcholine biosynthetic process | 24/8552 | 29/18723 | 4.50e-05 | 3.55e-04 | 24 |
| GO:000941020 | Esophagus | ESCC | response to xenobiotic stimulus | 253/8552 | 462/18723 | 4.55e-05 | 3.58e-04 | 253 |
| GO:00066505 | Esophagus | ESCC | glycerophospholipid metabolic process | 174/8552 | 306/18723 | 4.92e-05 | 3.85e-04 | 174 |
| GO:00620129 | Esophagus | ESCC | regulation of small molecule metabolic process | 184/8552 | 334/18723 | 3.11e-04 | 1.85e-03 | 184 |
| GO:00464864 | Esophagus | ESCC | glycerolipid metabolic process | 211/8552 | 392/18723 | 6.51e-04 | 3.46e-03 | 211 |
| GO:00421805 | Esophagus | ESCC | cellular ketone metabolic process | 120/8552 | 211/18723 | 6.70e-04 | 3.55e-03 | 120 |
| GO:00302586 | Esophagus | ESCC | lipid modification | 116/8552 | 212/18723 | 4.90e-03 | 1.89e-02 | 116 |
| GO:01501724 | Esophagus | ESCC | regulation of phosphatidylcholine metabolic process | 9/8552 | 10/18723 | 5.09e-03 | 1.92e-02 | 9 |
| GO:00445391 | Esophagus | ESCC | long-chain fatty acid import into cell | 13/8552 | 17/18723 | 1.00e-02 | 3.42e-02 | 13 |
| GO:01403541 | Esophagus | ESCC | lipid import into cell | 13/8552 | 17/18723 | 1.00e-02 | 3.42e-02 | 13 |
| Page: 1 2 3 |
| Pathway ID | Tissue | Disease Stage | Description | Gene Ratio | Bg Ratio | pvalue | p.adjust | qvalue | Count |
| Page: 1 |
Top |
Cell-cell communication analysis |
| Identification of potential cell-cell interactions between two cell types and their ligand-receptor pairs for different disease states |
| Ligand | Receptor | LRpair | Pathway | Tissue | Disease Stage |
| Page: 1 |
Top |
Single-cell gene regulatory network inference analysis |
| Find out the significant the regulons (TFs) and the target genes of each regulon across cell types for different disease states |
| TF | Cell Type | Tissue | Disease Stage | Target Gene | RSS | Regulon Activity |
| ∗The dot plots of a searched regulon are shown for all cell subpopulations in each disease state of each tissue based on the regulon specific score inferred using pySCENIC and by calculating the average expression. |
| Page: 1 |
Top |
Somatic mutation of malignant transformation related genes |
| Annotation of somatic variants for genes involved in malignant transformation |
| Hugo Symbol | Variant Class | Variant Classification | dbSNP RS | HGVSc | HGVSp | HGVSp Short | SWISSPROT | BIOTYPE | SIFT | PolyPhen | Tumor Sample Barcode | Tissue | Histology | Sex | Age | Stage | Therapy Types | Drugs | Outcome |
| FABP3 | insertion | Nonsense_Mutation | novel | c.221_222insTTAAGG | p.Thr74_Thr75insTer | p.T74_T75ins* | P05413 | protein_coding | TCGA-AQ-A04J-01 | Breast | breast invasive carcinoma | Female | <65 | I/II | Chemotherapy | cytoxan | SD | ||
| FABP3 | insertion | Frame_Shift_Ins | novel | c.219_220insCCTCAGCCTTCCAGGCCAGGCATGGGAGCGAGAGA | p.Thr74ProfsTer24 | p.T74Pfs*24 | P05413 | protein_coding | TCGA-AQ-A04J-01 | Breast | breast invasive carcinoma | Female | <65 | I/II | Chemotherapy | cytoxan | SD | ||
| FABP3 | deletion | Frame_Shift_Del | novel | c.373delT | p.Cys125AlafsTer78 | p.C125Afs*78 | P05413 | protein_coding | TCGA-D8-A27V-01 | Breast | breast invasive carcinoma | Female | <65 | I/II | Hormone Therapy | tamoxiphen | SD | ||
| FABP3 | SNV | Missense_Mutation | novel | c.189C>G | p.Ile63Met | p.I63M | P05413 | protein_coding | deleterious(0.02) | possibly_damaging(0.902) | TCGA-C5-A902-01 | Cervix | cervical & endocervical cancer | Female | <65 | I/II | Chemotherapy | cisplatin | SD |
| FABP3 | SNV | Missense_Mutation | c.280C>T | p.His94Tyr | p.H94Y | P05413 | protein_coding | deleterious(0) | benign(0.389) | TCGA-Q1-A73O-01 | Cervix | cervical & endocervical cancer | Female | <65 | I/II | Chemotherapy | cisplatin | CR | |
| FABP3 | SNV | Missense_Mutation | rs757091758 | c.130N>A | p.Glu44Lys | p.E44K | P05413 | protein_coding | tolerated(0.07) | benign(0.006) | TCGA-CA-6718-01 | Colorectum | colon adenocarcinoma | Male | <65 | I/II | Unknown | Unknown | PD |
| FABP3 | SNV | Missense_Mutation | novel | c.350C>T | p.Thr117Ile | p.T117I | P05413 | protein_coding | tolerated(0.07) | benign(0.354) | TCGA-AX-A2HD-01 | Endometrium | uterine corpus endometrioid carcinoma | Female | >=65 | III/IV | Unknown | Unknown | SD |
| FABP3 | SNV | Missense_Mutation | rs754575117 | c.10G>A | p.Ala4Thr | p.A4T | P05413 | protein_coding | tolerated(0.18) | benign(0.003) | TCGA-B5-A11E-01 | Endometrium | uterine corpus endometrioid carcinoma | Female | <65 | I/II | Unknown | Unknown | SD |
| FABP3 | SNV | Missense_Mutation | novel | c.272A>C | p.Lys91Thr | p.K91T | P05413 | protein_coding | tolerated(0.12) | possibly_damaging(0.555) | TCGA-FI-A2D5-01 | Endometrium | uterine corpus endometrioid carcinoma | Female | <65 | III/IV | Chemotherapy | carboplatinum | PD |
| FABP3 | SNV | Missense_Mutation | c.5N>C | p.Val2Ala | p.V2A | P05413 | protein_coding | tolerated(0.23) | benign(0.02) | TCGA-55-A491-01 | Lung | lung adenocarcinoma | Female | >=65 | I/II | Unknown | Unknown | SD |
| Page: 1 2 |
Top |
Related drugs of malignant transformation related genes |
| Identification of chemicals and drugs interact with genes involved in malignant transfromation |
| (DGIdb 4.0) |
| Entrez ID | Symbol | Category | Interaction Types | Drug Claim Name | Drug Name | PMIDs |
| 2170 | FABP3 | NA | inhibitor | 252827455 |
| Page: 1 |

Copyright 2023-Present -The University of Texas Health Science Center at Houston |