
|
|||||
|
 | |
| |
| |
| |
| |
| |
|
Gene: FABP1 |
Gene summary for FABP1 |
| Gene information | Species | Human | Gene symbol | FABP1 | Gene ID | 2168 |
| Gene name | fatty acid binding protein 1 | |
| Gene Alias | FABPL | |
| Cytomap | 2p11.2 | |
| Gene Type | protein-coding | GO ID | GO:0000302 | UniProtAcc | P07148 |
Top |
Malignant transformation analysis |
| Identification of the aberrant gene expression in precancerous and cancerous lesions by comparing the gene expression of stem-like cells in diseased tissues with normal stem cells |
| Entrez ID | Symbol | Replicates | Species | Organ | Tissue | Adj P-value | Log2FC | Malignancy |
| 2168 | FABP1 | HTA11_3410_2000001011 | Human | Colorectum | AD | 3.25e-09 | -4.78e-01 | 0.0155 |
| 2168 | FABP1 | HTA11_2487_2000001011 | Human | Colorectum | SER | 7.86e-37 | 3.98e+00 | -0.1808 |
| 2168 | FABP1 | HTA11_1938_2000001011 | Human | Colorectum | AD | 2.14e-21 | 2.47e+00 | -0.0811 |
| 2168 | FABP1 | HTA11_78_2000001011 | Human | Colorectum | AD | 1.22e-04 | 1.81e+00 | -0.1088 |
| 2168 | FABP1 | HTA11_347_2000001011 | Human | Colorectum | AD | 5.27e-55 | 3.81e+00 | -0.1954 |
| 2168 | FABP1 | HTA11_411_2000001011 | Human | Colorectum | SER | 1.06e-05 | 3.75e+00 | -0.2602 |
| 2168 | FABP1 | HTA11_2112_2000001011 | Human | Colorectum | SER | 1.52e-18 | 4.61e+00 | -0.2196 |
| 2168 | FABP1 | HTA11_3361_2000001011 | Human | Colorectum | AD | 7.58e-35 | 3.47e+00 | -0.1207 |
| 2168 | FABP1 | HTA11_83_2000001011 | Human | Colorectum | SER | 7.74e-29 | 4.07e+00 | -0.1526 |
| 2168 | FABP1 | HTA11_696_2000001011 | Human | Colorectum | AD | 1.17e-44 | 3.71e+00 | -0.1464 |
| 2168 | FABP1 | HTA11_866_2000001011 | Human | Colorectum | AD | 5.52e-18 | 2.50e+00 | -0.1001 |
| 2168 | FABP1 | HTA11_1391_2000001011 | Human | Colorectum | AD | 2.59e-23 | 3.26e+00 | -0.059 |
| 2168 | FABP1 | HTA11_2992_2000001011 | Human | Colorectum | SER | 1.46e-11 | 3.53e+00 | -0.1706 |
| 2168 | FABP1 | HTA11_5212_2000001011 | Human | Colorectum | AD | 8.36e-24 | 4.06e+00 | -0.2061 |
| 2168 | FABP1 | HTA11_5216_2000001011 | Human | Colorectum | SER | 1.29e-15 | 4.38e+00 | -0.1462 |
| 2168 | FABP1 | HTA11_546_2000001011 | Human | Colorectum | AD | 9.76e-04 | 1.60e+00 | -0.0842 |
| 2168 | FABP1 | HTA11_9341_2000001011 | Human | Colorectum | SER | 1.25e-06 | 1.29e+00 | -0.00410000000000005 |
| 2168 | FABP1 | HTA11_7862_2000001011 | Human | Colorectum | AD | 5.73e-11 | 1.69e+00 | -0.0179 |
| 2168 | FABP1 | HTA11_866_3004761011 | Human | Colorectum | AD | 1.32e-10 | -5.56e-01 | 0.096 |
| 2168 | FABP1 | HTA11_7663_2000001011 | Human | Colorectum | SER | 3.29e-06 | 1.31e+00 | 0.0131 |
| Page: 1 2 3 4 5 |
| Tissue | Expression Dynamics | Abbreviation |
| Colorectum (GSE201348) |  | FAP: Familial adenomatous polyposis |
| CRC: Colorectal cancer | ||
| Colorectum (HTA11) |  | AD: Adenomas |
| SER: Sessile serrated lesions | ||
| MSI-H: Microsatellite-high colorectal cancer | ||
| MSS: Microsatellite stable colorectal cancer | ||
| GC | 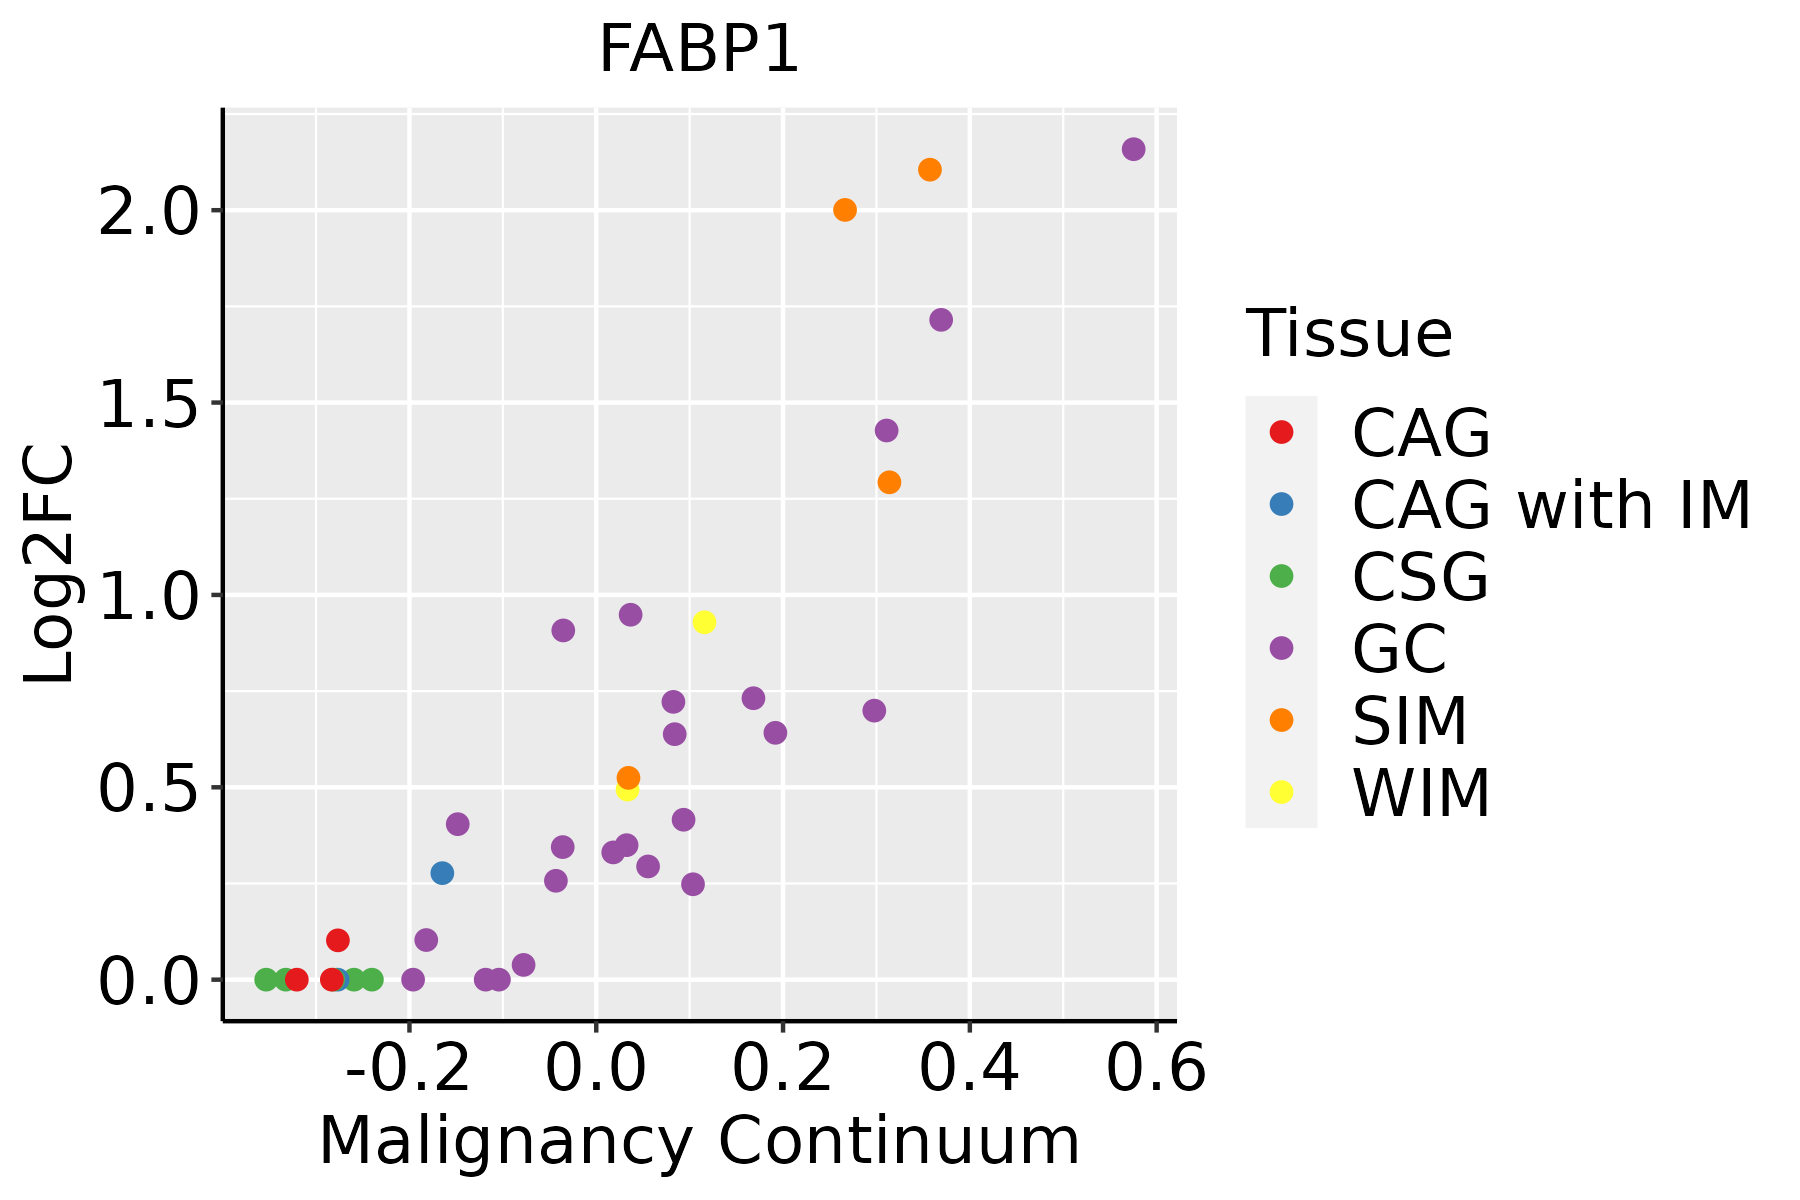 | CAG: Chronic atrophic gastritis |
| CAG with IM: Chronic atrophic gastritis with intestinal metaplasia | ||
| CSG: Chronic superficial gastritis | ||
| GC: Gastric cancer | ||
| SIM: Severe intestinal metaplasia | ||
| WIM: Wild intestinal metaplasia | ||
| Liver | 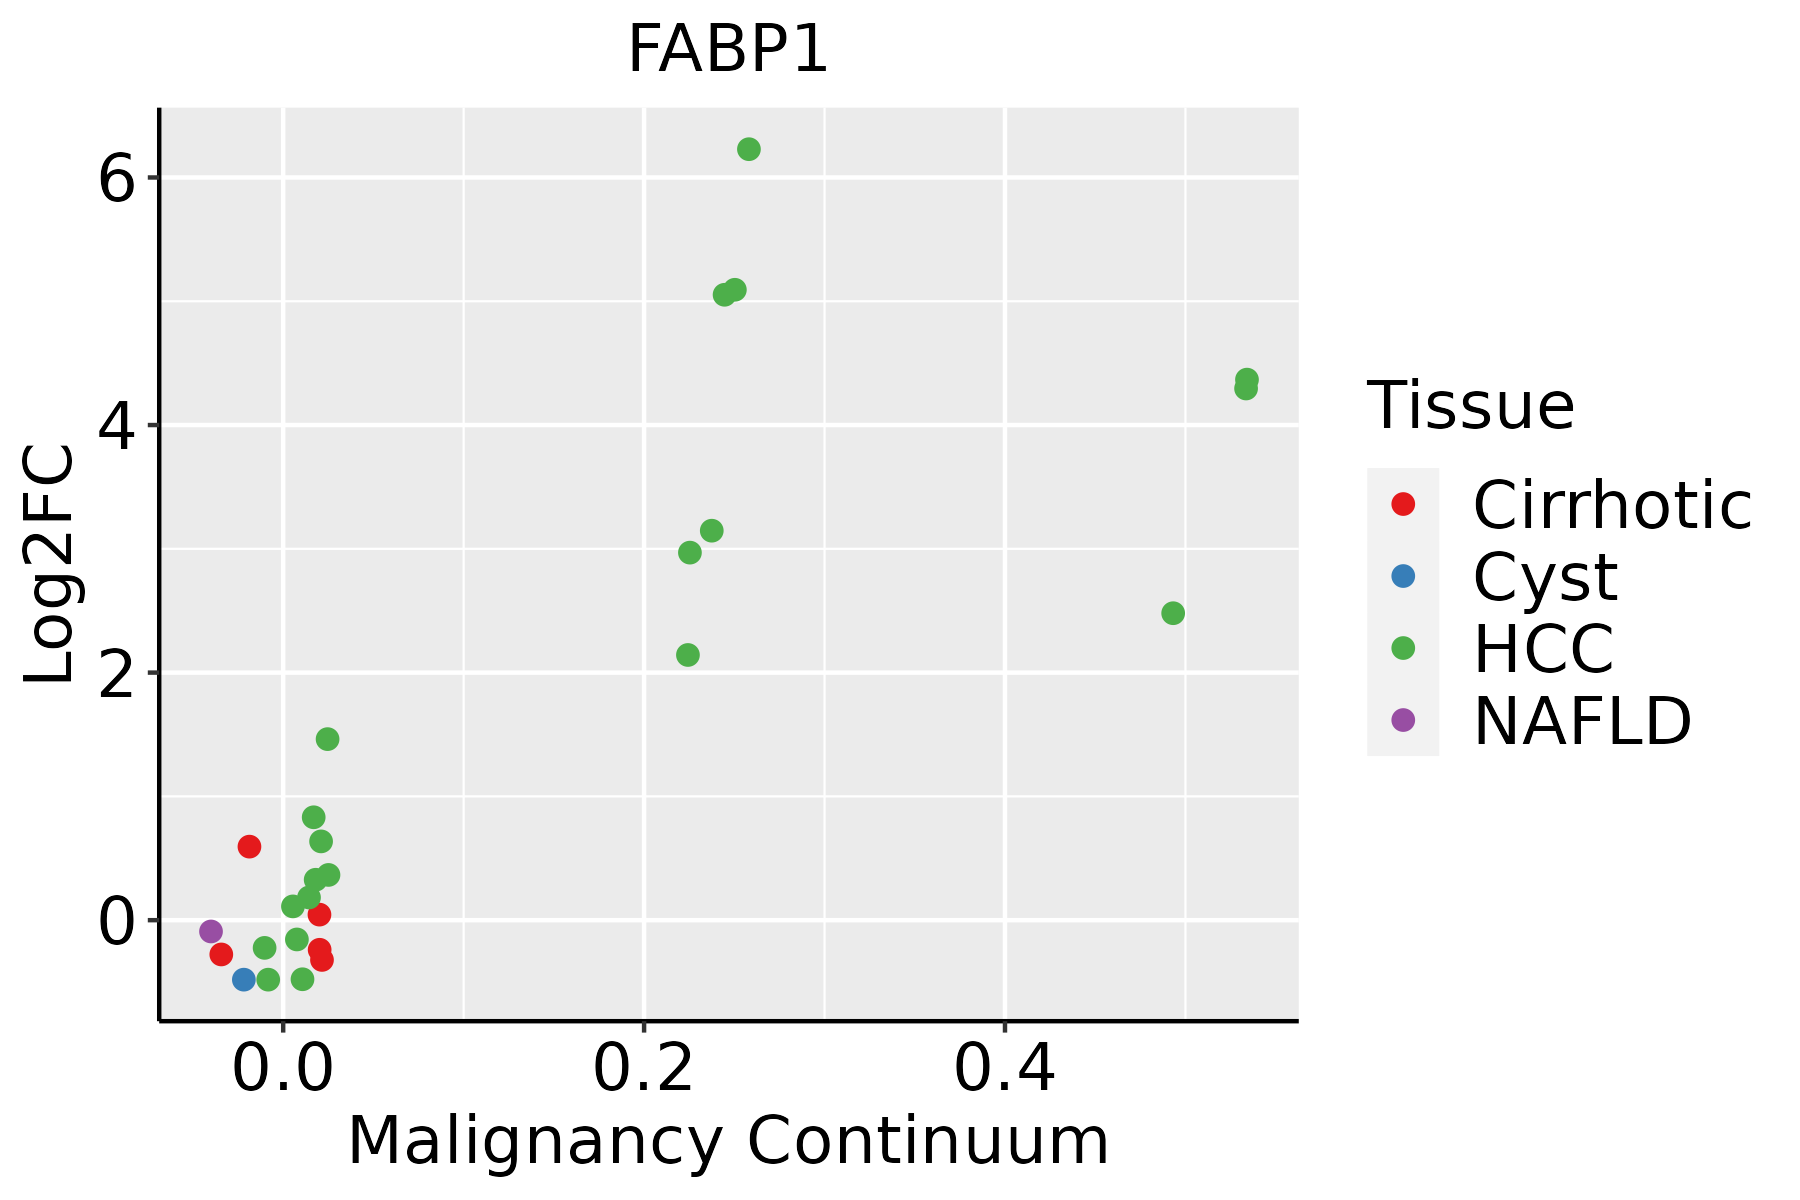 | HCC: Hepatocellular carcinoma |
| NAFLD: Non-alcoholic fatty liver disease |
| ∗log2FC in expression of this searched gene in stem-like cells from each diseased tissue sample relative to stem-like cells in normal samples in each tissue plotted against the malignancy continuum. Samples are colored based on if they are from different disease stage. |
Top |
Malignant transformation related pathway analysis |
| Find out the enriched GO biological processes and KEGG pathways involved in transition from healthy to precancer to cancer |
| Tissue | Disease Stage | Enriched GO biological Processes |
| Colorectum | AD |  |
| Colorectum | SER |  |
| Colorectum | MSS |  |
| Colorectum | MSI-H |  |
| Colorectum | FAP |  |
| ∗Top 15 enriched GO BP terms are showed in the bar plot of each disease state in each tissue. Each row represents a significant GO biological process which is colored according to the -log10(p.adjust). |
| Page: 1 2 3 4 5 6 7 8 9 |
| GO ID | Tissue | Disease Stage | Description | Gene Ratio | Bg Ratio | pvalue | p.adjust | Count |
| GO:0009896 | Colorectum | AD | positive regulation of catabolic process | 180/3918 | 492/18723 | 4.33e-16 | 1.94e-13 | 180 |
| GO:0031331 | Colorectum | AD | positive regulation of cellular catabolic process | 156/3918 | 427/18723 | 4.68e-14 | 1.05e-11 | 156 |
| GO:0006979 | Colorectum | AD | response to oxidative stress | 145/3918 | 446/18723 | 5.16e-09 | 3.23e-07 | 145 |
| GO:0062197 | Colorectum | AD | cellular response to chemical stress | 109/3918 | 337/18723 | 5.33e-07 | 1.95e-05 | 109 |
| GO:0000302 | Colorectum | AD | response to reactive oxygen species | 78/3918 | 222/18723 | 6.17e-07 | 2.21e-05 | 78 |
| GO:0044282 | Colorectum | AD | small molecule catabolic process | 118/3918 | 376/18723 | 1.05e-06 | 3.55e-05 | 118 |
| GO:0009636 | Colorectum | AD | response to toxic substance | 88/3918 | 262/18723 | 1.12e-06 | 3.72e-05 | 88 |
| GO:0034599 | Colorectum | AD | cellular response to oxidative stress | 94/3918 | 288/18723 | 2.03e-06 | 6.02e-05 | 94 |
| GO:0043281 | Colorectum | AD | regulation of cysteine-type endopeptidase activity involved in apoptotic process | 72/3918 | 209/18723 | 3.70e-06 | 1.03e-04 | 72 |
| GO:2000116 | Colorectum | AD | regulation of cysteine-type endopeptidase activity | 79/3918 | 235/18723 | 3.74e-06 | 1.03e-04 | 79 |
| GO:0006635 | Colorectum | AD | fatty acid beta-oxidation | 33/3918 | 74/18723 | 3.98e-06 | 1.09e-04 | 33 |
| GO:0009062 | Colorectum | AD | fatty acid catabolic process | 41/3918 | 100/18723 | 4.02e-06 | 1.09e-04 | 41 |
| GO:0052547 | Colorectum | AD | regulation of peptidase activity | 137/3918 | 461/18723 | 4.12e-06 | 1.12e-04 | 137 |
| GO:0045861 | Colorectum | AD | negative regulation of proteolysis | 106/3918 | 351/18723 | 2.33e-05 | 4.57e-04 | 106 |
| GO:0019395 | Colorectum | AD | fatty acid oxidation | 40/3918 | 103/18723 | 2.43e-05 | 4.69e-04 | 40 |
| GO:0042542 | Colorectum | AD | response to hydrogen peroxide | 52/3918 | 146/18723 | 2.83e-05 | 5.30e-04 | 52 |
| GO:0016042 | Colorectum | AD | lipid catabolic process | 97/3918 | 320/18723 | 4.31e-05 | 7.56e-04 | 97 |
| GO:0098754 | Colorectum | AD | detoxification | 53/3918 | 152/18723 | 4.63e-05 | 7.98e-04 | 53 |
| GO:0006631 | Colorectum | AD | fatty acid metabolic process | 114/3918 | 390/18723 | 5.58e-05 | 9.44e-04 | 114 |
| GO:0052548 | Colorectum | AD | regulation of endopeptidase activity | 124/3918 | 432/18723 | 6.58e-05 | 1.07e-03 | 124 |
| Page: 1 2 3 4 5 6 7 8 9 10 11 12 13 14 15 16 17 18 19 20 21 22 |
| Pathway ID | Tissue | Disease Stage | Description | Gene Ratio | Bg Ratio | pvalue | p.adjust | qvalue | Count |
| hsa04936 | Liver | Cirrhotic | Alcoholic liver disease | 60/2530 | 142/8465 | 1.07e-03 | 5.85e-03 | 3.61e-03 | 60 |
| hsa0332021 | Liver | Cirrhotic | PPAR signaling pathway | 32/2530 | 75/8465 | 1.24e-02 | 3.92e-02 | 2.42e-02 | 32 |
| hsa049361 | Liver | Cirrhotic | Alcoholic liver disease | 60/2530 | 142/8465 | 1.07e-03 | 5.85e-03 | 3.61e-03 | 60 |
| hsa0332031 | Liver | Cirrhotic | PPAR signaling pathway | 32/2530 | 75/8465 | 1.24e-02 | 3.92e-02 | 2.42e-02 | 32 |
| hsa049362 | Liver | HCC | Alcoholic liver disease | 89/4020 | 142/8465 | 1.73e-04 | 8.53e-04 | 4.75e-04 | 89 |
| hsa033204 | Liver | HCC | PPAR signaling pathway | 48/4020 | 75/8465 | 2.83e-03 | 9.37e-03 | 5.21e-03 | 48 |
| hsa049363 | Liver | HCC | Alcoholic liver disease | 89/4020 | 142/8465 | 1.73e-04 | 8.53e-04 | 4.75e-04 | 89 |
| hsa033205 | Liver | HCC | PPAR signaling pathway | 48/4020 | 75/8465 | 2.83e-03 | 9.37e-03 | 5.21e-03 | 48 |
| hsa04975 | Stomach | GC | Fat digestion and absorption | 14/708 | 43/8465 | 5.71e-06 | 8.30e-05 | 5.84e-05 | 14 |
| hsa03320 | Stomach | GC | PPAR signaling pathway | 18/708 | 75/8465 | 3.26e-05 | 4.01e-04 | 2.82e-04 | 18 |
| hsa049751 | Stomach | GC | Fat digestion and absorption | 14/708 | 43/8465 | 5.71e-06 | 8.30e-05 | 5.84e-05 | 14 |
| hsa033201 | Stomach | GC | PPAR signaling pathway | 18/708 | 75/8465 | 3.26e-05 | 4.01e-04 | 2.82e-04 | 18 |
| hsa049752 | Stomach | SIM | Fat digestion and absorption | 12/465 | 43/8465 | 2.11e-06 | 3.05e-05 | 2.45e-05 | 12 |
| hsa033202 | Stomach | SIM | PPAR signaling pathway | 15/465 | 75/8465 | 1.08e-05 | 1.42e-04 | 1.14e-04 | 15 |
| hsa049753 | Stomach | SIM | Fat digestion and absorption | 12/465 | 43/8465 | 2.11e-06 | 3.05e-05 | 2.45e-05 | 12 |
| hsa033203 | Stomach | SIM | PPAR signaling pathway | 15/465 | 75/8465 | 1.08e-05 | 1.42e-04 | 1.14e-04 | 15 |
| Page: 1 |
Top |
Cell-cell communication analysis |
| Identification of potential cell-cell interactions between two cell types and their ligand-receptor pairs for different disease states |
| Ligand | Receptor | LRpair | Pathway | Tissue | Disease Stage |
| Page: 1 |
Top |
Single-cell gene regulatory network inference analysis |
| Find out the significant the regulons (TFs) and the target genes of each regulon across cell types for different disease states |
| TF | Cell Type | Tissue | Disease Stage | Target Gene | RSS | Regulon Activity |
| ∗The dot plots of a searched regulon are shown for all cell subpopulations in each disease state of each tissue based on the regulon specific score inferred using pySCENIC and by calculating the average expression. |
| Page: 1 |
Top |
Somatic mutation of malignant transformation related genes |
| Annotation of somatic variants for genes involved in malignant transformation |
| Hugo Symbol | Variant Class | Variant Classification | dbSNP RS | HGVSc | HGVSp | HGVSp Short | SWISSPROT | BIOTYPE | SIFT | PolyPhen | Tumor Sample Barcode | Tissue | Histology | Sex | Age | Stage | Therapy Types | Drugs | Outcome |
| FABP1 | SNV | Missense_Mutation | c.227N>A | p.Gly76Glu | p.G76E | P07148 | protein_coding | deleterious(0) | probably_damaging(0.996) | TCGA-A8-A07P-01 | Breast | breast invasive carcinoma | Female | >=65 | I/II | Chemotherapy | 5-fluorouracil | SD | |
| FABP1 | SNV | Missense_Mutation | novel | c.268N>C | p.Lys90Gln | p.K90Q | P07148 | protein_coding | deleterious(0) | possibly_damaging(0.561) | TCGA-AZ-4315-01 | Colorectum | colon adenocarcinoma | Male | <65 | I/II | Unknown | Unknown | SD |
| FABP1 | SNV | Missense_Mutation | novel | c.381N>G | p.Ile127Met | p.I127M | P07148 | protein_coding | tolerated(0.08) | benign(0.205) | TCGA-CA-6717-01 | Colorectum | colon adenocarcinoma | Male | <65 | I/II | Chemotherapy | oxaliplatin | CR |
| FABP1 | SNV | Missense_Mutation | novel | c.271N>A | p.Leu91Met | p.L91M | P07148 | protein_coding | deleterious(0.04) | possibly_damaging(0.736) | TCGA-F5-6814-01 | Colorectum | rectum adenocarcinoma | Male | <65 | I/II | Unknown | Unknown | SD |
| FABP1 | SNV | Missense_Mutation | novel | c.172N>A | p.Val58Met | p.V58M | P07148 | protein_coding | deleterious(0.02) | possibly_damaging(0.794) | TCGA-AJ-A3IA-01 | Endometrium | uterine corpus endometrioid carcinoma | Female | >=65 | I/II | Unknown | Unknown | SD |
| FABP1 | SNV | Missense_Mutation | c.70N>A | p.Leu24Met | p.L24M | P07148 | protein_coding | tolerated(0.06) | benign(0.154) | TCGA-AX-A05Z-01 | Endometrium | uterine corpus endometrioid carcinoma | Female | <65 | III/IV | Chemotherapy | adriamycin | SD | |
| FABP1 | SNV | Missense_Mutation | novel | c.371N>A | p.Ser124Asn | p.S124N | P07148 | protein_coding | deleterious(0) | probably_damaging(0.946) | TCGA-AX-A2HJ-01 | Endometrium | uterine corpus endometrioid carcinoma | Female | <65 | I/II | Unknown | Unknown | SD |
| FABP1 | SNV | Missense_Mutation | rs772030208 | c.319G>A | p.Asp107Asn | p.D107N | P07148 | protein_coding | tolerated(0.18) | benign(0.062) | TCGA-BS-A0UV-01 | Endometrium | uterine corpus endometrioid carcinoma | Female | <65 | III/IV | Unknown | Unknown | SD |
| FABP1 | SNV | Missense_Mutation | c.293N>C | p.Ile98Thr | p.I98T | P07148 | protein_coding | deleterious(0.03) | possibly_damaging(0.79) | TCGA-D1-A103-01 | Endometrium | uterine corpus endometrioid carcinoma | Female | >=65 | I/II | Unknown | Unknown | SD | |
| FABP1 | SNV | Missense_Mutation | novel | c.7T>G | p.Phe3Val | p.F3V | P07148 | protein_coding | deleterious(0) | probably_damaging(0.996) | TCGA-E6-A1LX-01 | Endometrium | uterine corpus endometrioid carcinoma | Female | <65 | I/II | Unknown | Unknown | SD |
| Page: 1 2 3 |
Top |
Related drugs of malignant transformation related genes |
| Identification of chemicals and drugs interact with genes involved in malignant transfromation |
| (DGIdb 4.0) |
| Entrez ID | Symbol | Category | Interaction Types | Drug Claim Name | Drug Name | PMIDs |
| 2168 | FABP1 | DRUGGABLE GENOME | FENOFIBRIC ACID | |||
| 2168 | FABP1 | DRUGGABLE GENOME | fenofibrate | FENOFIBRATE | 15249972 | |
| 2168 | FABP1 | DRUGGABLE GENOME | DEXAMETHASONE | DEXAMETHASONE | 15324484,15532708 | |
| 2168 | FABP1 | DRUGGABLE GENOME | CLOFIBRATE | CLOFIBRATE | 2328261 |
| Page: 1 |

Copyright 2023-Present -The University of Texas Health Science Center at Houston |