
|
|||||
|
 | |
| |
| |
| |
| |
| |
|
Gene: FAAP24 |
Gene summary for FAAP24 |
| Gene information | Species | Human | Gene symbol | FAAP24 | Gene ID | 91442 |
| Gene name | FA core complex associated protein 24 | |
| Gene Alias | C19orf40 | |
| Cytomap | 19q13.11 | |
| Gene Type | protein-coding | GO ID | GO:0006139 | UniProtAcc | K7EKQ4 |
Top |
Malignant transformation analysis |
| Identification of the aberrant gene expression in precancerous and cancerous lesions by comparing the gene expression of stem-like cells in diseased tissues with normal stem cells |
| Entrez ID | Symbol | Replicates | Species | Organ | Tissue | Adj P-value | Log2FC | Malignancy |
| 91442 | FAAP24 | HCC1_Meng | Human | Liver | HCC | 3.99e-09 | -5.91e-03 | 0.0246 |
| 91442 | FAAP24 | HCC1 | Human | Liver | HCC | 3.62e-08 | 1.60e+00 | 0.5336 |
| 91442 | FAAP24 | HCC2 | Human | Liver | HCC | 1.55e-14 | 1.01e+00 | 0.5341 |
| 91442 | FAAP24 | HCC5 | Human | Liver | HCC | 1.92e-18 | 1.02e+00 | 0.4932 |
| 91442 | FAAP24 | S016 | Human | Liver | HCC | 3.08e-02 | 1.20e-01 | 0.2243 |
| Page: 1 |
| Tissue | Expression Dynamics | Abbreviation |
| Liver | 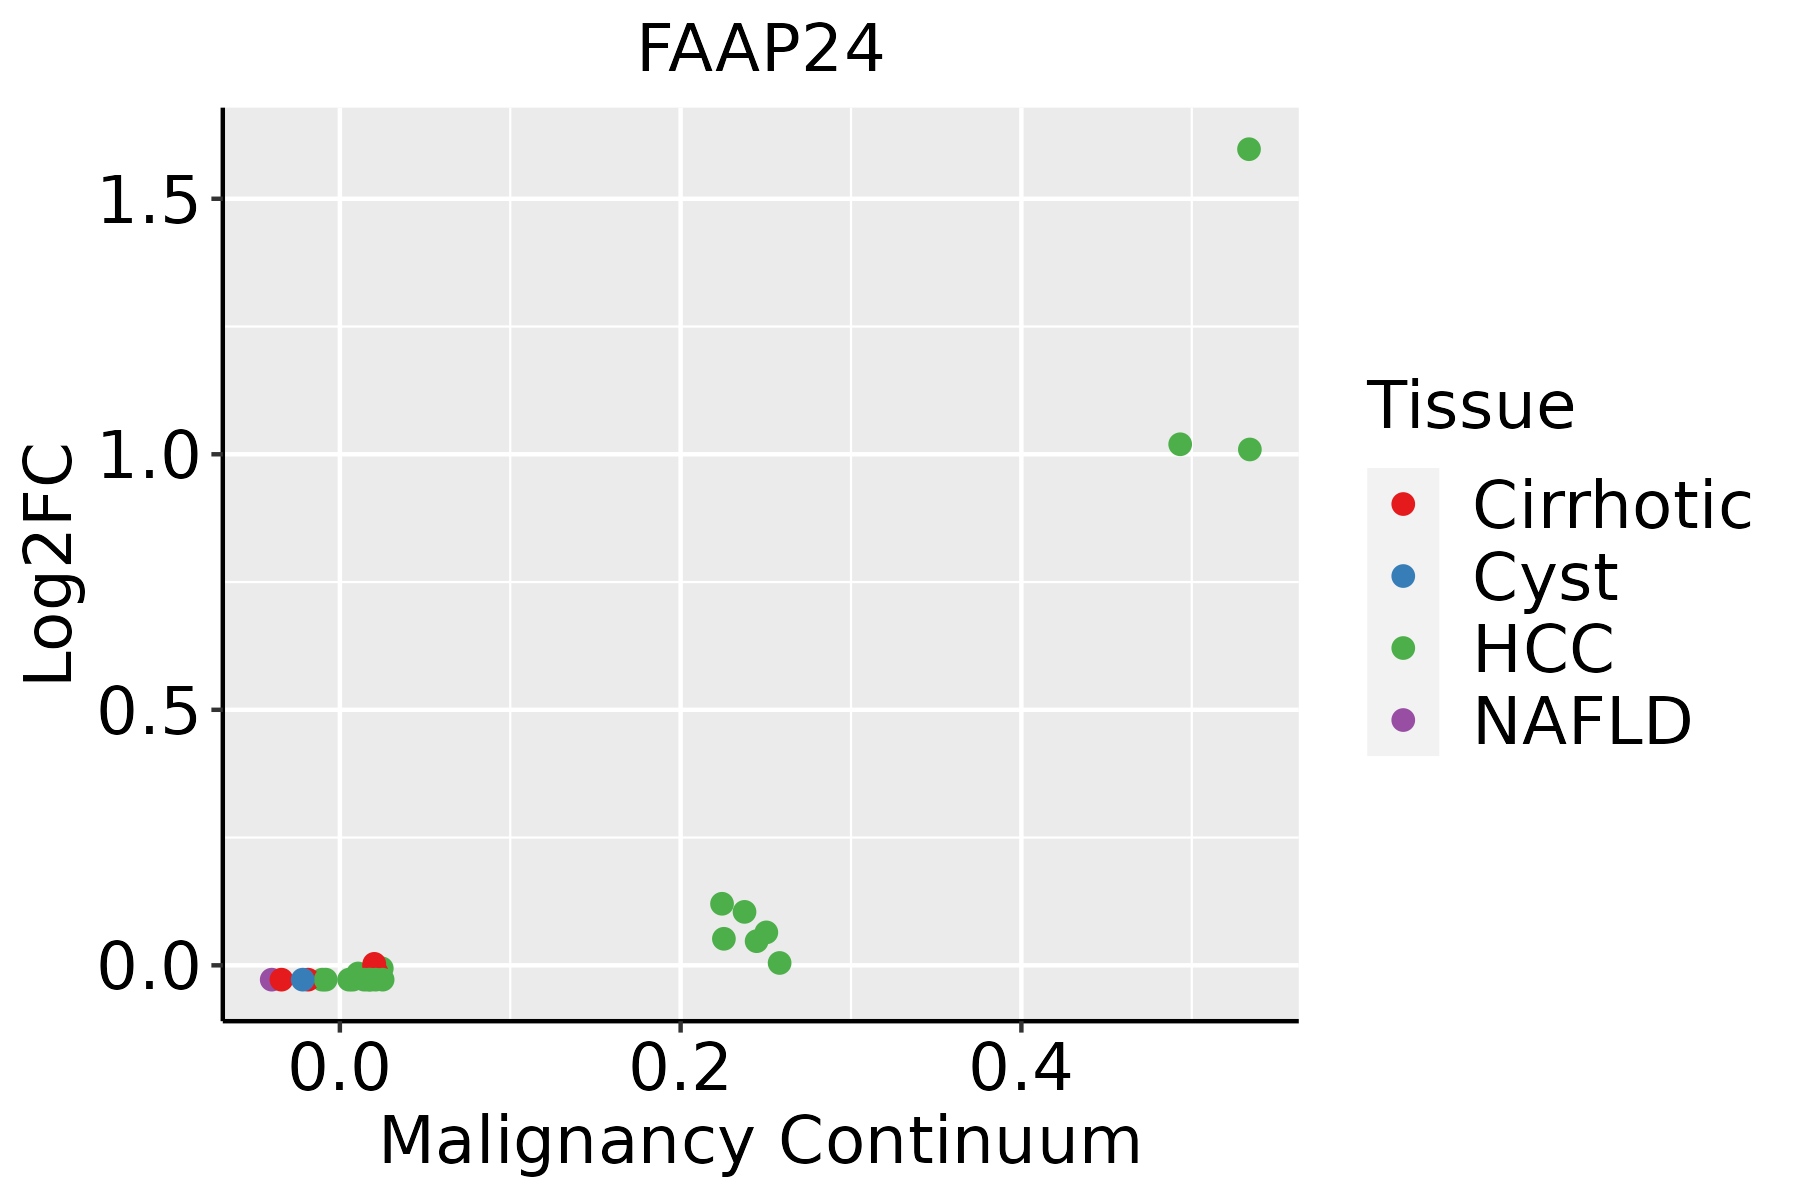 | HCC: Hepatocellular carcinoma |
| NAFLD: Non-alcoholic fatty liver disease |
| ∗log2FC in expression of this searched gene in stem-like cells from each diseased tissue sample relative to stem-like cells in normal samples in each tissue plotted against the malignancy continuum. Samples are colored based on if they are from different disease stage. |
Top |
Malignant transformation related pathway analysis |
| Find out the enriched GO biological processes and KEGG pathways involved in transition from healthy to precancer to cancer |
| Tissue | Disease Stage | Enriched GO biological Processes |
| Colorectum | AD |  |
| Colorectum | SER |  |
| Colorectum | MSS |  |
| Colorectum | MSI-H |  |
| Colorectum | FAP |  |
| ∗Top 15 enriched GO BP terms are showed in the bar plot of each disease state in each tissue. Each row represents a significant GO biological process which is colored according to the -log10(p.adjust). |
| Page: 1 2 3 4 5 6 7 8 9 |
| GO ID | Tissue | Disease Stage | Description | Gene Ratio | Bg Ratio | pvalue | p.adjust | Count |
| Page: 1 |
| Pathway ID | Tissue | Disease Stage | Description | Gene Ratio | Bg Ratio | pvalue | p.adjust | qvalue | Count |
| Page: 1 |
Top |
Cell-cell communication analysis |
| Identification of potential cell-cell interactions between two cell types and their ligand-receptor pairs for different disease states |
| Ligand | Receptor | LRpair | Pathway | Tissue | Disease Stage |
| Page: 1 |
Top |
Single-cell gene regulatory network inference analysis |
| Find out the significant the regulons (TFs) and the target genes of each regulon across cell types for different disease states |
| TF | Cell Type | Tissue | Disease Stage | Target Gene | RSS | Regulon Activity |
| ∗The dot plots of a searched regulon are shown for all cell subpopulations in each disease state of each tissue based on the regulon specific score inferred using pySCENIC and by calculating the average expression. |
| Page: 1 |
Top |
Somatic mutation of malignant transformation related genes |
| Annotation of somatic variants for genes involved in malignant transformation |
| Hugo Symbol | Variant Class | Variant Classification | dbSNP RS | HGVSc | HGVSp | HGVSp Short | SWISSPROT | BIOTYPE | SIFT | PolyPhen | Tumor Sample Barcode | Tissue | Histology | Sex | Age | Stage | Therapy Types | Drugs | Outcome |
| FAAP24 | SNV | Missense_Mutation | novel | c.572N>T | p.Ser191Phe | p.S191F | Q9BTP7 | protein_coding | deleterious(0) | probably_damaging(0.993) | TCGA-AN-A046-01 | Breast | breast invasive carcinoma | Female | >=65 | I/II | Unknown | Unknown | SD |
| FAAP24 | insertion | In_Frame_Ins | novel | c.182_183insACCACCACACATCCCGTCTCCAGCCACCCTGGCCTTCATTCAGGC | p.Val61_Thr62insProProHisIleProSerProAlaThrLeuAlaPheIleGlnAla | p.V61_T62insPPHIPSPATLAFIQA | Q9BTP7 | protein_coding | TCGA-AN-A04D-01 | Breast | breast invasive carcinoma | Female | <65 | I/II | Unknown | Unknown | SD | ||
| FAAP24 | SNV | Missense_Mutation | c.242N>G | p.Asn81Ser | p.N81S | Q9BTP7 | protein_coding | tolerated(0.05) | possibly_damaging(0.664) | TCGA-A6-6653-01 | Colorectum | colon adenocarcinoma | Male | >=65 | I/II | Unknown | Unknown | SD | |
| FAAP24 | SNV | Missense_Mutation | rs754020925 | c.76N>T | p.Arg26Cys | p.R26C | Q9BTP7 | protein_coding | deleterious(0) | possibly_damaging(0.877) | TCGA-AA-3821-01 | Colorectum | colon adenocarcinoma | Female | >=65 | I/II | Unknown | Unknown | SD |
| FAAP24 | SNV | Missense_Mutation | c.175C>A | p.Leu59Ile | p.L59I | Q9BTP7 | protein_coding | tolerated(0.1) | benign(0.056) | TCGA-AA-A00N-01 | Colorectum | colon adenocarcinoma | Male | >=65 | I/II | Unknown | Unknown | PD | |
| FAAP24 | SNV | Missense_Mutation | novel | c.249N>A | p.Asn83Lys | p.N83K | Q9BTP7 | protein_coding | tolerated(0.1) | benign(0) | TCGA-AG-3726-01 | Colorectum | rectum adenocarcinoma | Female | <65 | I/II | Unknown | Unknown | SD |
| FAAP24 | SNV | Missense_Mutation | c.206N>A | p.Gly69Glu | p.G69E | Q9BTP7 | protein_coding | tolerated(0.1) | probably_damaging(0.999) | TCGA-AG-A00Y-01 | Colorectum | rectum adenocarcinoma | Male | >=65 | I/II | Unknown | Unknown | PD | |
| FAAP24 | deletion | Frame_Shift_Del | c.275delN | p.Thr94ProfsTer3 | p.T94Pfs*3 | Q9BTP7 | protein_coding | TCGA-F4-6570-01 | Colorectum | colon adenocarcinoma | Female | >=65 | I/II | Unknown | Unknown | SD | |||
| FAAP24 | SNV | Missense_Mutation | novel | c.26C>T | p.Thr9Met | p.T9M | Q9BTP7 | protein_coding | tolerated_low_confidence(0.06) | benign(0.306) | TCGA-AJ-A3EK-01 | Endometrium | uterine corpus endometrioid carcinoma | Female | <65 | I/II | Chemotherapy | carboplatin | CR |
| FAAP24 | SNV | Missense_Mutation | novel | c.91N>A | p.Ala31Thr | p.A31T | Q9BTP7 | protein_coding | tolerated(0.1) | possibly_damaging(0.476) | TCGA-AX-A2HA-01 | Endometrium | uterine corpus endometrioid carcinoma | Female | <65 | I/II | Unknown | Unknown | SD |
| Page: 1 2 3 4 |
Top |
Related drugs of malignant transformation related genes |
| Identification of chemicals and drugs interact with genes involved in malignant transfromation |
| (DGIdb 4.0) |
| Entrez ID | Symbol | Category | Interaction Types | Drug Claim Name | Drug Name | PMIDs |
| Page: 1 |

Copyright 2023-Present -The University of Texas Health Science Center at Houston |