
|
|||||
|
 | |
| |
| |
| |
| |
| |
|
Gene: FAAP20 |
Gene summary for FAAP20 |
| Gene information | Species | Human | Gene symbol | FAAP20 | Gene ID | 199990 |
| Gene name | FA core complex associated protein 20 | |
| Gene Alias | C1orf86 | |
| Cytomap | 1p36.33 | |
| Gene Type | protein-coding | GO ID | GO:0000731 | UniProtAcc | Q6ZRT9 |
Top |
Malignant transformation analysis |
| Identification of the aberrant gene expression in precancerous and cancerous lesions by comparing the gene expression of stem-like cells in diseased tissues with normal stem cells |
| Entrez ID | Symbol | Replicates | Species | Organ | Tissue | Adj P-value | Log2FC | Malignancy |
| 199990 | FAAP20 | AEH-subject1 | Human | Endometrium | AEH | 1.72e-03 | -1.42e-01 | -0.3059 |
| 199990 | FAAP20 | AEH-subject2 | Human | Endometrium | AEH | 1.82e-07 | -2.30e-01 | -0.2525 |
| 199990 | FAAP20 | AEH-subject3 | Human | Endometrium | AEH | 2.47e-09 | -1.86e-01 | -0.2576 |
| 199990 | FAAP20 | AEH-subject4 | Human | Endometrium | AEH | 3.15e-10 | -4.37e-01 | -0.2657 |
| 199990 | FAAP20 | AEH-subject5 | Human | Endometrium | AEH | 4.36e-16 | -3.99e-01 | -0.2953 |
| 199990 | FAAP20 | EEC-subject1 | Human | Endometrium | EEC | 2.29e-16 | -3.33e-01 | -0.2682 |
| 199990 | FAAP20 | EEC-subject2 | Human | Endometrium | EEC | 2.83e-06 | -1.62e-01 | -0.2607 |
| 199990 | FAAP20 | EEC-subject3 | Human | Endometrium | EEC | 1.21e-56 | -4.45e-01 | -0.2525 |
| 199990 | FAAP20 | EEC-subject4 | Human | Endometrium | EEC | 1.06e-12 | -3.64e-01 | -0.2571 |
| 199990 | FAAP20 | EEC-subject5 | Human | Endometrium | EEC | 2.37e-09 | -3.10e-01 | -0.249 |
| 199990 | FAAP20 | GSM5276934 | Human | Endometrium | EEC | 7.16e-13 | -3.51e-01 | -0.0913 |
| 199990 | FAAP20 | GSM5276935 | Human | Endometrium | EEC | 1.95e-05 | -2.09e-01 | -0.123 |
| 199990 | FAAP20 | GSM5276937 | Human | Endometrium | EEC | 3.13e-10 | -4.12e-01 | -0.0897 |
| 199990 | FAAP20 | GSM6177620_NYU_UCEC1_lib1_lib1 | Human | Endometrium | EEC | 1.01e-26 | -3.94e-01 | -0.1869 |
| 199990 | FAAP20 | GSM6177620_NYU_UCEC1_lib2_lib2 | Human | Endometrium | EEC | 4.04e-21 | -4.43e-01 | -0.1875 |
| 199990 | FAAP20 | GSM6177620_NYU_UCEC1_lib3_lib3 | Human | Endometrium | EEC | 6.55e-27 | -5.49e-01 | -0.1883 |
| 199990 | FAAP20 | GSM6177621_NYU_UCEC2_lib1_lib1 | Human | Endometrium | EEC | 3.87e-37 | -4.27e-01 | -0.1934 |
| 199990 | FAAP20 | GSM6177622_NYU_UCEC3_lib1_lib1 | Human | Endometrium | EEC | 2.59e-48 | -4.95e-01 | -0.1917 |
| 199990 | FAAP20 | GSM6177622_NYU_UCEC3_lib2_lib2 | Human | Endometrium | EEC | 1.55e-43 | -4.85e-01 | -0.1916 |
| 199990 | FAAP20 | GSM6177623_NYU_UCEC3_Vis | Human | Endometrium | EEC | 1.05e-08 | -2.36e-01 | -0.1269 |
| Page: 1 2 3 4 5 6 7 8 9 |
| Tissue | Expression Dynamics | Abbreviation |
| Endometrium |  | AEH: Atypical endometrial hyperplasia |
| EEC: Endometrioid Cancer | ||
| Esophagus | 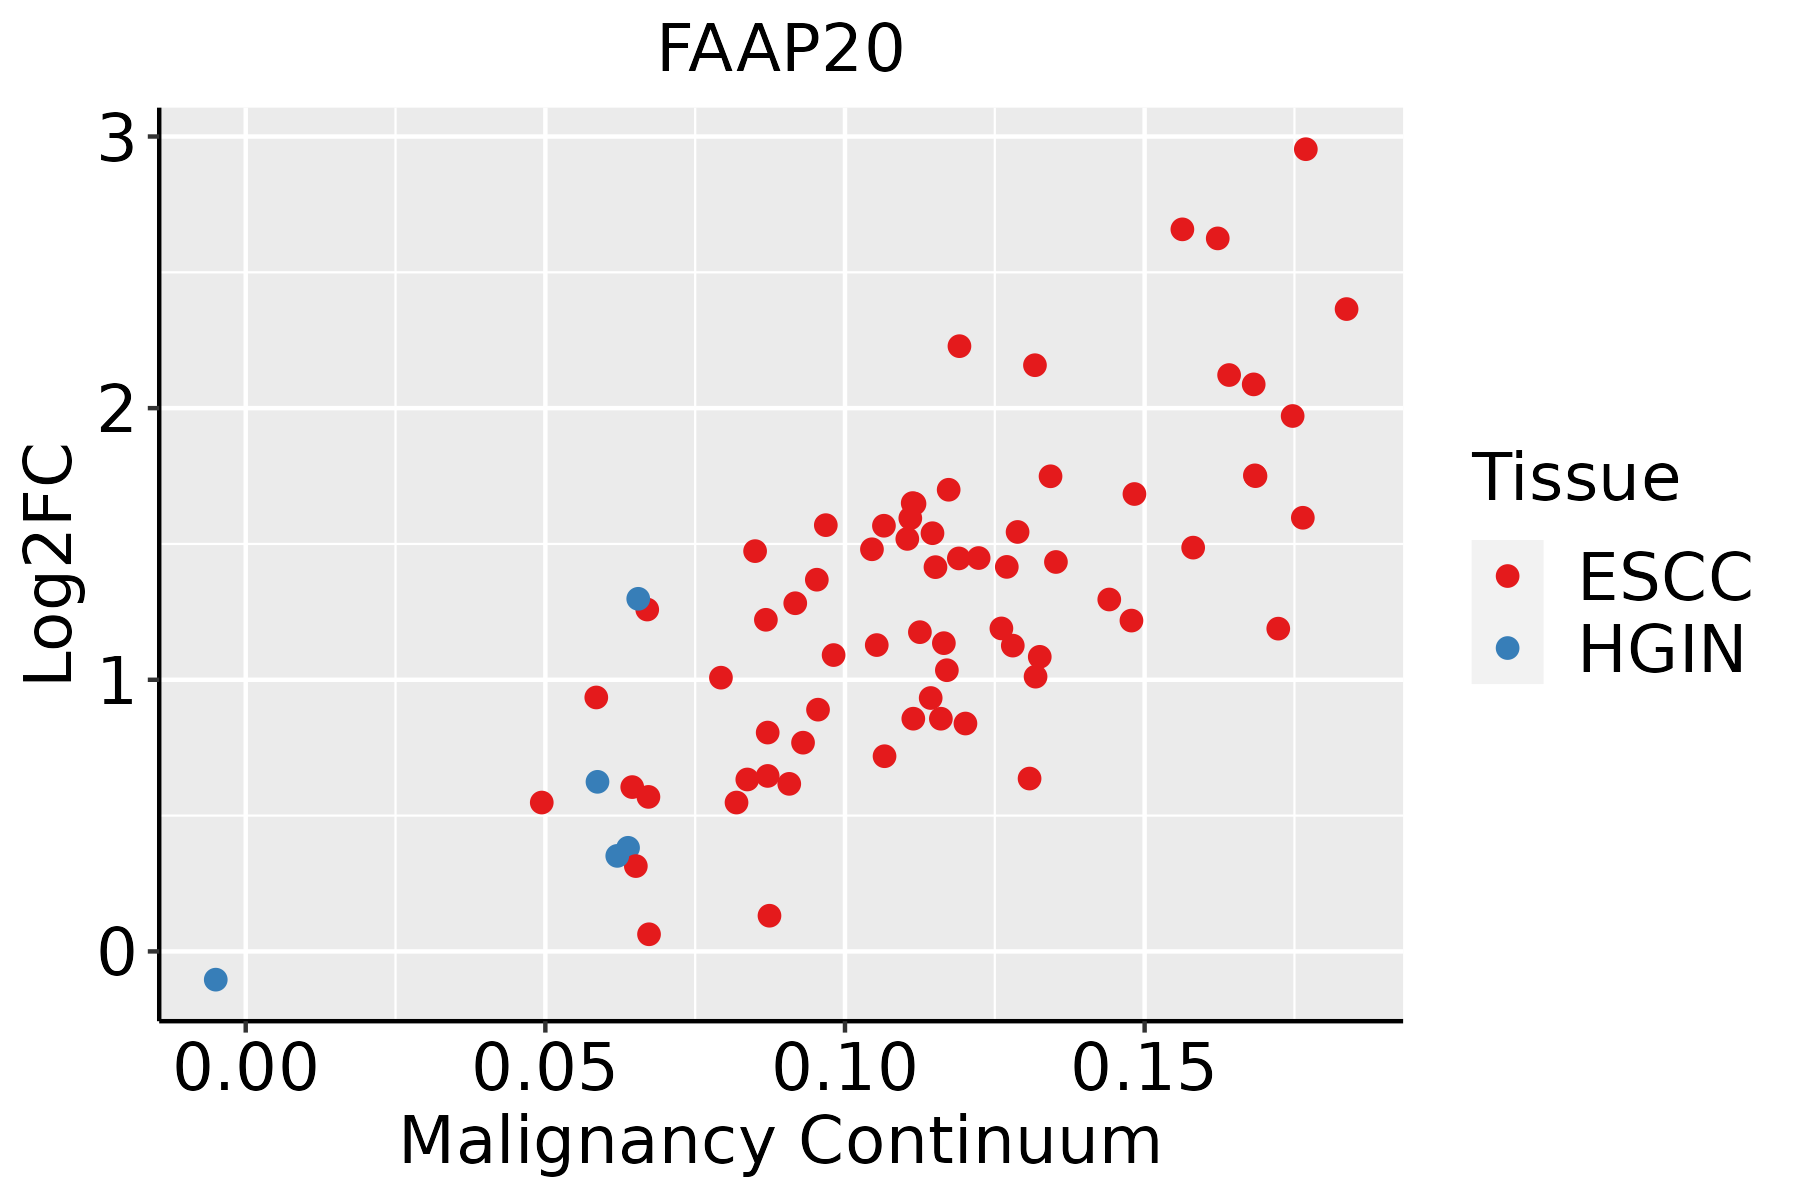 | ESCC: Esophageal squamous cell carcinoma |
| HGIN: High-grade intraepithelial neoplasias | ||
| LGIN: Low-grade intraepithelial neoplasias | ||
| GC | 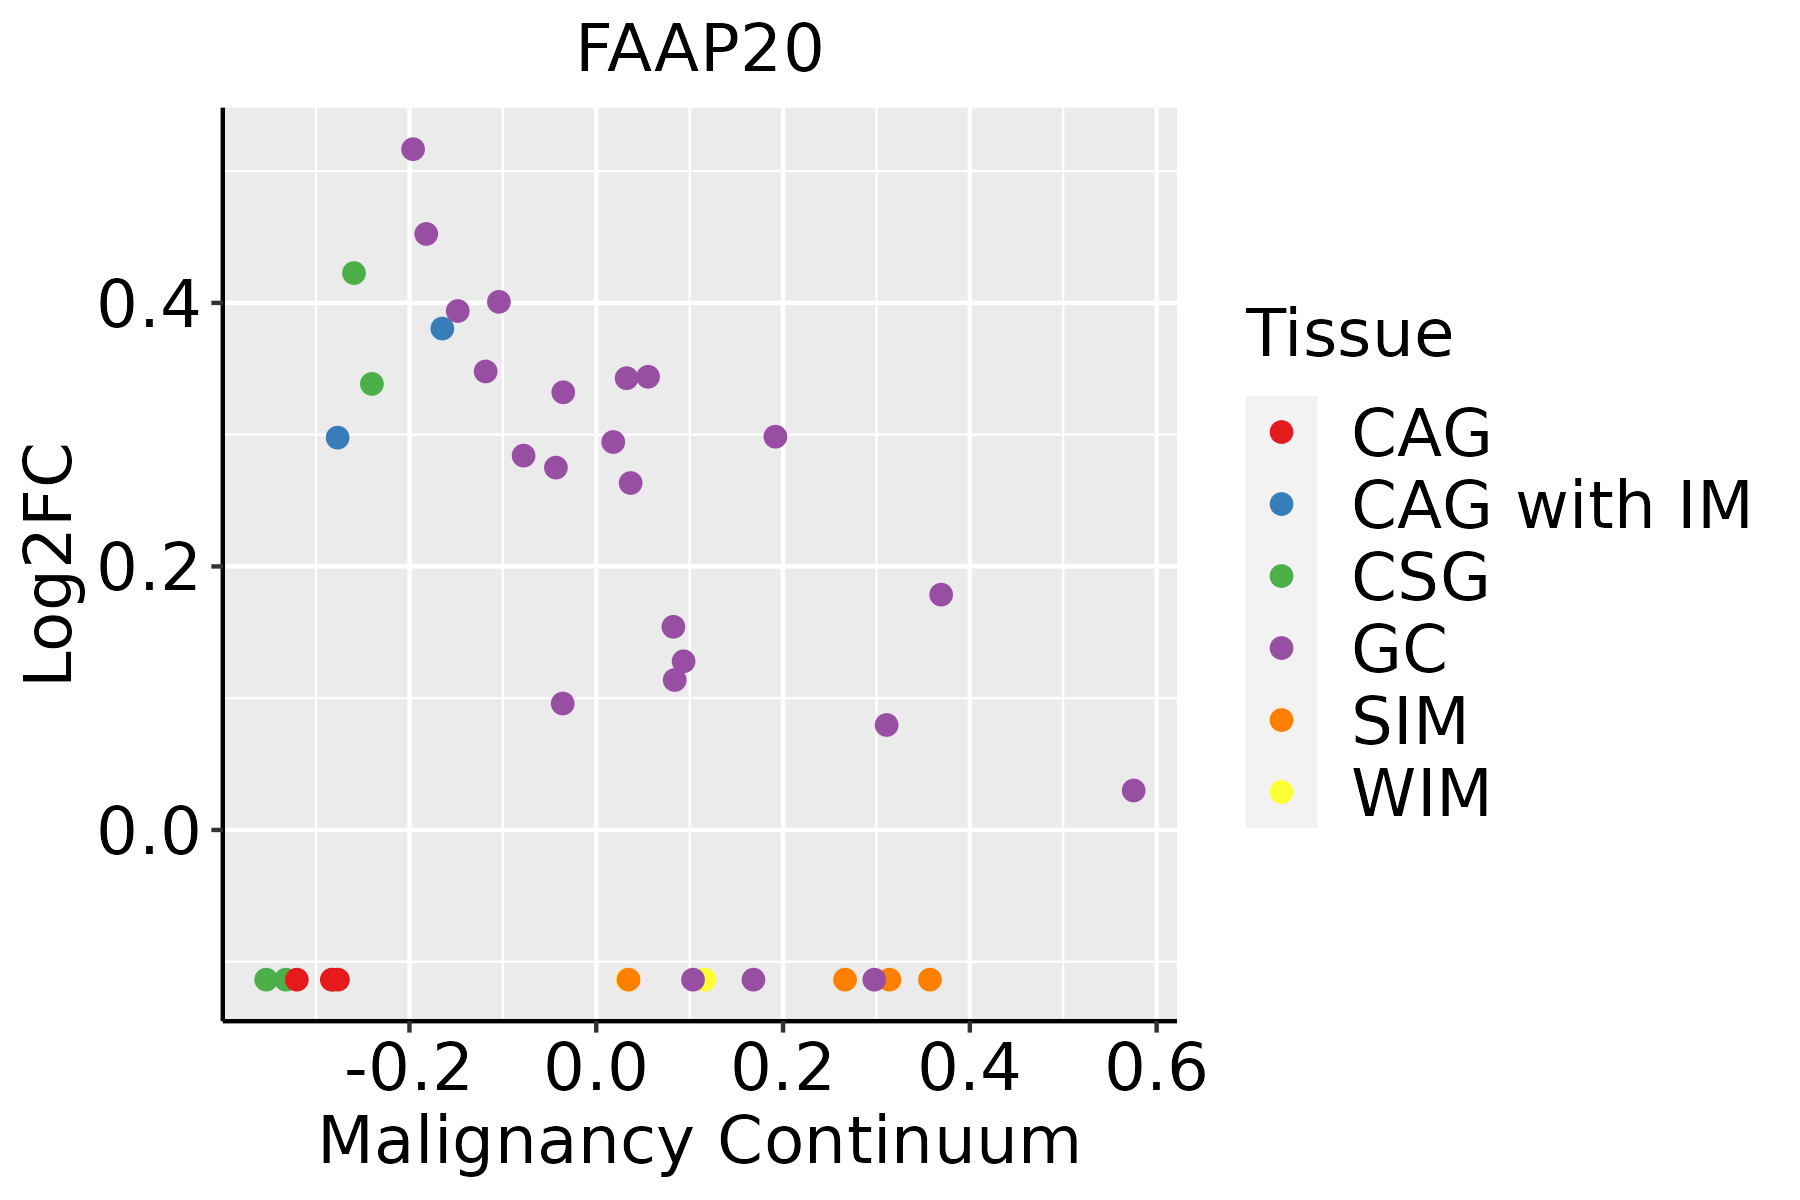 | CAG: Chronic atrophic gastritis |
| CAG with IM: Chronic atrophic gastritis with intestinal metaplasia | ||
| CSG: Chronic superficial gastritis | ||
| GC: Gastric cancer | ||
| SIM: Severe intestinal metaplasia | ||
| WIM: Wild intestinal metaplasia | ||
| Liver | 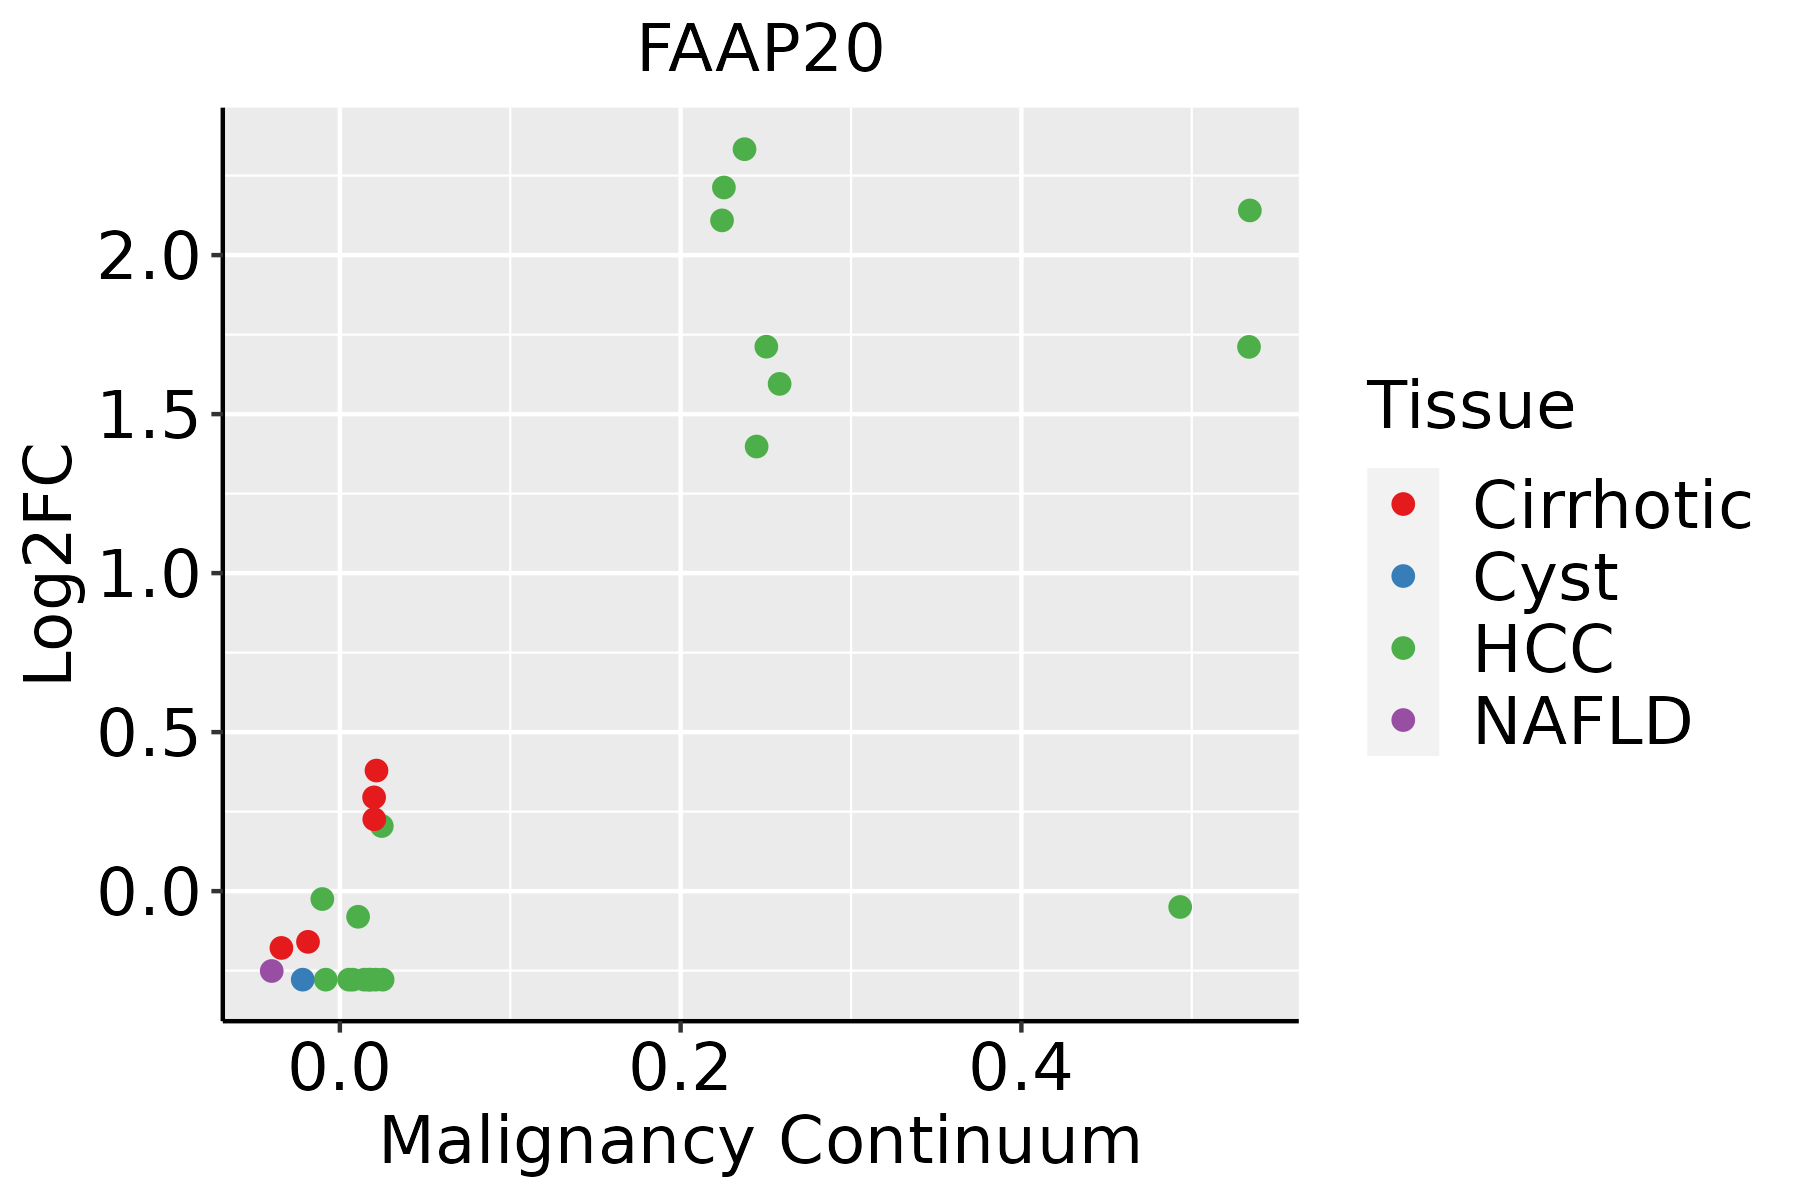 | HCC: Hepatocellular carcinoma |
| NAFLD: Non-alcoholic fatty liver disease | ||
| Oral Cavity | 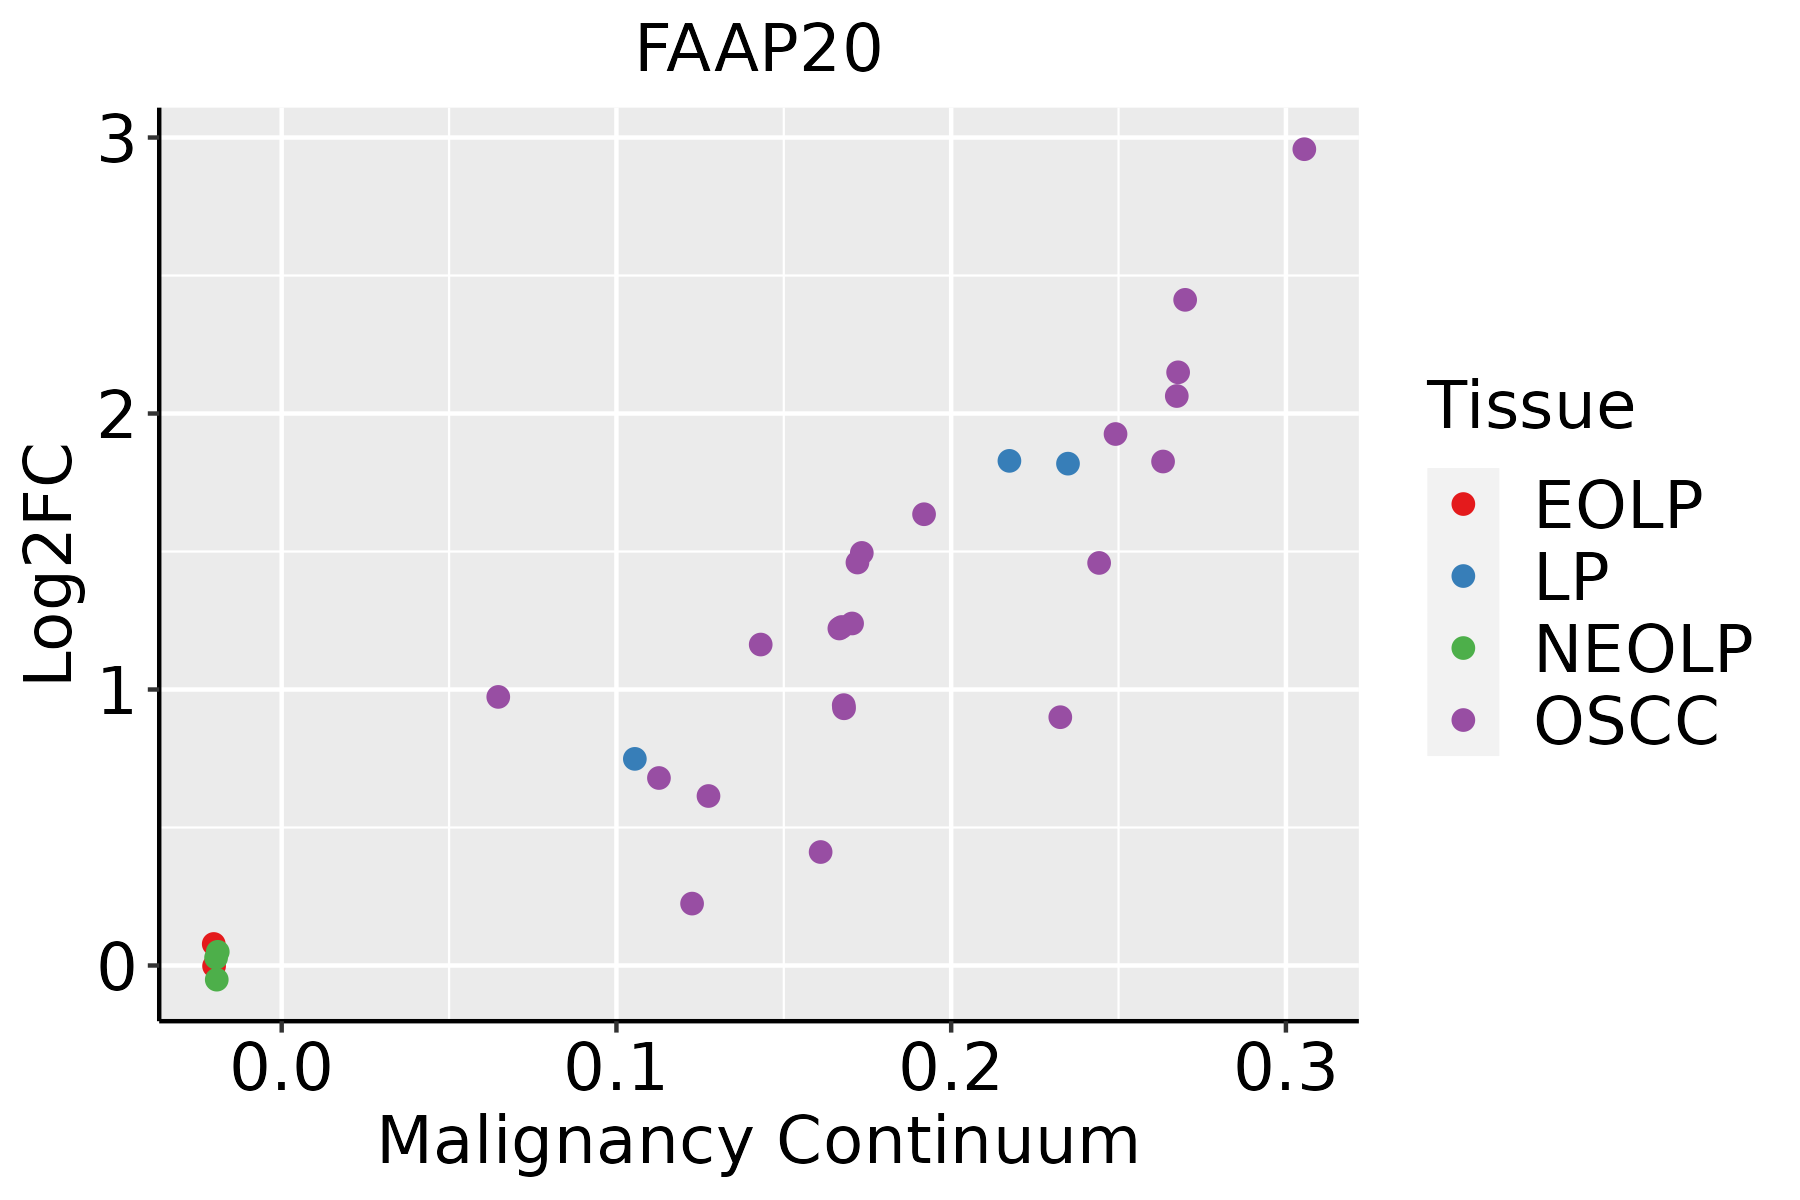 | EOLP: Erosive Oral lichen planus |
| LP: leukoplakia | ||
| NEOLP: Non-erosive oral lichen planus | ||
| OSCC: Oral squamous cell carcinoma | ||
| Thyroid |  | ATC: Anaplastic thyroid cancer |
| HT: Hashimoto's thyroiditis | ||
| PTC: Papillary thyroid cancer |
| ∗log2FC in expression of this searched gene in stem-like cells from each diseased tissue sample relative to stem-like cells in normal samples in each tissue plotted against the malignancy continuum. Samples are colored based on if they are from different disease stage. |
Top |
Malignant transformation related pathway analysis |
| Find out the enriched GO biological processes and KEGG pathways involved in transition from healthy to precancer to cancer |
| Tissue | Disease Stage | Enriched GO biological Processes |
| Colorectum | AD |  |
| Colorectum | SER |  |
| Colorectum | MSS |  |
| Colorectum | MSI-H |  |
| Colorectum | FAP |  |
| ∗Top 15 enriched GO BP terms are showed in the bar plot of each disease state in each tissue. Each row represents a significant GO biological process which is colored according to the -log10(p.adjust). |
| Page: 1 2 3 4 5 6 7 8 9 |
| GO ID | Tissue | Disease Stage | Description | Gene Ratio | Bg Ratio | pvalue | p.adjust | Count |
| GO:00718977 | Endometrium | AEH | DNA biosynthetic process | 37/2100 | 180/18723 | 1.87e-04 | 2.39e-03 | 37 |
| GO:007189713 | Endometrium | EEC | DNA biosynthetic process | 39/2168 | 180/18723 | 7.68e-05 | 1.11e-03 | 39 |
| GO:007189710 | Esophagus | HGIN | DNA biosynthetic process | 44/2587 | 180/18723 | 8.97e-05 | 1.96e-03 | 44 |
| GO:007189716 | Esophagus | ESCC | DNA biosynthetic process | 127/8552 | 180/18723 | 1.04e-11 | 3.85e-10 | 127 |
| GO:00063012 | Esophagus | ESCC | postreplication repair | 26/8552 | 31/18723 | 1.32e-05 | 1.21e-04 | 26 |
| GO:0019985 | Esophagus | ESCC | translesion synthesis | 17/8552 | 21/18723 | 1.03e-03 | 5.19e-03 | 17 |
| GO:0006301 | Liver | Cirrhotic | postreplication repair | 15/4634 | 31/18723 | 3.68e-03 | 2.02e-02 | 15 |
| GO:00718975 | Liver | HCC | DNA biosynthetic process | 99/7958 | 180/18723 | 4.66e-04 | 3.08e-03 | 99 |
| GO:00718979 | Oral cavity | OSCC | DNA biosynthetic process | 106/7305 | 180/18723 | 4.86e-08 | 8.95e-07 | 106 |
| GO:00063011 | Oral cavity | OSCC | postreplication repair | 20/7305 | 31/18723 | 3.57e-03 | 1.49e-02 | 20 |
| GO:007189715 | Oral cavity | LP | DNA biosynthetic process | 71/4623 | 180/18723 | 8.04e-06 | 1.52e-04 | 71 |
| GO:00718974 | Stomach | CAG with IM | DNA biosynthetic process | 19/1050 | 180/18723 | 6.02e-03 | 4.63e-02 | 19 |
| GO:007189711 | Stomach | CSG | DNA biosynthetic process | 19/1034 | 180/18723 | 5.12e-03 | 4.17e-02 | 19 |
| GO:0071897110 | Thyroid | PTC | DNA biosynthetic process | 82/5968 | 180/18723 | 7.98e-05 | 6.81e-04 | 82 |
| GO:00063013 | Thyroid | PTC | postreplication repair | 17/5968 | 31/18723 | 6.74e-03 | 2.90e-02 | 17 |
| GO:007189723 | Thyroid | ATC | DNA biosynthetic process | 91/6293 | 180/18723 | 1.84e-06 | 2.24e-05 | 91 |
| GO:000630111 | Thyroid | ATC | postreplication repair | 18/6293 | 31/18723 | 4.45e-03 | 1.84e-02 | 18 |
| Page: 1 |
| Pathway ID | Tissue | Disease Stage | Description | Gene Ratio | Bg Ratio | pvalue | p.adjust | qvalue | Count |
| Page: 1 |
Top |
Cell-cell communication analysis |
| Identification of potential cell-cell interactions between two cell types and their ligand-receptor pairs for different disease states |
| Ligand | Receptor | LRpair | Pathway | Tissue | Disease Stage |
| Page: 1 |
Top |
Single-cell gene regulatory network inference analysis |
| Find out the significant the regulons (TFs) and the target genes of each regulon across cell types for different disease states |
| TF | Cell Type | Tissue | Disease Stage | Target Gene | RSS | Regulon Activity |
| ∗The dot plots of a searched regulon are shown for all cell subpopulations in each disease state of each tissue based on the regulon specific score inferred using pySCENIC and by calculating the average expression. |
| Page: 1 |
Top |
Somatic mutation of malignant transformation related genes |
| Annotation of somatic variants for genes involved in malignant transformation |
| Hugo Symbol | Variant Class | Variant Classification | dbSNP RS | HGVSc | HGVSp | HGVSp Short | SWISSPROT | BIOTYPE | SIFT | PolyPhen | Tumor Sample Barcode | Tissue | Histology | Sex | Age | Stage | Therapy Types | Drugs | Outcome |
| FAAP20 | deletion | Frame_Shift_Del | novel | c.88_92delCTGAA | p.Leu30ValfsTer95 | p.L30Vfs*95 | protein_coding | TCGA-B6-A0IK-01 | Breast | breast invasive carcinoma | Female | <65 | III/IV | Unknown | Unknown | PD | |||
| FAAP20 | SNV | Missense_Mutation | c.352N>G | p.Pro118Ala | p.P118A | protein_coding | probably_damaging(0.916) | TCGA-AA-3982-01 | Colorectum | colon adenocarcinoma | Male | >=65 | III/IV | Unknown | Unknown | SD | |||
| FAAP20 | SNV | Missense_Mutation | rs754746314 | c.565N>A | p.Ala189Thr | p.A189T | protein_coding | possibly_damaging(0.488) | TCGA-A5-A2K5-01 | Endometrium | uterine corpus endometrioid carcinoma | Female | >=65 | I/II | Unknown | Unknown | SD | ||
| FAAP20 | SNV | Missense_Mutation | c.509N>A | p.Arg170Gln | p.R170Q | protein_coding | benign(0.186) | TCGA-AP-A0LM-01 | Endometrium | uterine corpus endometrioid carcinoma | Female | <65 | III/IV | Chemotherapy | cisplatin | SD | |||
| FAAP20 | SNV | Missense_Mutation | novel | c.412N>C | p.Trp138Arg | p.W138R | protein_coding | benign(0) | TCGA-B5-A3FA-01 | Endometrium | uterine corpus endometrioid carcinoma | Female | >=65 | I/II | Unknown | Unknown | SD | ||
| FAAP20 | SNV | Missense_Mutation | rs754595816 | c.539N>T | p.Pro180Leu | p.P180L | protein_coding | benign(0) | TCGA-D1-A174-01 | Endometrium | uterine corpus endometrioid carcinoma | Female | <65 | I/II | Unknown | Unknown | SD | ||
| FAAP20 | SNV | Missense_Mutation | novel | c.290N>A | p.Arg97Gln | p.R97Q | protein_coding | benign(0.003) | TCGA-DF-A2KU-01 | Endometrium | uterine corpus endometrioid carcinoma | Female | Unknown | I/II | Unknown | Unknown | SD | ||
| FAAP20 | SNV | Missense_Mutation | novel | c.439G>A | p.Gly147Ser | p.G147S | protein_coding | possibly_damaging(0.871) | TCGA-FI-A2D5-01 | Endometrium | uterine corpus endometrioid carcinoma | Female | <65 | III/IV | Chemotherapy | carboplatinum | PD | ||
| FAAP20 | deletion | Frame_Shift_Del | novel | c.387delC | p.Tyr130ThrfsTer160 | p.Y130Tfs*160 | protein_coding | TCGA-BS-A0UA-01 | Endometrium | uterine corpus endometrioid carcinoma | Female | >=65 | I/II | Unknown | Unknown | PD | |||
| FAAP20 | deletion | Frame_Shift_Del | novel | c.387delN | p.Tyr130ThrfsTer160 | p.Y130Tfs*160 | protein_coding | TCGA-D1-A174-01 | Endometrium | uterine corpus endometrioid carcinoma | Female | <65 | I/II | Unknown | Unknown | SD |
| Page: 1 2 |
Top |
Related drugs of malignant transformation related genes |
| Identification of chemicals and drugs interact with genes involved in malignant transfromation |
| (DGIdb 4.0) |
| Entrez ID | Symbol | Category | Interaction Types | Drug Claim Name | Drug Name | PMIDs |
| Page: 1 |

Copyright 2023-Present -The University of Texas Health Science Center at Houston |