
|
|||||
|
 | |
| |
| |
| |
| |
| |
|
Gene: FAAH2 |
Gene summary for FAAH2 |
| Gene information | Species | Human | Gene symbol | FAAH2 | Gene ID | 158584 |
| Gene name | fatty acid amide hydrolase 2 | |
| Gene Alias | AMDD | |
| Cytomap | Xp11.21 | |
| Gene Type | protein-coding | GO ID | GO:0001676 | UniProtAcc | B2C6G4 |
Top |
Malignant transformation analysis |
| Identification of the aberrant gene expression in precancerous and cancerous lesions by comparing the gene expression of stem-like cells in diseased tissues with normal stem cells |
| Entrez ID | Symbol | Replicates | Species | Organ | Tissue | Adj P-value | Log2FC | Malignancy |
| 158584 | FAAH2 | CCI_1 | Human | Cervix | CC | 3.53e-02 | 5.59e-01 | 0.528 |
| 158584 | FAAH2 | CCI_2 | Human | Cervix | CC | 5.10e-13 | 7.45e-01 | 0.5249 |
| 158584 | FAAH2 | CCI_3 | Human | Cervix | CC | 3.60e-16 | 6.71e-01 | 0.516 |
| 158584 | FAAH2 | HTA11_3410_2000001011 | Human | Colorectum | AD | 7.61e-13 | -5.83e-01 | 0.0155 |
| 158584 | FAAH2 | HTA11_2487_2000001011 | Human | Colorectum | SER | 4.16e-07 | -5.80e-01 | -0.1808 |
| 158584 | FAAH2 | HTA11_3361_2000001011 | Human | Colorectum | AD | 7.16e-06 | -6.67e-01 | -0.1207 |
| 158584 | FAAH2 | HTA11_696_2000001011 | Human | Colorectum | AD | 1.14e-12 | -5.22e-01 | -0.1464 |
| 158584 | FAAH2 | HTA11_866_2000001011 | Human | Colorectum | AD | 1.31e-03 | -3.24e-01 | -0.1001 |
| 158584 | FAAH2 | HTA11_1391_2000001011 | Human | Colorectum | AD | 1.65e-04 | -4.60e-01 | -0.059 |
| 158584 | FAAH2 | HTA11_5212_2000001011 | Human | Colorectum | AD | 4.19e-03 | -6.87e-01 | -0.2061 |
| 158584 | FAAH2 | HTA11_10711_2000001011 | Human | Colorectum | AD | 8.06e-03 | -5.34e-01 | 0.0338 |
| 158584 | FAAH2 | HTA11_7696_3000711011 | Human | Colorectum | AD | 3.17e-04 | -3.68e-01 | 0.0674 |
| 158584 | FAAH2 | HTA11_99999970781_79442 | Human | Colorectum | MSS | 7.20e-04 | -3.52e-01 | 0.294 |
| 158584 | FAAH2 | HTA11_99999971662_82457 | Human | Colorectum | MSS | 2.81e-05 | -3.82e-01 | 0.3859 |
| 158584 | FAAH2 | HTA11_99999974143_84620 | Human | Colorectum | MSS | 4.10e-10 | -4.67e-01 | 0.3005 |
| 158584 | FAAH2 | A015-C-203 | Human | Colorectum | FAP | 1.30e-30 | 1.77e-02 | -0.1294 |
| 158584 | FAAH2 | A015-C-204 | Human | Colorectum | FAP | 7.74e-06 | 9.52e-02 | -0.0228 |
| 158584 | FAAH2 | A014-C-040 | Human | Colorectum | FAP | 2.57e-03 | 2.51e-02 | -0.1184 |
| 158584 | FAAH2 | A002-C-201 | Human | Colorectum | FAP | 3.19e-08 | -6.07e-02 | 0.0324 |
| 158584 | FAAH2 | A001-C-119 | Human | Colorectum | FAP | 2.87e-03 | -1.53e-01 | -0.1557 |
| Page: 1 2 3 4 |
| Tissue | Expression Dynamics | Abbreviation |
| Cervix | 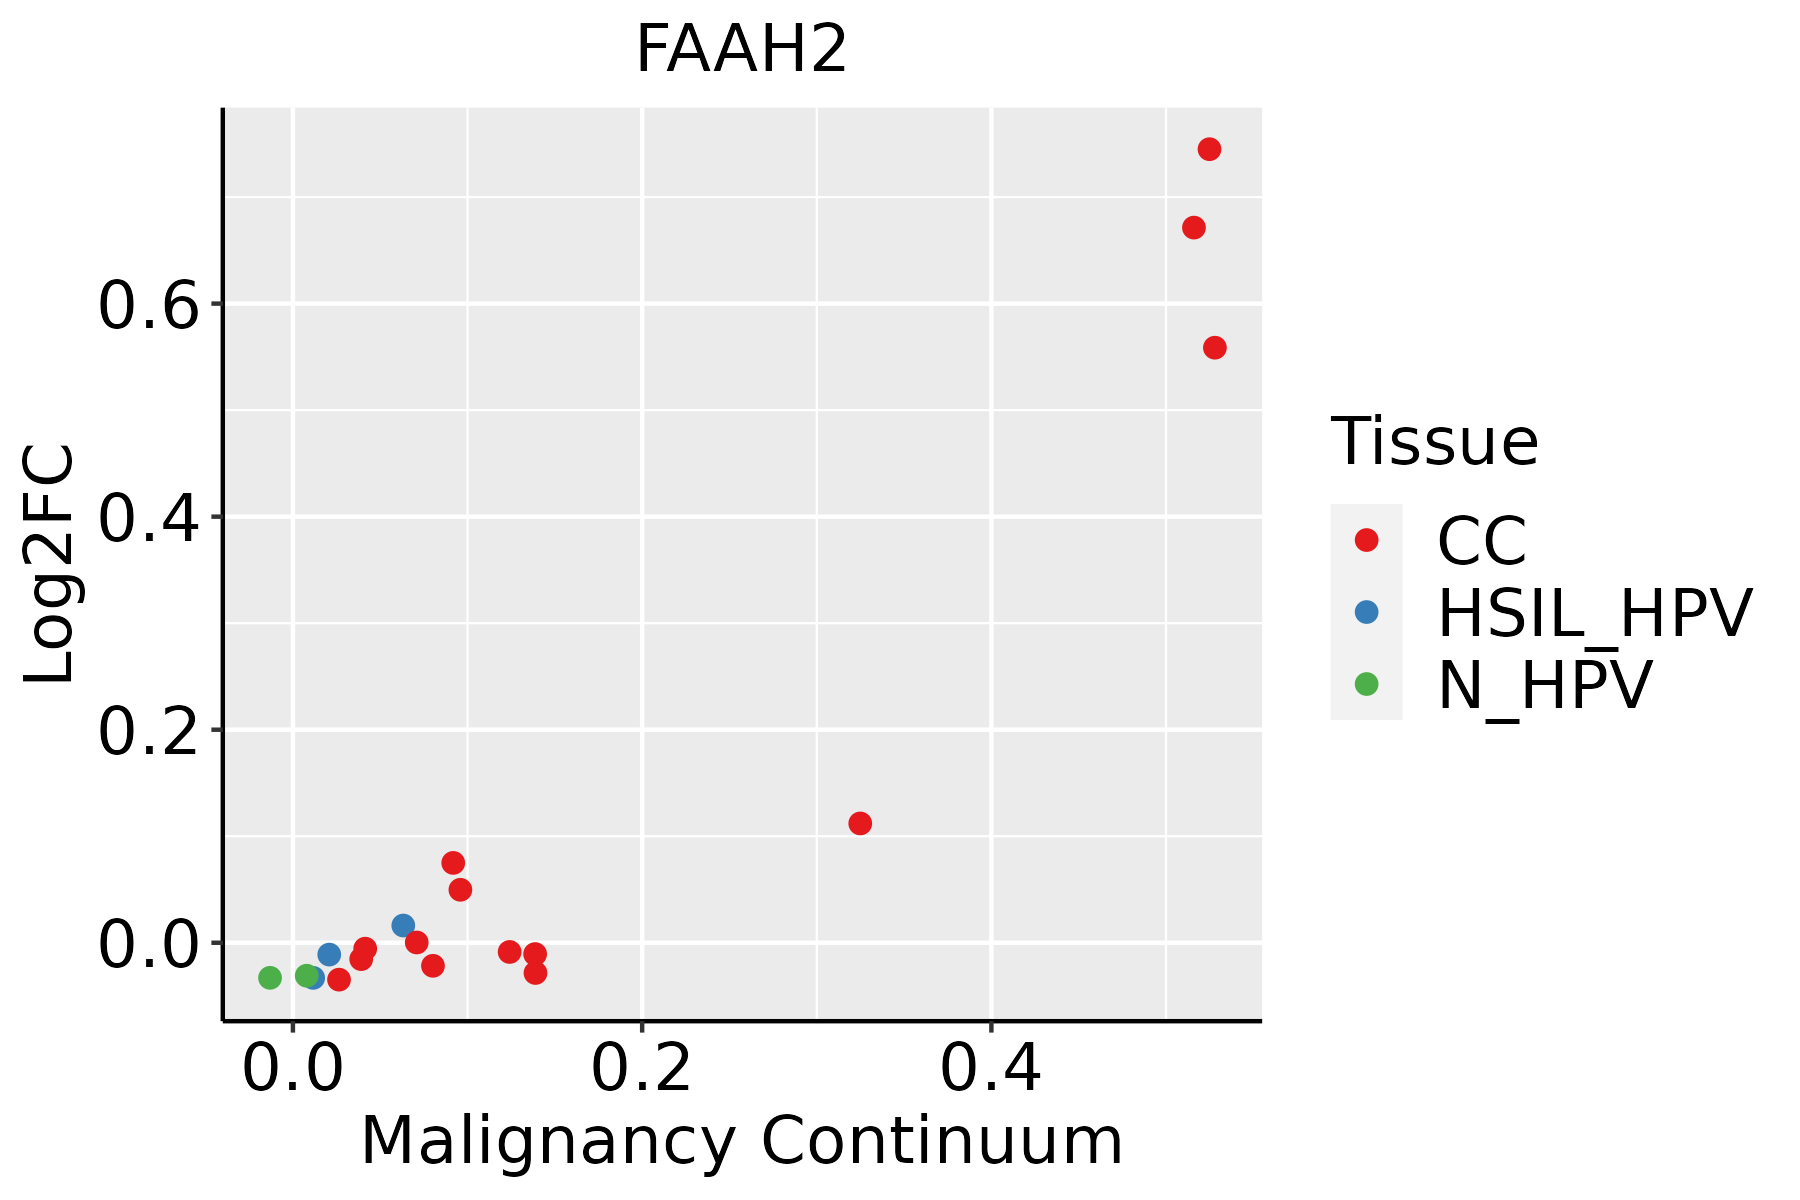 | CC: Cervix cancer |
| HSIL_HPV: HPV-infected high-grade squamous intraepithelial lesions | ||
| N_HPV: HPV-infected normal cervix | ||
| Colorectum (GSE201348) |  | FAP: Familial adenomatous polyposis |
| CRC: Colorectal cancer | ||
| Colorectum (HTA11) |  | AD: Adenomas |
| SER: Sessile serrated lesions | ||
| MSI-H: Microsatellite-high colorectal cancer | ||
| MSS: Microsatellite stable colorectal cancer | ||
| Endometrium | 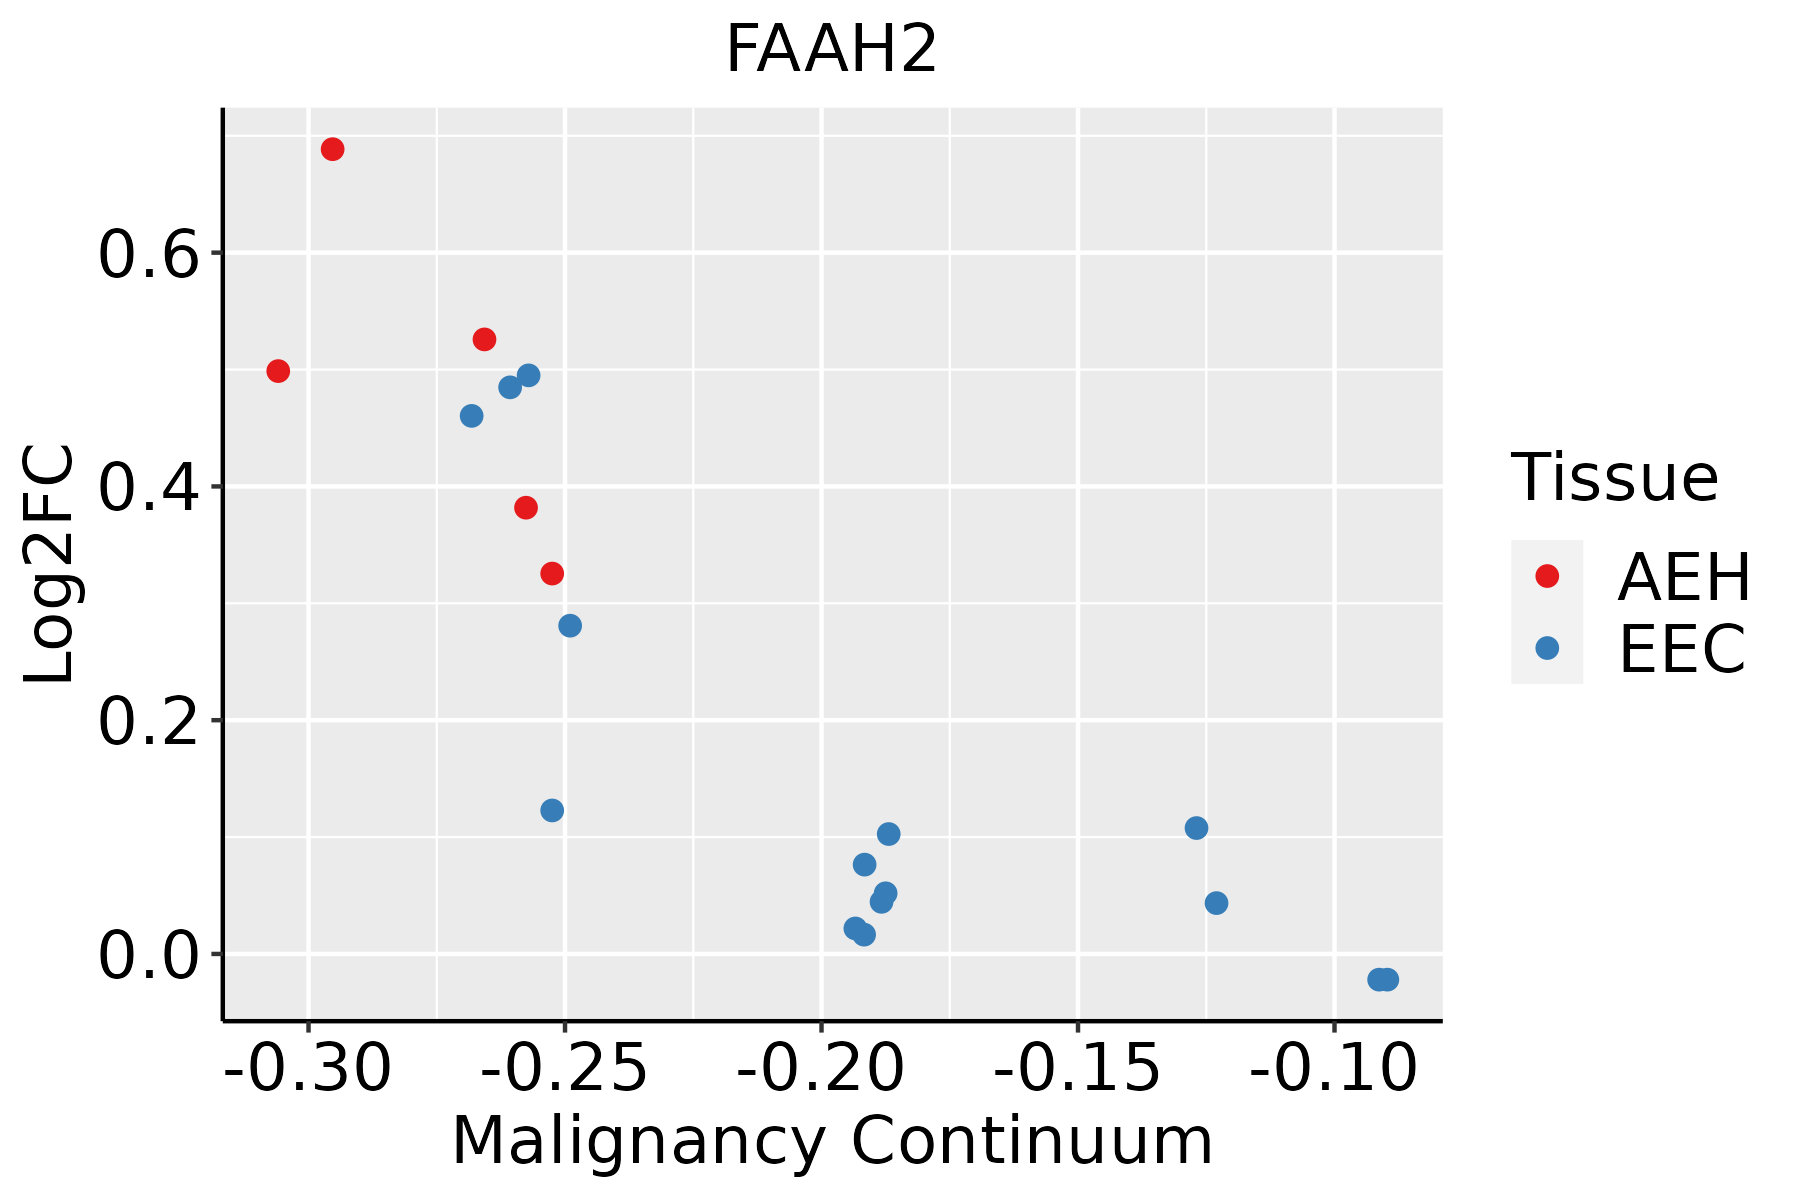 | AEH: Atypical endometrial hyperplasia |
| EEC: Endometrioid Cancer | ||
| Lung | 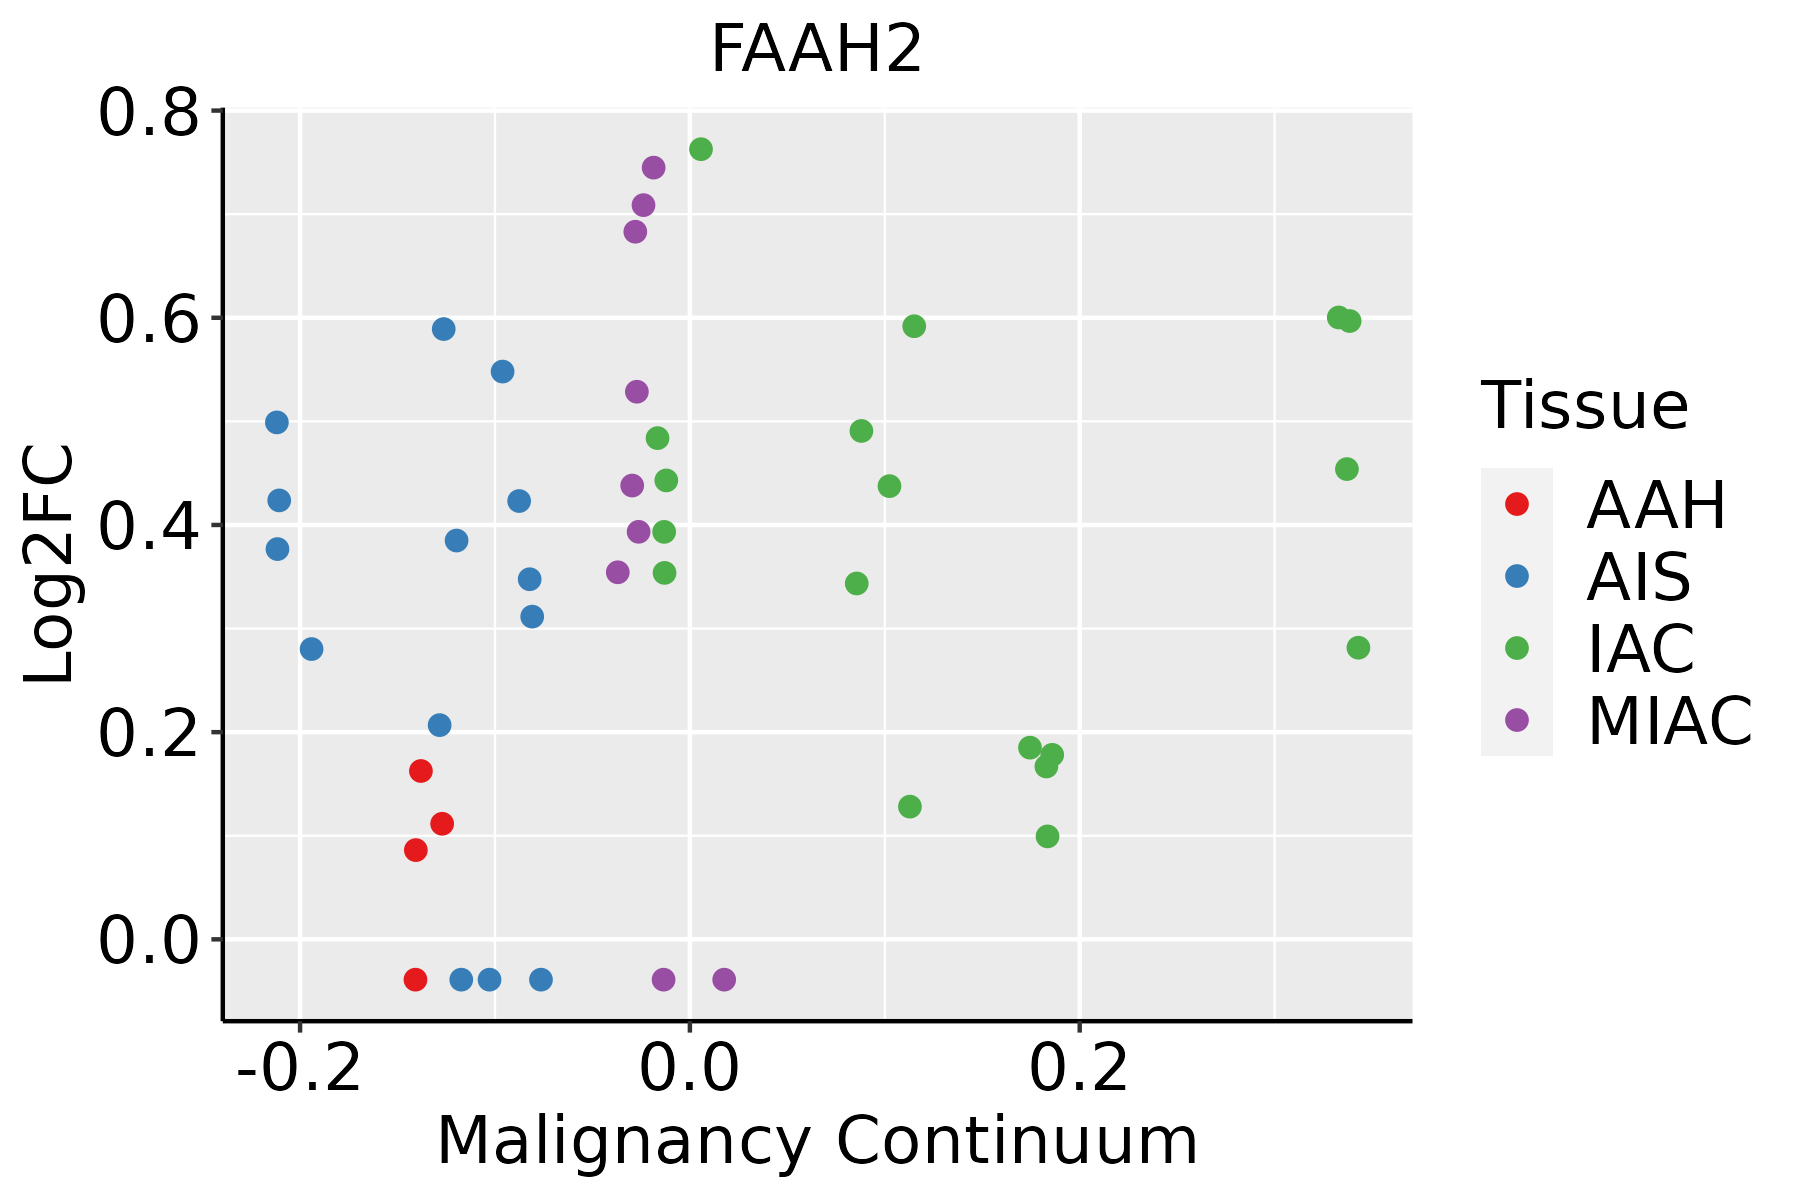 | AAH: Atypical adenomatous hyperplasia |
| AIS: Adenocarcinoma in situ | ||
| IAC: Invasive lung adenocarcinoma | ||
| MIA: Minimally invasive adenocarcinoma |
| ∗log2FC in expression of this searched gene in stem-like cells from each diseased tissue sample relative to stem-like cells in normal samples in each tissue plotted against the malignancy continuum. Samples are colored based on if they are from different disease stage. |
Top |
Malignant transformation related pathway analysis |
| Find out the enriched GO biological processes and KEGG pathways involved in transition from healthy to precancer to cancer |
| Tissue | Disease Stage | Enriched GO biological Processes |
| Colorectum | AD |  |
| Colorectum | SER |  |
| Colorectum | MSS |  |
| Colorectum | MSI-H |  |
| Colorectum | FAP |  |
| ∗Top 15 enriched GO BP terms are showed in the bar plot of each disease state in each tissue. Each row represents a significant GO biological process which is colored according to the -log10(p.adjust). |
| Page: 1 2 3 4 5 6 7 8 9 |
| GO ID | Tissue | Disease Stage | Description | Gene Ratio | Bg Ratio | pvalue | p.adjust | Count |
| GO:0016042 | Colorectum | AD | lipid catabolic process | 97/3918 | 320/18723 | 4.31e-05 | 7.56e-04 | 97 |
| GO:0006631 | Colorectum | AD | fatty acid metabolic process | 114/3918 | 390/18723 | 5.58e-05 | 9.44e-04 | 114 |
| GO:00160421 | Colorectum | SER | lipid catabolic process | 77/2897 | 320/18723 | 3.52e-05 | 9.18e-04 | 77 |
| GO:00066311 | Colorectum | SER | fatty acid metabolic process | 79/2897 | 390/18723 | 6.34e-03 | 4.56e-02 | 79 |
| GO:00066312 | Colorectum | MSS | fatty acid metabolic process | 95/3467 | 390/18723 | 2.20e-03 | 1.84e-02 | 95 |
| GO:00160422 | Colorectum | MSS | lipid catabolic process | 77/3467 | 320/18723 | 7.43e-03 | 4.71e-02 | 77 |
| GO:00066313 | Colorectum | FAP | fatty acid metabolic process | 81/2622 | 390/18723 | 1.43e-04 | 2.24e-03 | 81 |
| GO:00160423 | Colorectum | FAP | lipid catabolic process | 65/2622 | 320/18723 | 1.13e-03 | 1.08e-02 | 65 |
| GO:00066314 | Colorectum | CRC | fatty acid metabolic process | 65/2078 | 390/18723 | 5.30e-04 | 7.42e-03 | 65 |
| GO:00160424 | Colorectum | CRC | lipid catabolic process | 53/2078 | 320/18723 | 1.89e-03 | 1.93e-02 | 53 |
| Page: 1 |
| Pathway ID | Tissue | Disease Stage | Description | Gene Ratio | Bg Ratio | pvalue | p.adjust | qvalue | Count |
| Page: 1 |
Top |
Cell-cell communication analysis |
| Identification of potential cell-cell interactions between two cell types and their ligand-receptor pairs for different disease states |
| Ligand | Receptor | LRpair | Pathway | Tissue | Disease Stage |
| Page: 1 |
Top |
Single-cell gene regulatory network inference analysis |
| Find out the significant the regulons (TFs) and the target genes of each regulon across cell types for different disease states |
| TF | Cell Type | Tissue | Disease Stage | Target Gene | RSS | Regulon Activity |
| ∗The dot plots of a searched regulon are shown for all cell subpopulations in each disease state of each tissue based on the regulon specific score inferred using pySCENIC and by calculating the average expression. |
| Page: 1 |
Top |
Somatic mutation of malignant transformation related genes |
| Annotation of somatic variants for genes involved in malignant transformation |
| Hugo Symbol | Variant Class | Variant Classification | dbSNP RS | HGVSc | HGVSp | HGVSp Short | SWISSPROT | BIOTYPE | SIFT | PolyPhen | Tumor Sample Barcode | Tissue | Histology | Sex | Age | Stage | Therapy Types | Drugs | Outcome |
| FAAH2 | SNV | Missense_Mutation | c.873C>G | p.Ile291Met | p.I291M | Q6GMR7 | protein_coding | tolerated(0.14) | possibly_damaging(0.832) | TCGA-EK-A3GJ-01 | Cervix | cervical & endocervical cancer | Female | <65 | I/II | Unknown | Unknown | SD | |
| FAAH2 | SNV | Missense_Mutation | c.1036N>G | p.Gln346Glu | p.Q346E | Q6GMR7 | protein_coding | tolerated(0.2) | benign(0.028) | TCGA-VS-A953-01 | Cervix | cervical & endocervical cancer | Female | <65 | I/II | Unknown | Unknown | PD | |
| FAAH2 | SNV | Missense_Mutation | c.344C>A | p.Ala115Asp | p.A115D | Q6GMR7 | protein_coding | tolerated(0.59) | benign(0.006) | TCGA-AA-3815-01 | Colorectum | colon adenocarcinoma | Female | >=65 | I/II | Unknown | Unknown | SD | |
| FAAH2 | SNV | Missense_Mutation | c.977N>G | p.Leu326Arg | p.L326R | Q6GMR7 | protein_coding | deleterious(0) | probably_damaging(0.949) | TCGA-D5-6530-01 | Colorectum | colon adenocarcinoma | Male | <65 | I/II | Unknown | Unknown | SD | |
| FAAH2 | SNV | Missense_Mutation | c.1321G>T | p.Asp441Tyr | p.D441Y | Q6GMR7 | protein_coding | deleterious(0) | possibly_damaging(0.793) | TCGA-G4-6315-01 | Colorectum | colon adenocarcinoma | Male | >=65 | III/IV | Chemotherapy | fluorouracil | SD | |
| FAAH2 | SNV | Missense_Mutation | c.1237N>A | p.Leu413Met | p.L413M | Q6GMR7 | protein_coding | tolerated(0.22) | possibly_damaging(0.574) | TCGA-DY-A1DG-01 | Colorectum | rectum adenocarcinoma | Male | >=65 | I/II | Unknown | Unknown | PD | |
| FAAH2 | SNV | Missense_Mutation | rs749206936 | c.695G>A | p.Arg232Gln | p.R232Q | Q6GMR7 | protein_coding | deleterious(0) | probably_damaging(1) | TCGA-EI-6917-01 | Colorectum | rectum adenocarcinoma | Male | <65 | III/IV | Chemotherapy | 5fluorouracil+oxaciplatina+l-folinian | SD |
| FAAH2 | SNV | Missense_Mutation | novel | c.917N>C | p.Lys306Thr | p.K306T | Q6GMR7 | protein_coding | deleterious(0) | possibly_damaging(0.733) | TCGA-F5-6814-01 | Colorectum | rectum adenocarcinoma | Male | <65 | I/II | Unknown | Unknown | SD |
| FAAH2 | SNV | Missense_Mutation | novel | c.1347N>A | p.Phe449Leu | p.F449L | Q6GMR7 | protein_coding | tolerated(1) | benign(0.009) | TCGA-F5-6814-01 | Colorectum | rectum adenocarcinoma | Male | <65 | I/II | Unknown | Unknown | SD |
| FAAH2 | SNV | Missense_Mutation | c.1342G>C | p.Val448Leu | p.V448L | Q6GMR7 | protein_coding | deleterious(0.03) | possibly_damaging(0.802) | TCGA-A5-A0R9-01 | Endometrium | uterine corpus endometrioid carcinoma | Female | <65 | I/II | Unknown | Unknown | SD |
| Page: 1 2 3 4 5 6 7 |
Top |
Related drugs of malignant transformation related genes |
| Identification of chemicals and drugs interact with genes involved in malignant transfromation |
| (DGIdb 4.0) |
| Entrez ID | Symbol | Category | Interaction Types | Drug Claim Name | Drug Name | PMIDs |
| 158584 | FAAH2 | DRUGGABLE GENOME, ENZYME | inhibitor | 310264767 | ||
| 158584 | FAAH2 | DRUGGABLE GENOME, ENZYME | inhibitor | 178101919 | ||
| 158584 | FAAH2 | DRUGGABLE GENOME, ENZYME | inhibitor | 381744930 | ||
| 158584 | FAAH2 | DRUGGABLE GENOME, ENZYME | inhibitor | 178101156 | URB-597 | |
| 158584 | FAAH2 | DRUGGABLE GENOME, ENZYME | inhibitor | 178101892 |
| Page: 1 |

Copyright 2023-Present -The University of Texas Health Science Center at Houston |