
|
|||||
|
 | |
| |
| |
| |
| |
| |
|
Gene: FAAH |
Gene summary for FAAH |
| Gene information | Species | Human | Gene symbol | FAAH | Gene ID | 2166 |
| Gene name | fatty acid amide hydrolase | |
| Gene Alias | FAAH-1 | |
| Cytomap | 1p33 | |
| Gene Type | protein-coding | GO ID | GO:0001676 | UniProtAcc | O00519 |
Top |
Malignant transformation analysis |
| Identification of the aberrant gene expression in precancerous and cancerous lesions by comparing the gene expression of stem-like cells in diseased tissues with normal stem cells |
| Entrez ID | Symbol | Replicates | Species | Organ | Tissue | Adj P-value | Log2FC | Malignancy |
| 2166 | FAAH | LZE20T | Human | Esophagus | ESCC | 1.06e-02 | 1.00e-01 | 0.0662 |
| 2166 | FAAH | LZE24T | Human | Esophagus | ESCC | 2.58e-11 | 1.71e-01 | 0.0596 |
| 2166 | FAAH | P1T-E | Human | Esophagus | ESCC | 7.50e-05 | 1.99e-01 | 0.0875 |
| 2166 | FAAH | P2T-E | Human | Esophagus | ESCC | 4.96e-10 | 1.81e-01 | 0.1177 |
| 2166 | FAAH | P4T-E | Human | Esophagus | ESCC | 5.05e-08 | 1.08e-01 | 0.1323 |
| 2166 | FAAH | P8T-E | Human | Esophagus | ESCC | 9.65e-20 | 3.22e-01 | 0.0889 |
| 2166 | FAAH | P10T-E | Human | Esophagus | ESCC | 2.25e-20 | 3.82e-01 | 0.116 |
| 2166 | FAAH | P12T-E | Human | Esophagus | ESCC | 3.37e-16 | 2.73e-01 | 0.1122 |
| 2166 | FAAH | P15T-E | Human | Esophagus | ESCC | 4.40e-12 | 1.72e-01 | 0.1149 |
| 2166 | FAAH | P16T-E | Human | Esophagus | ESCC | 1.99e-07 | 7.27e-02 | 0.1153 |
| 2166 | FAAH | P17T-E | Human | Esophagus | ESCC | 5.57e-08 | 2.58e-01 | 0.1278 |
| 2166 | FAAH | P20T-E | Human | Esophagus | ESCC | 2.77e-05 | 1.24e-01 | 0.1124 |
| 2166 | FAAH | P21T-E | Human | Esophagus | ESCC | 3.24e-25 | 5.66e-01 | 0.1617 |
| 2166 | FAAH | P23T-E | Human | Esophagus | ESCC | 1.93e-10 | 2.14e-01 | 0.108 |
| 2166 | FAAH | P24T-E | Human | Esophagus | ESCC | 3.58e-05 | 9.78e-02 | 0.1287 |
| 2166 | FAAH | P27T-E | Human | Esophagus | ESCC | 3.48e-31 | 5.48e-01 | 0.1055 |
| 2166 | FAAH | P30T-E | Human | Esophagus | ESCC | 3.24e-14 | 3.96e-01 | 0.137 |
| 2166 | FAAH | P31T-E | Human | Esophagus | ESCC | 3.90e-17 | 2.39e-01 | 0.1251 |
| 2166 | FAAH | P36T-E | Human | Esophagus | ESCC | 1.69e-07 | 3.13e-01 | 0.1187 |
| 2166 | FAAH | P40T-E | Human | Esophagus | ESCC | 2.57e-05 | 1.00e-01 | 0.109 |
| Page: 1 2 3 |
| Tissue | Expression Dynamics | Abbreviation |
| Esophagus | 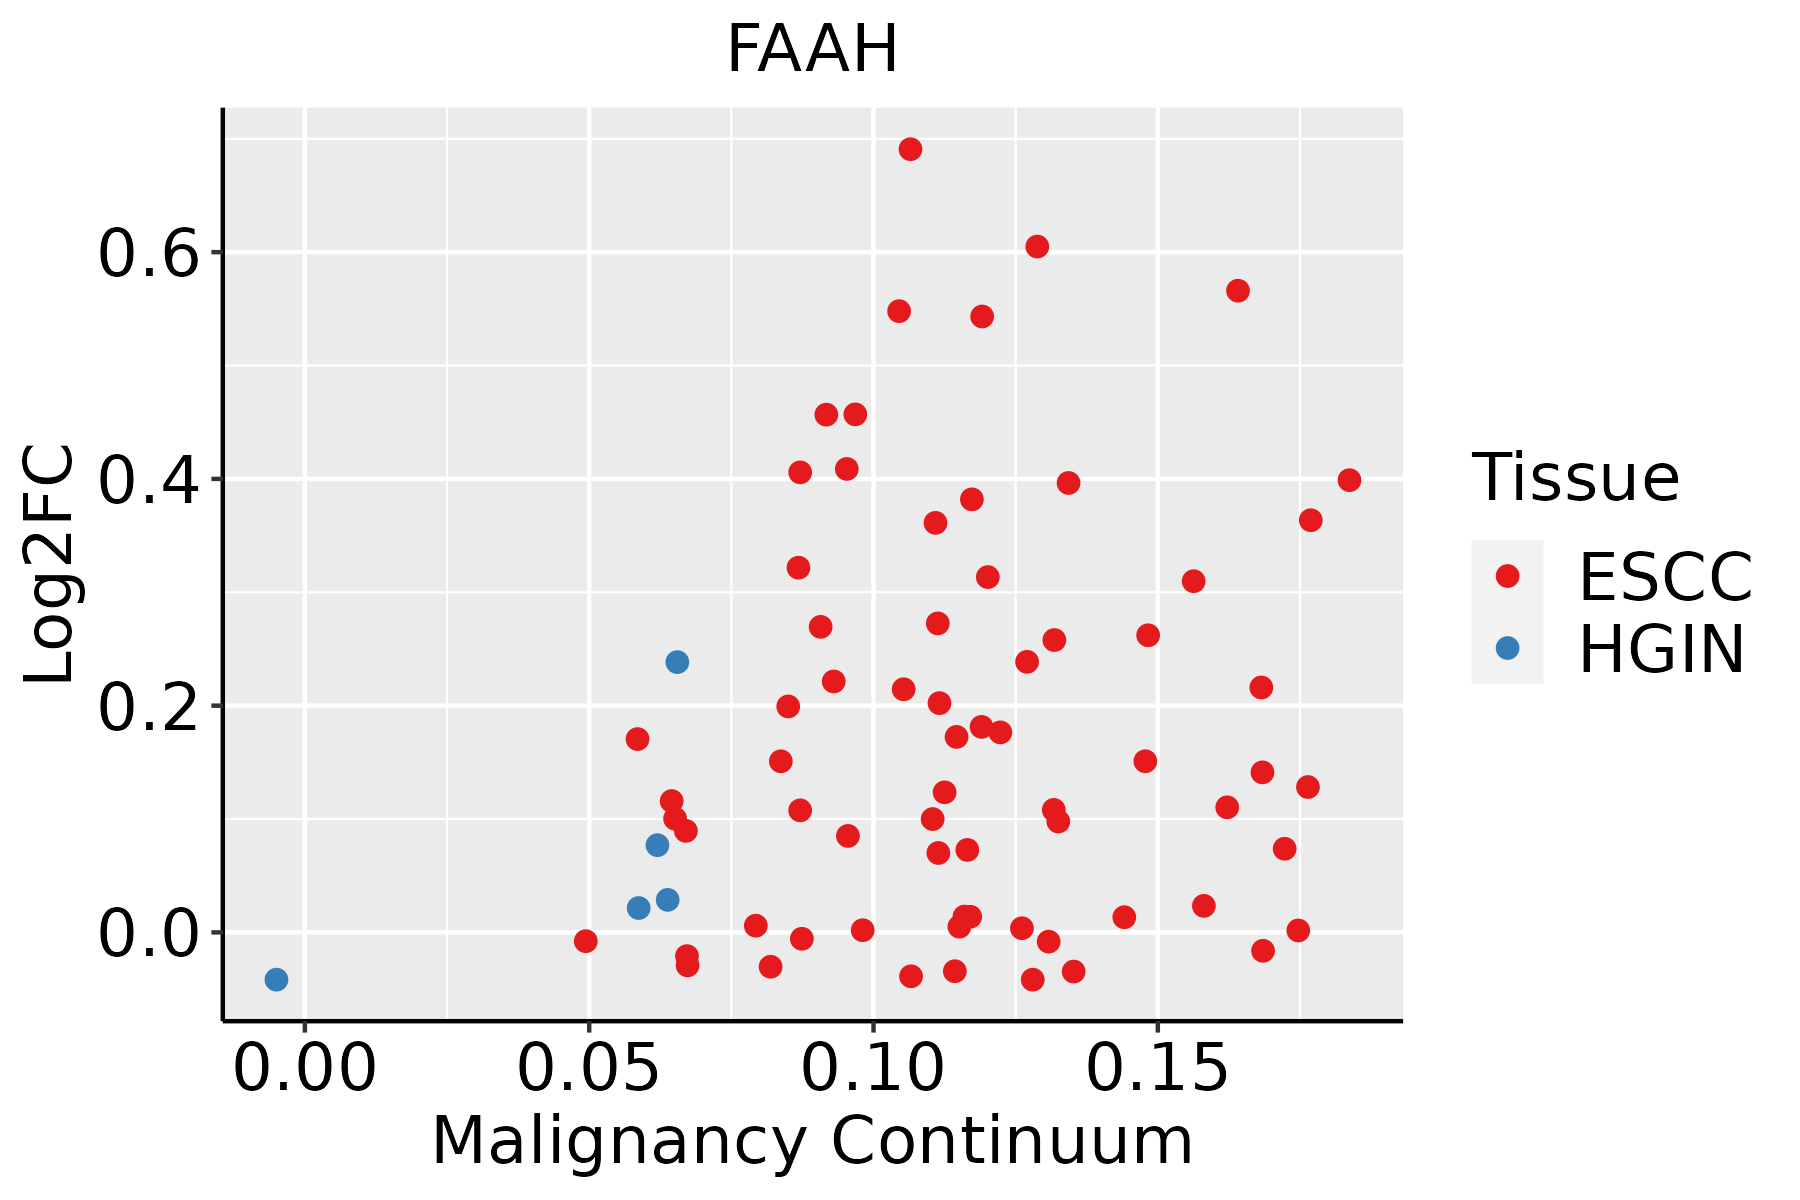 | ESCC: Esophageal squamous cell carcinoma |
| HGIN: High-grade intraepithelial neoplasias | ||
| LGIN: Low-grade intraepithelial neoplasias | ||
| Oral Cavity |  | EOLP: Erosive Oral lichen planus |
| LP: leukoplakia | ||
| NEOLP: Non-erosive oral lichen planus | ||
| OSCC: Oral squamous cell carcinoma | ||
| Prostate |  | BPH: Benign Prostatic Hyperplasia |
| Thyroid | 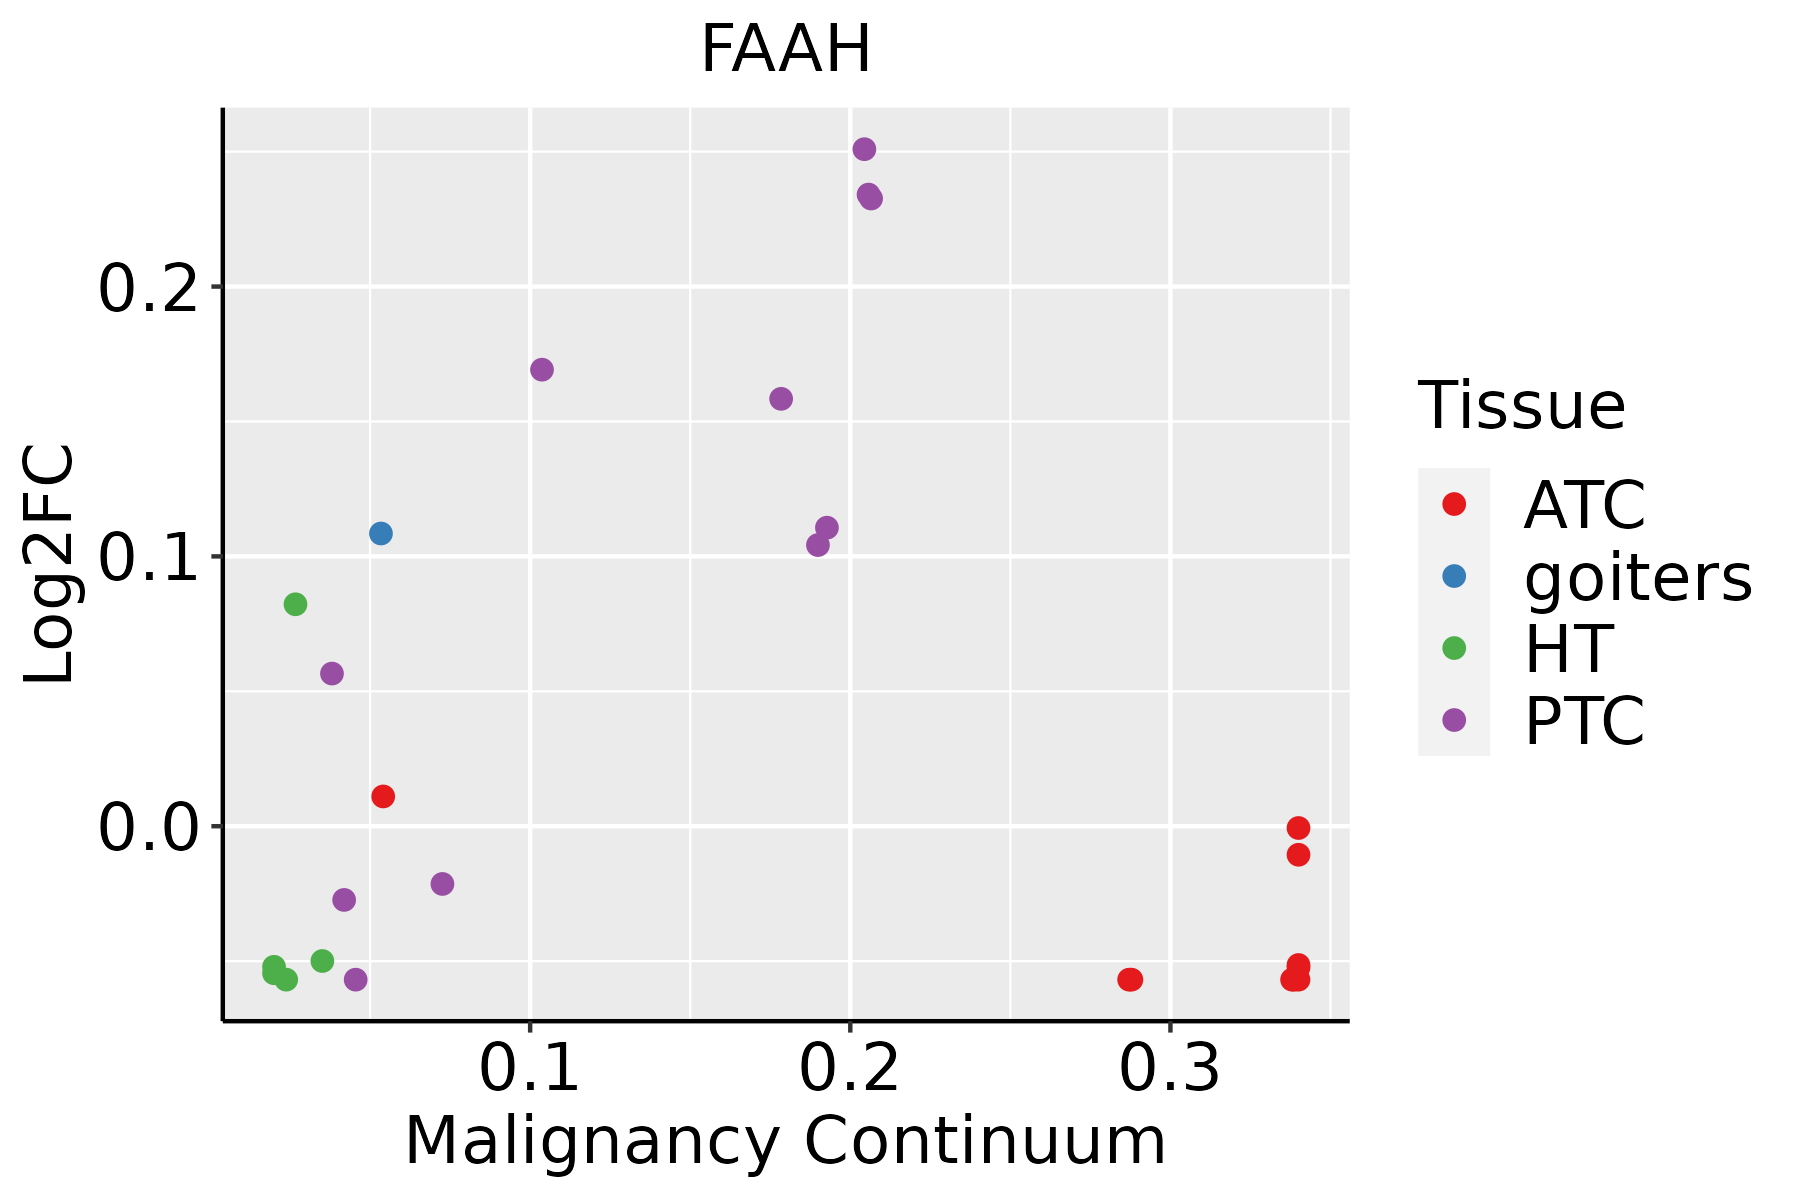 | ATC: Anaplastic thyroid cancer |
| HT: Hashimoto's thyroiditis | ||
| PTC: Papillary thyroid cancer |
| ∗log2FC in expression of this searched gene in stem-like cells from each diseased tissue sample relative to stem-like cells in normal samples in each tissue plotted against the malignancy continuum. Samples are colored based on if they are from different disease stage. |
Top |
Malignant transformation related pathway analysis |
| Find out the enriched GO biological processes and KEGG pathways involved in transition from healthy to precancer to cancer |
| Tissue | Disease Stage | Enriched GO biological Processes |
| Colorectum | AD |  |
| Colorectum | SER |  |
| Colorectum | MSS |  |
| Colorectum | MSI-H |  |
| Colorectum | FAP |  |
| ∗Top 15 enriched GO BP terms are showed in the bar plot of each disease state in each tissue. Each row represents a significant GO biological process which is colored according to the -log10(p.adjust). |
| Page: 1 2 3 4 5 6 7 8 9 |
| GO ID | Tissue | Disease Stage | Description | Gene Ratio | Bg Ratio | pvalue | p.adjust | Count |
| GO:0016042 | Colorectum | AD | lipid catabolic process | 97/3918 | 320/18723 | 4.31e-05 | 7.56e-04 | 97 |
| GO:0006631 | Colorectum | AD | fatty acid metabolic process | 114/3918 | 390/18723 | 5.58e-05 | 9.44e-04 | 114 |
| GO:00160421 | Colorectum | SER | lipid catabolic process | 77/2897 | 320/18723 | 3.52e-05 | 9.18e-04 | 77 |
| GO:00066311 | Colorectum | SER | fatty acid metabolic process | 79/2897 | 390/18723 | 6.34e-03 | 4.56e-02 | 79 |
| GO:00066312 | Colorectum | MSS | fatty acid metabolic process | 95/3467 | 390/18723 | 2.20e-03 | 1.84e-02 | 95 |
| GO:00160422 | Colorectum | MSS | lipid catabolic process | 77/3467 | 320/18723 | 7.43e-03 | 4.71e-02 | 77 |
| GO:00066313 | Colorectum | FAP | fatty acid metabolic process | 81/2622 | 390/18723 | 1.43e-04 | 2.24e-03 | 81 |
| GO:00160423 | Colorectum | FAP | lipid catabolic process | 65/2622 | 320/18723 | 1.13e-03 | 1.08e-02 | 65 |
| GO:00066314 | Colorectum | CRC | fatty acid metabolic process | 65/2078 | 390/18723 | 5.30e-04 | 7.42e-03 | 65 |
| GO:00160424 | Colorectum | CRC | lipid catabolic process | 53/2078 | 320/18723 | 1.89e-03 | 1.93e-02 | 53 |
| GO:00090628 | Esophagus | ESCC | fatty acid catabolic process | 66/8552 | 100/18723 | 3.21e-05 | 2.66e-04 | 66 |
| GO:00066318 | Esophagus | ESCC | fatty acid metabolic process | 217/8552 | 390/18723 | 4.21e-05 | 3.39e-04 | 217 |
| GO:00723297 | Esophagus | ESCC | monocarboxylic acid catabolic process | 74/8552 | 122/18723 | 6.03e-04 | 3.27e-03 | 74 |
| GO:00464864 | Esophagus | ESCC | glycerolipid metabolic process | 211/8552 | 392/18723 | 6.51e-04 | 3.46e-03 | 211 |
| GO:00442427 | Esophagus | ESCC | cellular lipid catabolic process | 121/8552 | 214/18723 | 8.63e-04 | 4.43e-03 | 121 |
| GO:00442827 | Esophagus | ESCC | small molecule catabolic process | 201/8552 | 376/18723 | 1.35e-03 | 6.41e-03 | 201 |
| GO:00160427 | Esophagus | ESCC | lipid catabolic process | 168/8552 | 320/18723 | 7.97e-03 | 2.84e-02 | 168 |
| GO:00090627 | Oral cavity | OSCC | fatty acid catabolic process | 59/7305 | 100/18723 | 3.99e-05 | 3.48e-04 | 59 |
| GO:00066317 | Oral cavity | OSCC | fatty acid metabolic process | 186/7305 | 390/18723 | 2.65e-04 | 1.69e-03 | 186 |
| GO:00723296 | Oral cavity | OSCC | monocarboxylic acid catabolic process | 66/7305 | 122/18723 | 5.02e-04 | 2.95e-03 | 66 |
| Page: 1 2 |
| Pathway ID | Tissue | Disease Stage | Description | Gene Ratio | Bg Ratio | pvalue | p.adjust | qvalue | Count |
| Page: 1 |
Top |
Cell-cell communication analysis |
| Identification of potential cell-cell interactions between two cell types and their ligand-receptor pairs for different disease states |
| Ligand | Receptor | LRpair | Pathway | Tissue | Disease Stage |
| Page: 1 |
Top |
Single-cell gene regulatory network inference analysis |
| Find out the significant the regulons (TFs) and the target genes of each regulon across cell types for different disease states |
| TF | Cell Type | Tissue | Disease Stage | Target Gene | RSS | Regulon Activity |
| ∗The dot plots of a searched regulon are shown for all cell subpopulations in each disease state of each tissue based on the regulon specific score inferred using pySCENIC and by calculating the average expression. |
| Page: 1 |
Top |
Somatic mutation of malignant transformation related genes |
| Annotation of somatic variants for genes involved in malignant transformation |
| Hugo Symbol | Variant Class | Variant Classification | dbSNP RS | HGVSc | HGVSp | HGVSp Short | SWISSPROT | BIOTYPE | SIFT | PolyPhen | Tumor Sample Barcode | Tissue | Histology | Sex | Age | Stage | Therapy Types | Drugs | Outcome |
| FAAH | SNV | Missense_Mutation | c.926T>C | p.Val309Ala | p.V309A | O00519 | protein_coding | deleterious(0) | benign(0.242) | TCGA-A2-A0YC-01 | Breast | breast invasive carcinoma | Female | <65 | I/II | Hormone Therapy | arimidex | PD | |
| FAAH | SNV | Missense_Mutation | novel | c.296N>G | p.Thr99Ser | p.T99S | O00519 | protein_coding | tolerated(0.77) | benign(0.009) | TCGA-A2-A3Y0-01 | Breast | breast invasive carcinoma | Female | <65 | I/II | Chemotherapy | adriamycin | CR |
| FAAH | SNV | Missense_Mutation | c.942C>A | p.Phe314Leu | p.F314L | O00519 | protein_coding | deleterious(0) | probably_damaging(0.995) | TCGA-A8-A09G-01 | Breast | breast invasive carcinoma | Female | >=65 | III/IV | Unknown | Unknown | SD | |
| FAAH | SNV | Missense_Mutation | rs200701500 | c.1319C>T | p.Ser440Leu | p.S440L | O00519 | protein_coding | deleterious(0.01) | probably_damaging(0.948) | TCGA-AN-A046-01 | Breast | breast invasive carcinoma | Female | >=65 | I/II | Unknown | Unknown | SD |
| FAAH | SNV | Missense_Mutation | c.563N>T | p.Pro188Leu | p.P188L | O00519 | protein_coding | deleterious(0) | probably_damaging(0.984) | TCGA-AO-A0J8-01 | Breast | breast invasive carcinoma | Female | <65 | I/II | Chemotherapy | cyclophosphamide | SD | |
| FAAH | SNV | Missense_Mutation | c.576N>G | p.Phe192Leu | p.F192L | O00519 | protein_coding | tolerated(1) | benign(0) | TCGA-D8-A1JA-01 | Breast | breast invasive carcinoma | Female | <65 | III/IV | Chemotherapy | adriamycin | PD | |
| FAAH | SNV | Missense_Mutation | novel | c.1025N>C | p.Met342Thr | p.M342T | O00519 | protein_coding | deleterious(0) | probably_damaging(0.984) | TCGA-LL-A5YO-01 | Breast | breast invasive carcinoma | Female | <65 | I/II | Chemotherapy | taxotere | CR |
| FAAH | insertion | In_Frame_Ins | novel | c.697_698insCCC | p.Gly233delinsAlaArg | p.G233delinsAR | O00519 | protein_coding | TCGA-A8-A07Z-01 | Breast | breast invasive carcinoma | Female | >=65 | I/II | Unspecific | Exemestane | SD | ||
| FAAH | insertion | Frame_Shift_Ins | novel | c.698_699insACCCCGT | p.Leu234ProfsTer6 | p.L234Pfs*6 | O00519 | protein_coding | TCGA-A8-A07Z-01 | Breast | breast invasive carcinoma | Female | >=65 | I/II | Unspecific | Exemestane | SD | ||
| FAAH | SNV | Missense_Mutation | c.1402N>T | p.Asp468Tyr | p.D468Y | O00519 | protein_coding | deleterious(0) | probably_damaging(0.994) | TCGA-C5-A1BQ-01 | Cervix | cervical & endocervical cancer | Female | >=65 | III/IV | Chemotherapy | cisplatin | CR |
| Page: 1 2 3 4 5 |
Top |
Related drugs of malignant transformation related genes |
| Identification of chemicals and drugs interact with genes involved in malignant transfromation |
| (DGIdb 4.0) |
| Entrez ID | Symbol | Category | Interaction Types | Drug Claim Name | Drug Name | PMIDs |
| 2166 | FAAH | ENZYME, DRUGGABLE GENOME | Azetidine urea derivative 3 | |||
| 2166 | FAAH | ENZYME, DRUGGABLE GENOME | SSR411298 | |||
| 2166 | FAAH | ENZYME, DRUGGABLE GENOME | Spirocyclic diamine urea derivative 2 | |||
| 2166 | FAAH | ENZYME, DRUGGABLE GENOME | Propofol | PROPOFOL | ||
| 2166 | FAAH | ENZYME, DRUGGABLE GENOME | Heteroaryl-substituted urea derivative 1 | |||
| 2166 | FAAH | ENZYME, DRUGGABLE GENOME | inhibitor | CHEMBL112 | ACETAMINOPHEN | |
| 2166 | FAAH | ENZYME, DRUGGABLE GENOME | PF-04862853 | CHEMBL1915783 | 21924613 | |
| 2166 | FAAH | ENZYME, DRUGGABLE GENOME | ACETAMINOPHEN | ACETAMINOPHEN | 15987694 | |
| 2166 | FAAH | ENZYME, DRUGGABLE GENOME | Imidazolyl urea derivative 1 | |||
| 2166 | FAAH | ENZYME, DRUGGABLE GENOME | Ketoheterocycle derivative 1 |
| Page: 1 2 3 4 5 6 7 8 9 10 11 12 13 |

Copyright 2023-Present -The University of Texas Health Science Center at Houston |