
|
|||||
|
 | |
| |
| |
| |
| |
| |
|
Gene: FA2H |
Gene summary for FA2H |
| Gene information | Species | Human | Gene symbol | FA2H | Gene ID | 79152 |
| Gene name | fatty acid 2-hydroxylase | |
| Gene Alias | FAAH | |
| Cytomap | 16q23.1 | |
| Gene Type | protein-coding | GO ID | GO:0001949 | UniProtAcc | Q7L5A8 |
Top |
Malignant transformation analysis |
| Identification of the aberrant gene expression in precancerous and cancerous lesions by comparing the gene expression of stem-like cells in diseased tissues with normal stem cells |
| Entrez ID | Symbol | Replicates | Species | Organ | Tissue | Adj P-value | Log2FC | Malignancy |
| 79152 | FA2H | HTA11_2487_2000001011 | Human | Colorectum | SER | 4.09e-10 | 7.31e-01 | -0.1808 |
| 79152 | FA2H | HTA11_1938_2000001011 | Human | Colorectum | AD | 4.86e-04 | 6.24e-01 | -0.0811 |
| 79152 | FA2H | HTA11_78_2000001011 | Human | Colorectum | AD | 1.29e-03 | 4.48e-01 | -0.1088 |
| 79152 | FA2H | HTA11_347_2000001011 | Human | Colorectum | AD | 3.29e-15 | 7.00e-01 | -0.1954 |
| 79152 | FA2H | HTA11_411_2000001011 | Human | Colorectum | SER | 3.76e-05 | 1.29e+00 | -0.2602 |
| 79152 | FA2H | HTA11_3361_2000001011 | Human | Colorectum | AD | 1.90e-02 | 4.52e-01 | -0.1207 |
| 79152 | FA2H | HTA11_83_2000001011 | Human | Colorectum | SER | 6.16e-06 | 6.88e-01 | -0.1526 |
| 79152 | FA2H | HTA11_696_2000001011 | Human | Colorectum | AD | 5.37e-13 | 7.16e-01 | -0.1464 |
| 79152 | FA2H | HTA11_866_2000001011 | Human | Colorectum | AD | 5.51e-07 | 4.51e-01 | -0.1001 |
| 79152 | FA2H | HTA11_1391_2000001011 | Human | Colorectum | AD | 4.71e-03 | 4.66e-01 | -0.059 |
| 79152 | FA2H | HTA11_99999974143_84620 | Human | Colorectum | MSS | 1.23e-03 | -2.59e-01 | 0.3005 |
| 79152 | FA2H | A015-C-203 | Human | Colorectum | FAP | 3.36e-08 | -1.80e-01 | -0.1294 |
| 79152 | FA2H | A002-C-201 | Human | Colorectum | FAP | 1.32e-04 | -1.94e-01 | 0.0324 |
| 79152 | FA2H | A001-C-108 | Human | Colorectum | FAP | 1.87e-04 | -1.66e-01 | -0.0272 |
| 79152 | FA2H | A002-C-205 | Human | Colorectum | FAP | 1.19e-06 | -1.84e-01 | -0.1236 |
| 79152 | FA2H | A015-C-006 | Human | Colorectum | FAP | 2.07e-03 | -1.42e-01 | -0.0994 |
| 79152 | FA2H | A015-C-106 | Human | Colorectum | FAP | 2.17e-03 | -1.04e-01 | -0.0511 |
| 79152 | FA2H | A002-C-114 | Human | Colorectum | FAP | 1.04e-05 | -1.89e-01 | -0.1561 |
| 79152 | FA2H | A015-C-104 | Human | Colorectum | FAP | 1.03e-10 | -2.13e-01 | -0.1899 |
| 79152 | FA2H | A001-C-014 | Human | Colorectum | FAP | 9.11e-06 | -2.13e-01 | 0.0135 |
| Page: 1 2 3 |
| Tissue | Expression Dynamics | Abbreviation |
| Colorectum (GSE201348) |  | FAP: Familial adenomatous polyposis |
| CRC: Colorectal cancer | ||
| Colorectum (HTA11) |  | AD: Adenomas |
| SER: Sessile serrated lesions | ||
| MSI-H: Microsatellite-high colorectal cancer | ||
| MSS: Microsatellite stable colorectal cancer | ||
| Esophagus | 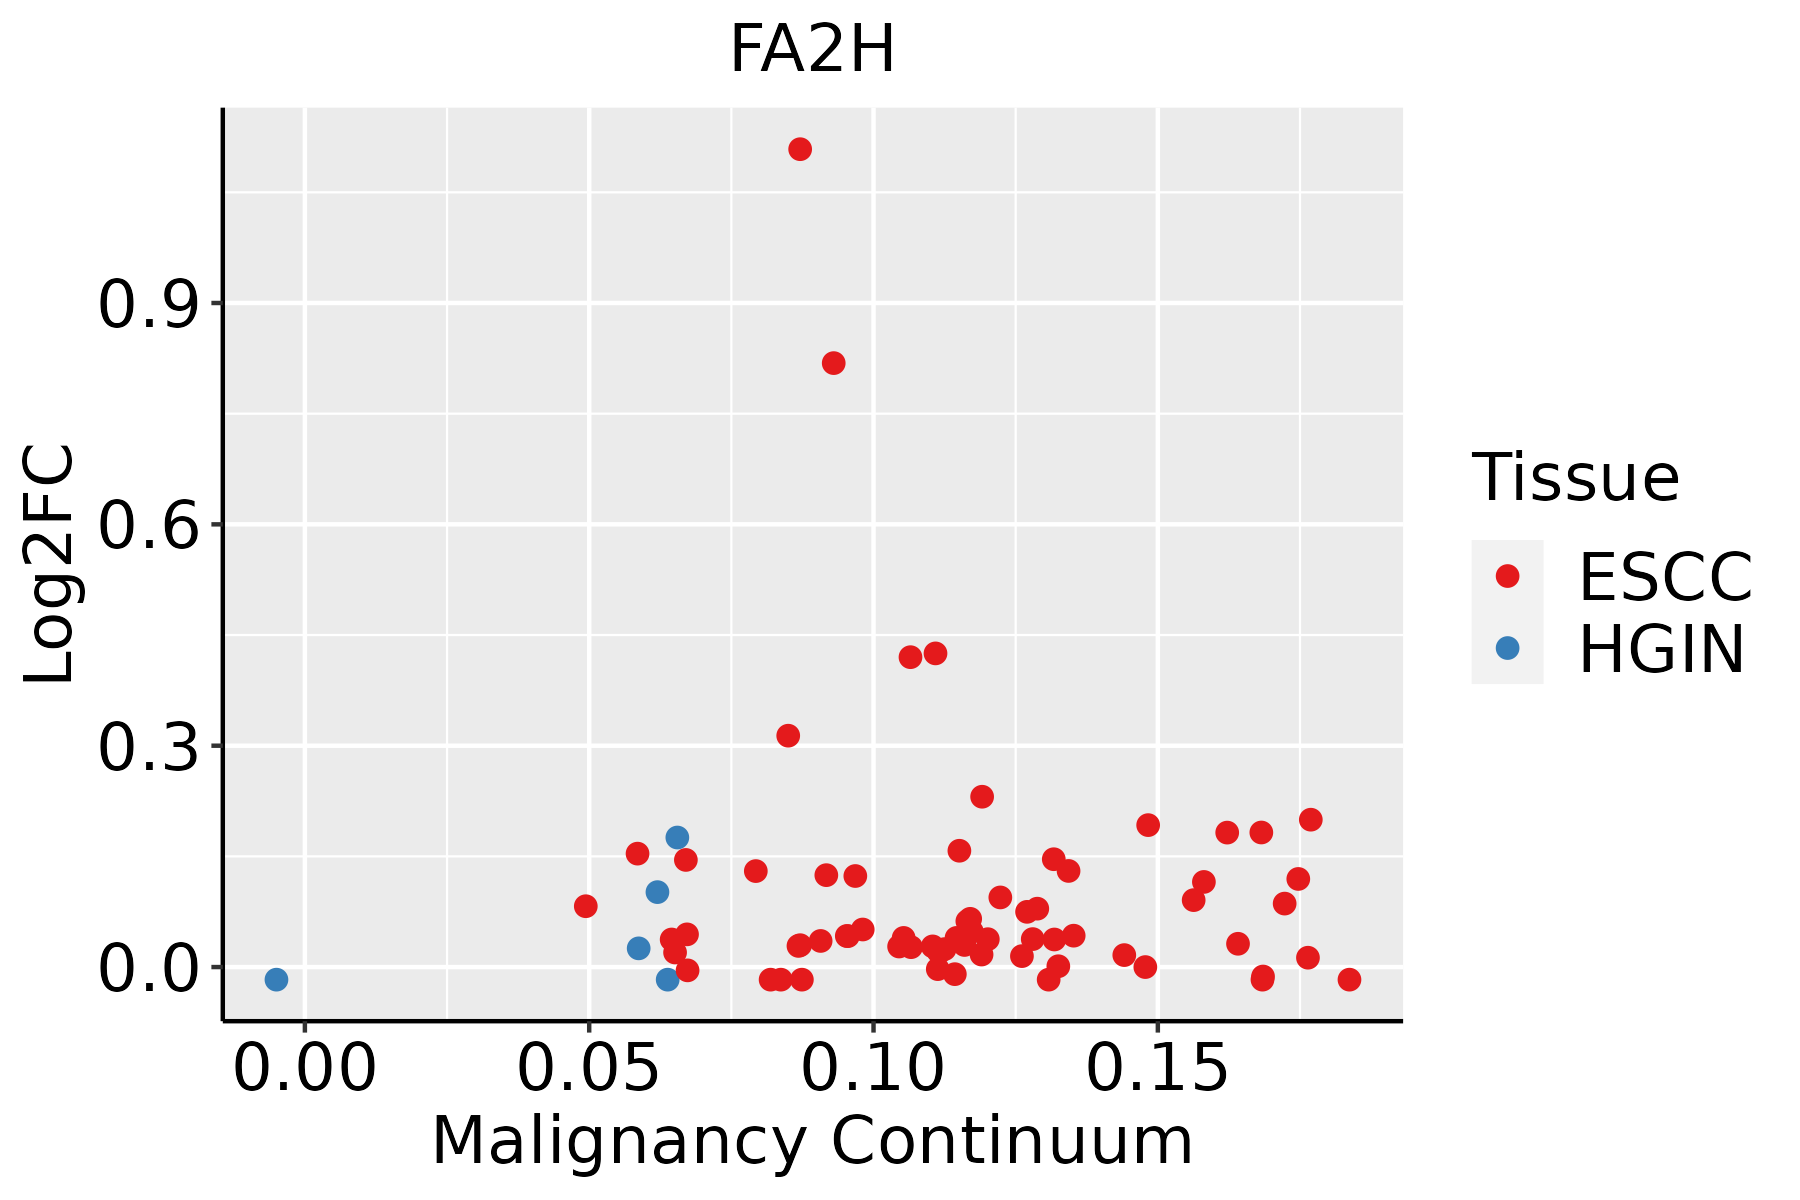 | ESCC: Esophageal squamous cell carcinoma |
| HGIN: High-grade intraepithelial neoplasias | ||
| LGIN: Low-grade intraepithelial neoplasias | ||
| Lung | 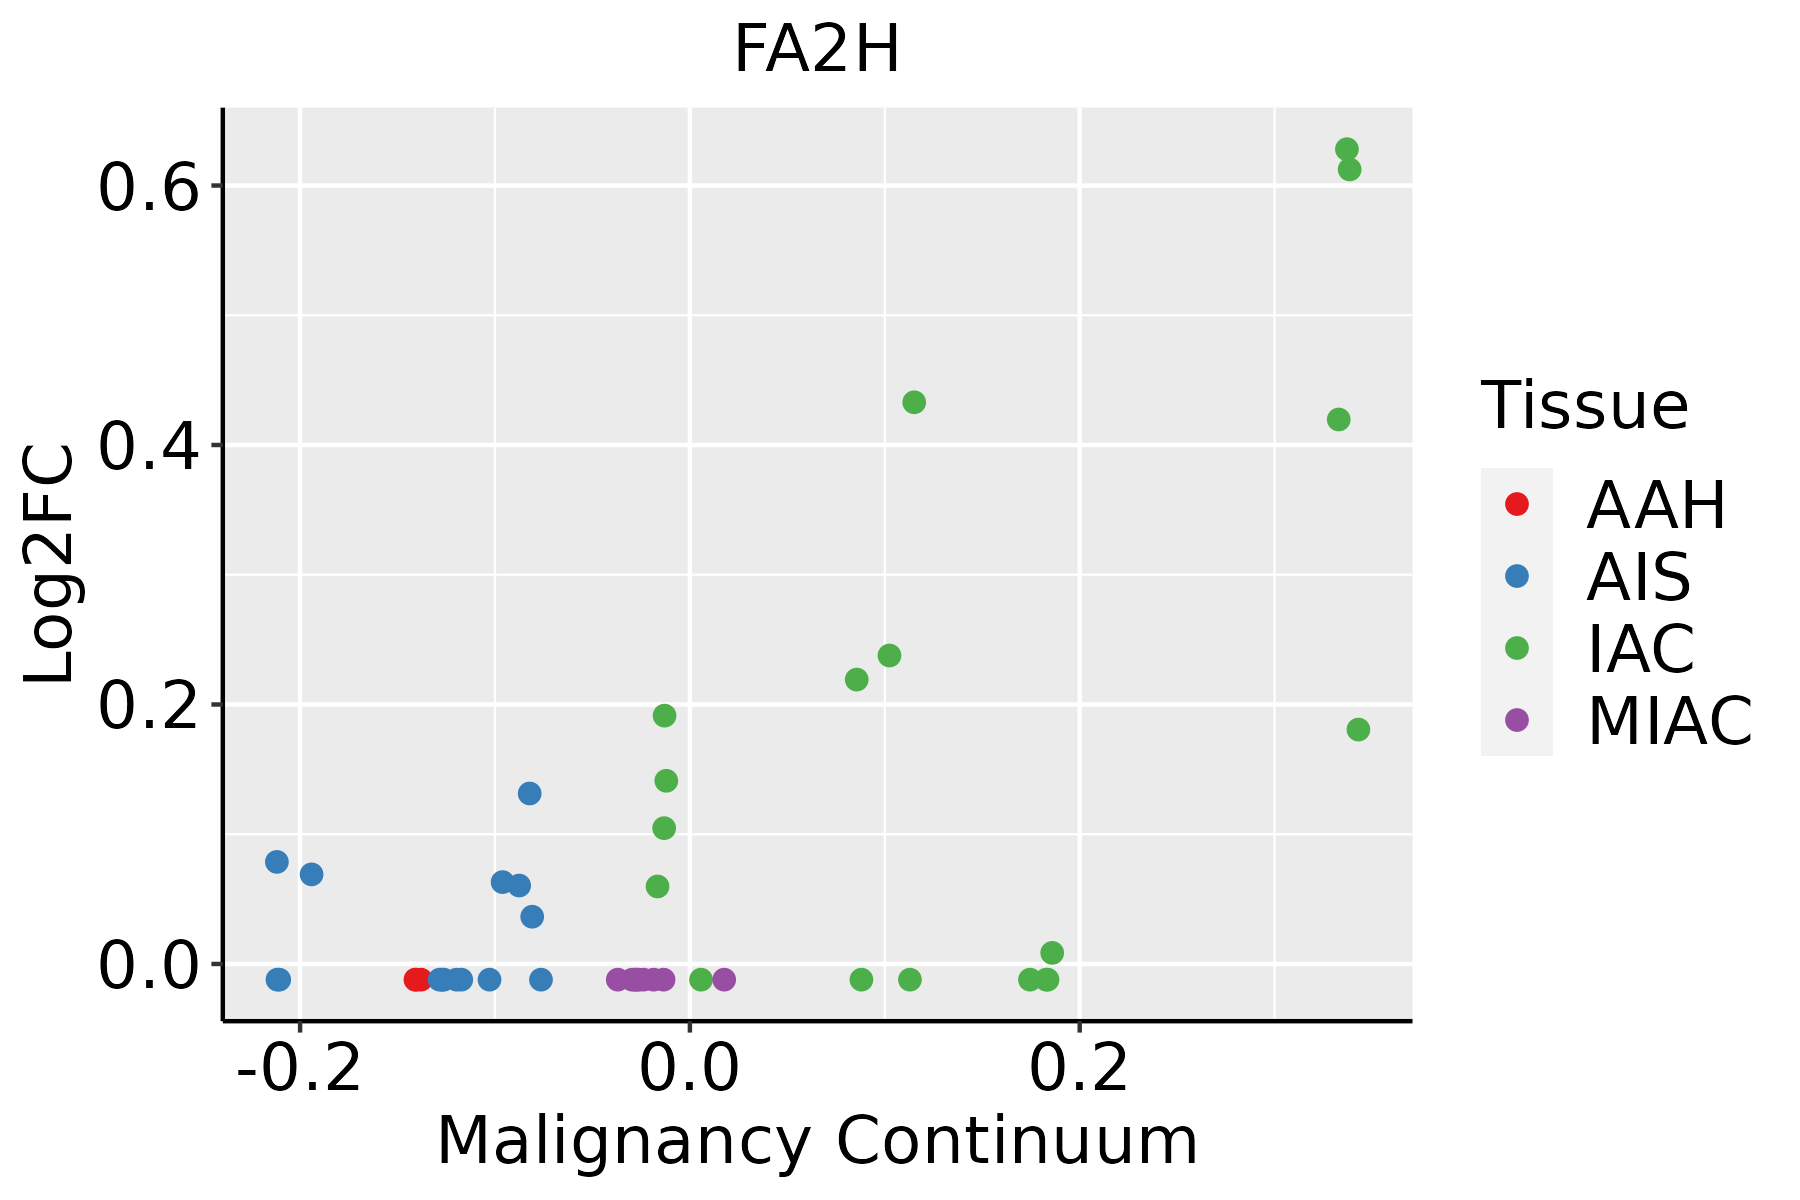 | AAH: Atypical adenomatous hyperplasia |
| AIS: Adenocarcinoma in situ | ||
| IAC: Invasive lung adenocarcinoma | ||
| MIA: Minimally invasive adenocarcinoma |
| ∗log2FC in expression of this searched gene in stem-like cells from each diseased tissue sample relative to stem-like cells in normal samples in each tissue plotted against the malignancy continuum. Samples are colored based on if they are from different disease stage. |
Top |
Malignant transformation related pathway analysis |
| Find out the enriched GO biological processes and KEGG pathways involved in transition from healthy to precancer to cancer |
| Tissue | Disease Stage | Enriched GO biological Processes |
| Colorectum | AD |  |
| Colorectum | SER |  |
| Colorectum | MSS |  |
| Colorectum | MSI-H |  |
| Colorectum | FAP |  |
| ∗Top 15 enriched GO BP terms are showed in the bar plot of each disease state in each tissue. Each row represents a significant GO biological process which is colored according to the -log10(p.adjust). |
| Page: 1 2 3 4 5 6 7 8 9 |
| GO ID | Tissue | Disease Stage | Description | Gene Ratio | Bg Ratio | pvalue | p.adjust | Count |
| GO:0048732 | Colorectum | AD | gland development | 149/3918 | 436/18723 | 6.07e-11 | 6.33e-09 | 149 |
| GO:0006631 | Colorectum | AD | fatty acid metabolic process | 114/3918 | 390/18723 | 5.58e-05 | 9.44e-04 | 114 |
| GO:0030258 | Colorectum | AD | lipid modification | 67/3918 | 212/18723 | 1.66e-04 | 2.27e-03 | 67 |
| GO:0050878 | Colorectum | AD | regulation of body fluid levels | 108/3918 | 379/18723 | 2.54e-04 | 3.20e-03 | 108 |
| GO:0009913 | Colorectum | AD | epidermal cell differentiation | 58/3918 | 202/18723 | 5.16e-03 | 3.42e-02 | 58 |
| GO:0043217 | Colorectum | AD | myelin maintenance | 9/3918 | 18/18723 | 5.82e-03 | 3.67e-02 | 9 |
| GO:0008544 | Colorectum | AD | epidermis development | 87/3918 | 324/18723 | 5.99e-03 | 3.76e-02 | 87 |
| GO:00487321 | Colorectum | SER | gland development | 112/2897 | 436/18723 | 1.75e-08 | 1.28e-06 | 112 |
| GO:00508781 | Colorectum | SER | regulation of body fluid levels | 81/2897 | 379/18723 | 1.28e-03 | 1.43e-02 | 81 |
| GO:0007009 | Colorectum | SER | plasma membrane organization | 36/2897 | 142/18723 | 1.50e-03 | 1.62e-02 | 36 |
| GO:0031579 | Colorectum | SER | membrane raft organization | 10/2897 | 25/18723 | 2.70e-03 | 2.44e-02 | 10 |
| GO:0022011 | Colorectum | SER | myelination in peripheral nervous system | 11/2897 | 29/18723 | 2.75e-03 | 2.46e-02 | 11 |
| GO:0032292 | Colorectum | SER | peripheral nervous system axon ensheathment | 11/2897 | 29/18723 | 2.75e-03 | 2.46e-02 | 11 |
| GO:00432171 | Colorectum | SER | myelin maintenance | 8/2897 | 18/18723 | 3.31e-03 | 2.83e-02 | 8 |
| GO:00302581 | Colorectum | SER | lipid modification | 47/2897 | 212/18723 | 6.01e-03 | 4.38e-02 | 47 |
| GO:00066311 | Colorectum | SER | fatty acid metabolic process | 79/2897 | 390/18723 | 6.34e-03 | 4.56e-02 | 79 |
| GO:0014044 | Colorectum | SER | Schwann cell development | 11/2897 | 32/18723 | 6.58e-03 | 4.68e-02 | 11 |
| GO:00487322 | Colorectum | MSS | gland development | 143/3467 | 436/18723 | 3.85e-13 | 8.01e-11 | 143 |
| GO:00508782 | Colorectum | MSS | regulation of body fluid levels | 99/3467 | 379/18723 | 1.40e-04 | 2.07e-03 | 99 |
| GO:00302582 | Colorectum | MSS | lipid modification | 57/3467 | 212/18723 | 1.64e-03 | 1.49e-02 | 57 |
| Page: 1 2 3 4 |
| Pathway ID | Tissue | Disease Stage | Description | Gene Ratio | Bg Ratio | pvalue | p.adjust | qvalue | Count |
| Page: 1 |
Top |
Cell-cell communication analysis |
| Identification of potential cell-cell interactions between two cell types and their ligand-receptor pairs for different disease states |
| Ligand | Receptor | LRpair | Pathway | Tissue | Disease Stage |
| Page: 1 |
Top |
Single-cell gene regulatory network inference analysis |
| Find out the significant the regulons (TFs) and the target genes of each regulon across cell types for different disease states |
| TF | Cell Type | Tissue | Disease Stage | Target Gene | RSS | Regulon Activity |
| ∗The dot plots of a searched regulon are shown for all cell subpopulations in each disease state of each tissue based on the regulon specific score inferred using pySCENIC and by calculating the average expression. |
| Page: 1 |
Top |
Somatic mutation of malignant transformation related genes |
| Annotation of somatic variants for genes involved in malignant transformation |
| Hugo Symbol | Variant Class | Variant Classification | dbSNP RS | HGVSc | HGVSp | HGVSp Short | SWISSPROT | BIOTYPE | SIFT | PolyPhen | Tumor Sample Barcode | Tissue | Histology | Sex | Age | Stage | Therapy Types | Drugs | Outcome |
| FA2H | SNV | Missense_Mutation | novel | c.709N>A | p.Leu237Met | p.L237M | Q7L5A8 | protein_coding | deleterious(0.01) | possibly_damaging(0.776) | TCGA-5L-AAT1-01 | Breast | breast invasive carcinoma | Female | <65 | III/IV | Hormone Therapy | letrozol | SD |
| FA2H | SNV | Missense_Mutation | rs387907039 | c.703N>T | p.Arg235Cys | p.R235C | Q7L5A8 | protein_coding | deleterious(0) | probably_damaging(0.967) | TCGA-C5-A1ME-01 | Cervix | cervical & endocervical cancer | Female | <65 | I/II | Unknown | Unknown | SD |
| FA2H | SNV | Missense_Mutation | c.950A>G | p.Tyr317Cys | p.Y317C | Q7L5A8 | protein_coding | deleterious(0) | probably_damaging(1) | TCGA-AA-3506-01 | Colorectum | colon adenocarcinoma | Male | >=65 | I/II | Unknown | Unknown | SD | |
| FA2H | SNV | Missense_Mutation | c.581N>A | p.Gly194Asp | p.G194D | Q7L5A8 | protein_coding | tolerated(0.12) | benign(0.029) | TCGA-AA-3672-01 | Colorectum | colon adenocarcinoma | Female | >=65 | III/IV | Unknown | Unknown | SD | |
| FA2H | SNV | Missense_Mutation | novel | c.938N>C | p.Met313Thr | p.M313T | Q7L5A8 | protein_coding | deleterious(0) | possibly_damaging(0.907) | TCGA-A5-A0G2-01 | Endometrium | uterine corpus endometrioid carcinoma | Female | <65 | III/IV | Unknown | Unknown | SD |
| FA2H | SNV | Missense_Mutation | novel | c.538N>A | p.Val180Met | p.V180M | Q7L5A8 | protein_coding | tolerated(0.22) | benign(0.189) | TCGA-A5-A0G2-01 | Endometrium | uterine corpus endometrioid carcinoma | Female | <65 | III/IV | Unknown | Unknown | SD |
| FA2H | SNV | Missense_Mutation | c.1016N>G | p.His339Arg | p.H339R | Q7L5A8 | protein_coding | deleterious(0) | probably_damaging(1) | TCGA-A5-A0GH-01 | Endometrium | uterine corpus endometrioid carcinoma | Female | <65 | I/II | Unknown | Unknown | SD | |
| FA2H | SNV | Missense_Mutation | c.919N>T | p.Gly307Cys | p.G307C | Q7L5A8 | protein_coding | deleterious(0) | probably_damaging(1) | TCGA-AP-A0LM-01 | Endometrium | uterine corpus endometrioid carcinoma | Female | <65 | III/IV | Chemotherapy | cisplatin | SD | |
| FA2H | SNV | Missense_Mutation | novel | c.282G>T | p.Glu94Asp | p.E94D | Q7L5A8 | protein_coding | tolerated(0.14) | benign(0.236) | TCGA-AP-A1DV-01 | Endometrium | uterine corpus endometrioid carcinoma | Female | <65 | I/II | Unknown | Unknown | SD |
| FA2H | SNV | Missense_Mutation | novel | c.913N>A | p.Leu305Ile | p.L305I | Q7L5A8 | protein_coding | tolerated(0.07) | probably_damaging(0.999) | TCGA-B5-A3FC-01 | Endometrium | uterine corpus endometrioid carcinoma | Female | <65 | I/II | Unknown | Unknown | SD |
| Page: 1 2 3 |
Top |
Related drugs of malignant transformation related genes |
| Identification of chemicals and drugs interact with genes involved in malignant transfromation |
| (DGIdb 4.0) |
| Entrez ID | Symbol | Category | Interaction Types | Drug Claim Name | Drug Name | PMIDs |
| Page: 1 |

Copyright 2023-Present -The University of Texas Health Science Center at Houston |