
|
|||||
|
 | |
| |
| |
| |
| |
| |
|
Gene: F8A1 |
Gene summary for F8A1 |
| Gene information | Species | Human | Gene symbol | F8A1 | Gene ID | 8263 |
| Gene name | coagulation factor VIII associated 1 | |
| Gene Alias | DXS522E | |
| Cytomap | Xq28 | |
| Gene Type | protein-coding | GO ID | GO:0006508 | UniProtAcc | P23610 |
Top |
Malignant transformation analysis |
| Identification of the aberrant gene expression in precancerous and cancerous lesions by comparing the gene expression of stem-like cells in diseased tissues with normal stem cells |
| Entrez ID | Symbol | Replicates | Species | Organ | Tissue | Adj P-value | Log2FC | Malignancy |
| 8263 | F8A1 | C04 | Human | Oral cavity | OSCC | 7.09e-21 | 7.27e-01 | 0.2633 |
| 8263 | F8A1 | C21 | Human | Oral cavity | OSCC | 1.75e-87 | 2.25e+00 | 0.2678 |
| 8263 | F8A1 | C30 | Human | Oral cavity | OSCC | 4.01e-47 | 1.76e+00 | 0.3055 |
| 8263 | F8A1 | C38 | Human | Oral cavity | OSCC | 9.91e-20 | 1.19e+00 | 0.172 |
| 8263 | F8A1 | C43 | Human | Oral cavity | OSCC | 6.38e-39 | 5.95e-01 | 0.1704 |
| 8263 | F8A1 | C46 | Human | Oral cavity | OSCC | 2.86e-08 | 2.36e-01 | 0.1673 |
| 8263 | F8A1 | C57 | Human | Oral cavity | OSCC | 4.12e-02 | 1.50e-01 | 0.1679 |
| 8263 | F8A1 | C06 | Human | Oral cavity | OSCC | 1.22e-15 | 1.51e+00 | 0.2699 |
| 8263 | F8A1 | C07 | Human | Oral cavity | OSCC | 1.61e-02 | 9.30e-01 | 0.2491 |
| 8263 | F8A1 | C08 | Human | Oral cavity | OSCC | 2.88e-59 | 1.04e+00 | 0.1919 |
| 8263 | F8A1 | C09 | Human | Oral cavity | OSCC | 9.25e-08 | 2.66e-01 | 0.1431 |
| 8263 | F8A1 | LN22 | Human | Oral cavity | OSCC | 1.15e-08 | 7.38e-01 | 0.1733 |
| 8263 | F8A1 | LP15 | Human | Oral cavity | LP | 4.36e-07 | 9.65e-01 | 0.2174 |
| 8263 | F8A1 | LP17 | Human | Oral cavity | LP | 8.60e-10 | 8.13e-01 | 0.2349 |
| 8263 | F8A1 | SYSMH1 | Human | Oral cavity | OSCC | 1.99e-11 | 2.43e-01 | 0.1127 |
| 8263 | F8A1 | SYSMH2 | Human | Oral cavity | OSCC | 1.56e-08 | 2.17e-01 | 0.2326 |
| 8263 | F8A1 | SYSMH3 | Human | Oral cavity | OSCC | 6.84e-14 | 3.08e-01 | 0.2442 |
| 8263 | F8A1 | SYSMH5 | Human | Oral cavity | OSCC | 8.59e-06 | 2.15e-01 | 0.0647 |
| 8263 | F8A1 | SYSMH6 | Human | Oral cavity | OSCC | 2.77e-02 | 1.04e-01 | 0.1275 |
| 8263 | F8A1 | P5_S10_cSCC | Human | Skin | cSCC | 1.92e-04 | 1.06e-01 | -0.299 |
| Page: 1 2 |
| Tissue | Expression Dynamics | Abbreviation |
| Oral Cavity | 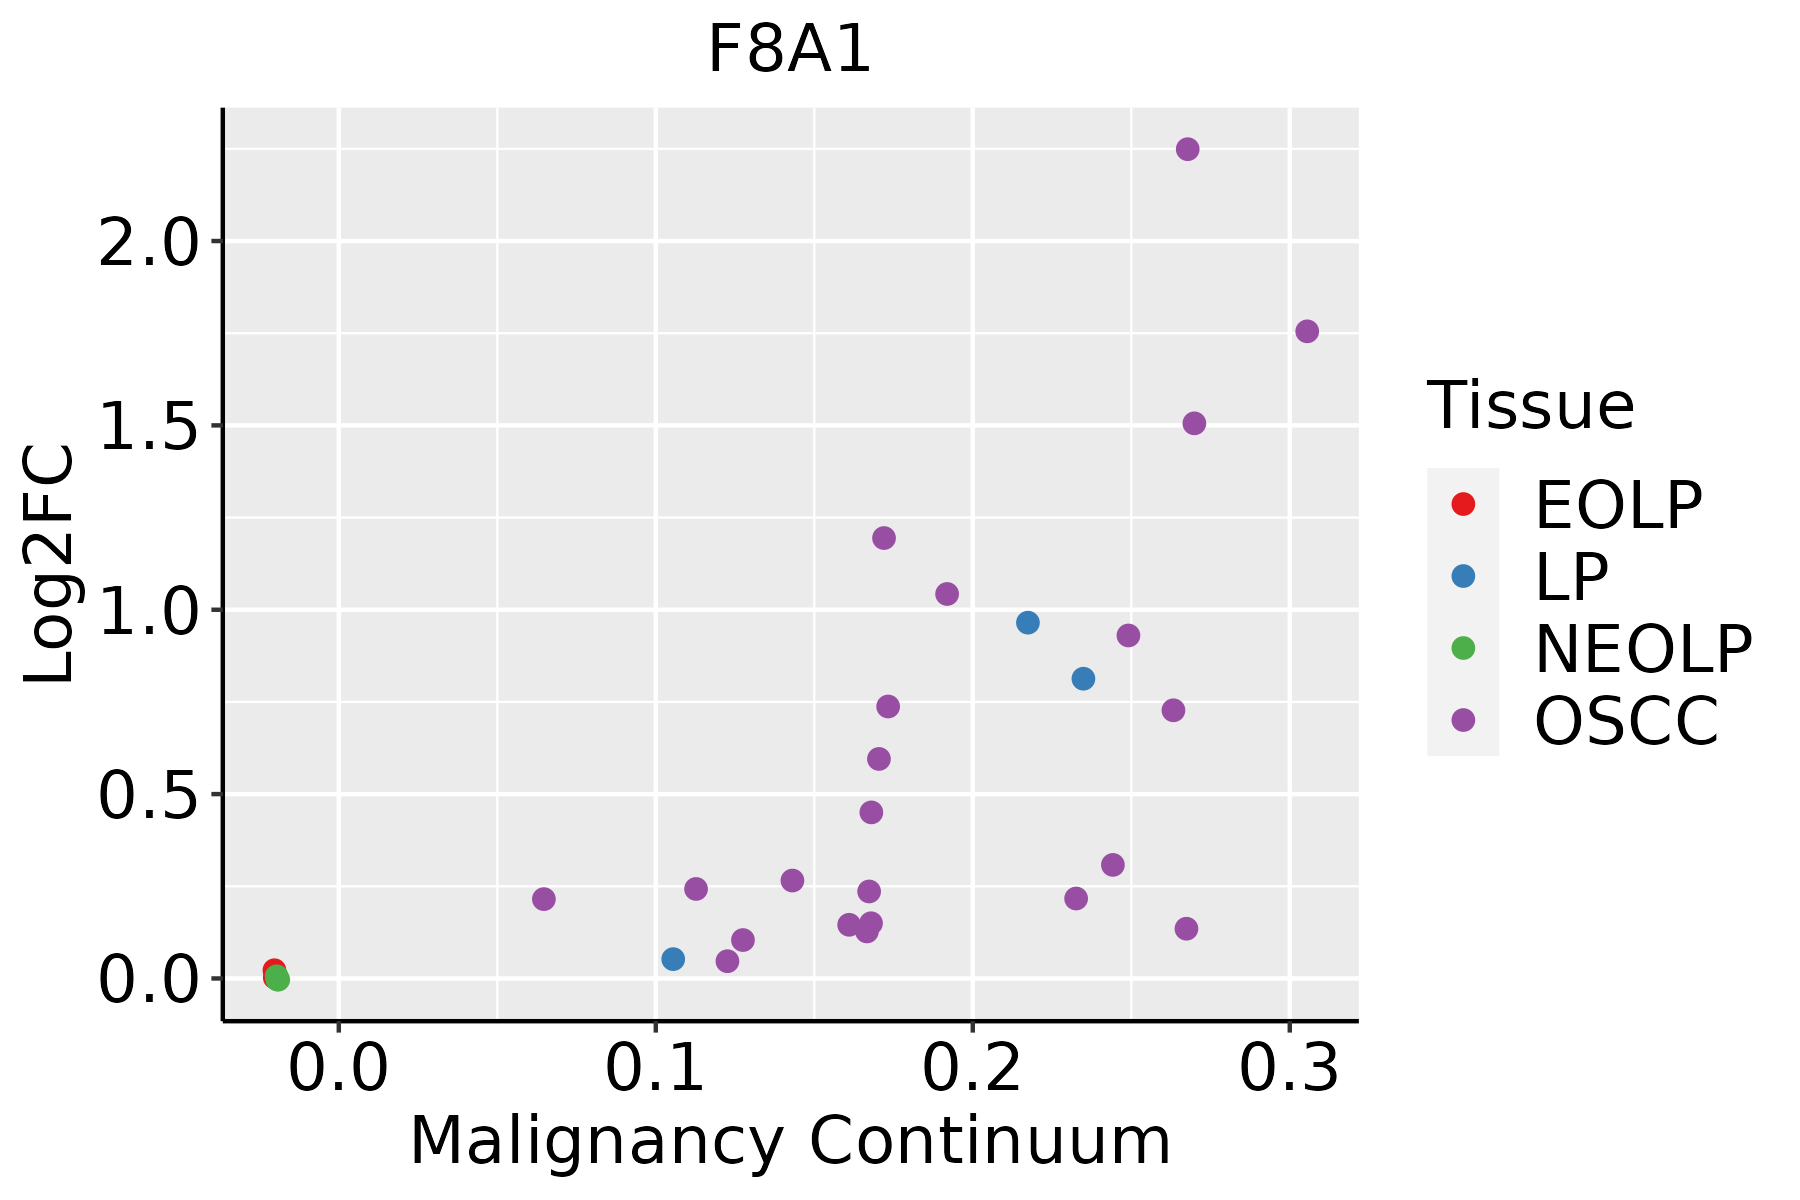 | EOLP: Erosive Oral lichen planus |
| LP: leukoplakia | ||
| NEOLP: Non-erosive oral lichen planus | ||
| OSCC: Oral squamous cell carcinoma | ||
| Skin |  | AK: Actinic keratosis |
| cSCC: Cutaneous squamous cell carcinoma | ||
| SCCIS:squamous cell carcinoma in situ |
| ∗log2FC in expression of this searched gene in stem-like cells from each diseased tissue sample relative to stem-like cells in normal samples in each tissue plotted against the malignancy continuum. Samples are colored based on if they are from different disease stage. |
Top |
Malignant transformation related pathway analysis |
| Find out the enriched GO biological processes and KEGG pathways involved in transition from healthy to precancer to cancer |
| Tissue | Disease Stage | Enriched GO biological Processes |
| Colorectum | AD |  |
| Colorectum | SER |  |
| Colorectum | MSS |  |
| Colorectum | MSI-H |  |
| Colorectum | FAP |  |
| ∗Top 15 enriched GO BP terms are showed in the bar plot of each disease state in each tissue. Each row represents a significant GO biological process which is colored according to the -log10(p.adjust). |
| Page: 1 2 3 4 5 6 7 8 9 |
| GO ID | Tissue | Disease Stage | Description | Gene Ratio | Bg Ratio | pvalue | p.adjust | Count |
| GO:001049820 | Oral cavity | OSCC | proteasomal protein catabolic process | 336/7305 | 490/18723 | 5.45e-41 | 8.63e-38 | 336 |
| GO:004217620 | Oral cavity | OSCC | regulation of protein catabolic process | 254/7305 | 391/18723 | 1.07e-25 | 3.22e-23 | 254 |
| GO:190336220 | Oral cavity | OSCC | regulation of cellular protein catabolic process | 174/7305 | 255/18723 | 2.04e-21 | 3.70e-19 | 174 |
| GO:190305020 | Oral cavity | OSCC | regulation of proteolysis involved in cellular protein catabolic process | 152/7305 | 221/18723 | 2.16e-19 | 3.15e-17 | 152 |
| GO:005165610 | Oral cavity | OSCC | establishment of organelle localization | 239/7305 | 390/18723 | 2.46e-19 | 3.31e-17 | 239 |
| GO:006113620 | Oral cavity | OSCC | regulation of proteasomal protein catabolic process | 132/7305 | 187/18723 | 1.57e-18 | 1.81e-16 | 132 |
| GO:000989519 | Oral cavity | OSCC | negative regulation of catabolic process | 180/7305 | 320/18723 | 2.44e-10 | 6.86e-09 | 180 |
| GO:003133020 | Oral cavity | OSCC | negative regulation of cellular catabolic process | 152/7305 | 262/18723 | 3.04e-10 | 8.28e-09 | 152 |
| GO:00516509 | Oral cavity | OSCC | establishment of vesicle localization | 101/7305 | 161/18723 | 8.79e-10 | 2.17e-08 | 101 |
| GO:00516489 | Oral cavity | OSCC | vesicle localization | 105/7305 | 177/18723 | 3.30e-08 | 6.30e-07 | 105 |
| GO:004217719 | Oral cavity | OSCC | negative regulation of protein catabolic process | 77/7305 | 121/18723 | 3.49e-08 | 6.64e-07 | 77 |
| GO:003070510 | Oral cavity | OSCC | cytoskeleton-dependent intracellular transport | 113/7305 | 195/18723 | 6.03e-08 | 1.09e-06 | 113 |
| GO:004586120 | Oral cavity | OSCC | negative regulation of proteolysis | 181/7305 | 351/18723 | 1.01e-06 | 1.37e-05 | 181 |
| GO:190336317 | Oral cavity | OSCC | negative regulation of cellular protein catabolic process | 49/7305 | 75/18723 | 3.49e-06 | 4.15e-05 | 49 |
| GO:190305117 | Oral cavity | OSCC | negative regulation of proteolysis involved in cellular protein catabolic process | 41/7305 | 64/18723 | 4.31e-05 | 3.71e-04 | 41 |
| GO:19017998 | Oral cavity | OSCC | negative regulation of proteasomal protein catabolic process | 31/7305 | 49/18723 | 5.04e-04 | 2.95e-03 | 31 |
| GO:00995184 | Oral cavity | OSCC | vesicle cytoskeletal trafficking | 41/7305 | 73/18723 | 2.18e-03 | 9.95e-03 | 41 |
| GO:0010498110 | Oral cavity | LP | proteasomal protein catabolic process | 224/4623 | 490/18723 | 9.57e-25 | 4.00e-22 | 224 |
| GO:0042176110 | Oral cavity | LP | regulation of protein catabolic process | 177/4623 | 391/18723 | 3.00e-19 | 5.87e-17 | 177 |
| GO:1903362110 | Oral cavity | LP | regulation of cellular protein catabolic process | 119/4623 | 255/18723 | 1.52e-14 | 1.76e-12 | 119 |
| Page: 1 2 3 |
| Pathway ID | Tissue | Disease Stage | Description | Gene Ratio | Bg Ratio | pvalue | p.adjust | qvalue | Count |
| Page: 1 |
Top |
Cell-cell communication analysis |
| Identification of potential cell-cell interactions between two cell types and their ligand-receptor pairs for different disease states |
| Ligand | Receptor | LRpair | Pathway | Tissue | Disease Stage |
| Page: 1 |
Top |
Single-cell gene regulatory network inference analysis |
| Find out the significant the regulons (TFs) and the target genes of each regulon across cell types for different disease states |
| TF | Cell Type | Tissue | Disease Stage | Target Gene | RSS | Regulon Activity |
| ∗The dot plots of a searched regulon are shown for all cell subpopulations in each disease state of each tissue based on the regulon specific score inferred using pySCENIC and by calculating the average expression. |
| Page: 1 |
Top |
Somatic mutation of malignant transformation related genes |
| Annotation of somatic variants for genes involved in malignant transformation |
| Hugo Symbol | Variant Class | Variant Classification | dbSNP RS | HGVSc | HGVSp | HGVSp Short | SWISSPROT | BIOTYPE | SIFT | PolyPhen | Tumor Sample Barcode | Tissue | Histology | Sex | Age | Stage | Therapy Types | Drugs | Outcome |
| F8A1 | SNV | Missense_Mutation | novel | c.1066N>A | p.Leu356Ile | p.L356I | P23610 | protein_coding | deleterious(0.04) | probably_damaging(0.996) | TCGA-AN-A0AK-01 | Breast | breast invasive carcinoma | Female | >=65 | I/II | Unknown | Unknown | SD |
| F8A1 | SNV | Missense_Mutation | novel | c.934N>A | p.Gly312Ser | p.G312S | P23610 | protein_coding | tolerated(0.64) | benign(0.011) | TCGA-2W-A8YY-01 | Cervix | cervical & endocervical cancer | Female | <65 | I/II | Chemotherapy | cisplatin | CR |
| F8A1 | SNV | Missense_Mutation | c.910G>C | p.Asp304His | p.D304H | P23610 | protein_coding | deleterious(0.01) | probably_damaging(0.974) | TCGA-EK-A3GK-01 | Cervix | cervical & endocervical cancer | Female | <65 | I/II | Unknown | Unknown | SD | |
| F8A1 | SNV | Missense_Mutation | c.958N>G | p.Leu320Val | p.L320V | P23610 | protein_coding | deleterious(0.01) | possibly_damaging(0.797) | TCGA-IR-A3LA-01 | Cervix | cervical & endocervical cancer | Female | <65 | I/II | Chemotherapy | cisplatin | CR | |
| F8A1 | SNV | Missense_Mutation | novel | c.982N>A | p.Ala328Thr | p.A328T | P23610 | protein_coding | deleterious(0) | probably_damaging(0.999) | TCGA-AA-3949-01 | Colorectum | colon adenocarcinoma | Female | >=65 | III/IV | Unknown | Unknown | SD |
| F8A1 | SNV | Missense_Mutation | novel | c.1016N>T | p.Ser339Leu | p.S339L | P23610 | protein_coding | tolerated(0.38) | benign(0.003) | TCGA-AJ-A3BH-01 | Endometrium | uterine corpus endometrioid carcinoma | Female | Unknown | I/II | Unknown | Unknown | SD |
| F8A1 | SNV | Missense_Mutation | novel | c.951N>T | p.Glu317Asp | p.E317D | P23610 | protein_coding | tolerated(0.62) | benign(0.011) | TCGA-AX-A1CE-01 | Endometrium | uterine corpus endometrioid carcinoma | Female | <65 | I/II | Unspecific | Paclitaxel | SD |
| F8A1 | SNV | Missense_Mutation | novel | c.1036C>T | p.Pro346Ser | p.P346S | P23610 | protein_coding | deleterious(0.02) | probably_damaging(0.974) | TCGA-AX-A2HD-01 | Endometrium | uterine corpus endometrioid carcinoma | Female | >=65 | III/IV | Unknown | Unknown | SD |
| F8A1 | SNV | Missense_Mutation | novel | c.998N>G | p.Asp333Gly | p.D333G | P23610 | protein_coding | deleterious(0) | probably_damaging(0.957) | TCGA-E6-A1LX-01 | Endometrium | uterine corpus endometrioid carcinoma | Female | <65 | I/II | Unknown | Unknown | SD |
| F8A1 | SNV | Missense_Mutation | novel | c.901G>A | p.Glu301Lys | p.E301K | P23610 | protein_coding | deleterious(0.02) | possibly_damaging(0.842) | TCGA-EO-A22U-01 | Endometrium | uterine corpus endometrioid carcinoma | Female | >=65 | I/II | Unknown | Unknown | SD |
| Page: 1 2 |
Top |
Related drugs of malignant transformation related genes |
| Identification of chemicals and drugs interact with genes involved in malignant transfromation |
| (DGIdb 4.0) |
| Entrez ID | Symbol | Category | Interaction Types | Drug Claim Name | Drug Name | PMIDs |
| Page: 1 |

Copyright 2023-Present -The University of Texas Health Science Center at Houston |