
|
|||||
|
 | |
| |
| |
| |
| |
| |
|
Gene: F3 |
Gene summary for F3 |
| Gene information | Species | Human | Gene symbol | F3 | Gene ID | 2152 |
| Gene name | coagulation factor III, tissue factor | |
| Gene Alias | CD142 | |
| Cytomap | 1p21.3 | |
| Gene Type | protein-coding | GO ID | GO:0001525 | UniProtAcc | P13726 |
Top |
Malignant transformation analysis |
| Identification of the aberrant gene expression in precancerous and cancerous lesions by comparing the gene expression of stem-like cells in diseased tissues with normal stem cells |
| Entrez ID | Symbol | Replicates | Species | Organ | Tissue | Adj P-value | Log2FC | Malignancy |
| 2152 | F3 | CA_HPV_2 | Human | Cervix | CC | 2.21e-04 | 3.30e-01 | 0.0391 |
| 2152 | F3 | CCI_1 | Human | Cervix | CC | 4.25e-04 | 7.51e-01 | 0.528 |
| 2152 | F3 | Tumor | Human | Cervix | CC | 2.51e-08 | 3.34e-01 | 0.1241 |
| 2152 | F3 | sample3 | Human | Cervix | CC | 1.32e-32 | 7.49e-01 | 0.1387 |
| 2152 | F3 | H2 | Human | Cervix | HSIL_HPV | 5.58e-23 | 6.21e-01 | 0.0632 |
| 2152 | F3 | L1 | Human | Cervix | CC | 4.16e-03 | 3.84e-01 | 0.0802 |
| 2152 | F3 | T1 | Human | Cervix | CC | 3.80e-04 | 2.82e-01 | 0.0918 |
| 2152 | F3 | T2 | Human | Cervix | CC | 4.70e-03 | 3.29e-01 | 0.0709 |
| 2152 | F3 | T3 | Human | Cervix | CC | 3.43e-27 | 7.34e-01 | 0.1389 |
| 2152 | F3 | LZE4T | Human | Esophagus | ESCC | 4.67e-04 | -1.98e-01 | 0.0811 |
| 2152 | F3 | LZE8T | Human | Esophagus | ESCC | 3.73e-02 | 2.27e-01 | 0.067 |
| 2152 | F3 | LZE20T | Human | Esophagus | ESCC | 1.08e-05 | 1.04e+00 | 0.0662 |
| 2152 | F3 | LZE24T | Human | Esophagus | ESCC | 8.28e-12 | 1.22e+00 | 0.0596 |
| 2152 | F3 | LZE21T | Human | Esophagus | ESCC | 6.51e-06 | 4.12e-01 | 0.0655 |
| 2152 | F3 | P5T-E | Human | Esophagus | ESCC | 6.01e-12 | 6.22e-01 | 0.1327 |
| 2152 | F3 | P8T-E | Human | Esophagus | ESCC | 3.03e-74 | 1.85e+00 | 0.0889 |
| 2152 | F3 | P9T-E | Human | Esophagus | ESCC | 1.42e-03 | 4.90e-01 | 0.1131 |
| 2152 | F3 | P10T-E | Human | Esophagus | ESCC | 7.83e-07 | -2.19e-02 | 0.116 |
| 2152 | F3 | P11T-E | Human | Esophagus | ESCC | 2.87e-07 | 1.55e+00 | 0.1426 |
| 2152 | F3 | P12T-E | Human | Esophagus | ESCC | 6.72e-55 | 1.65e+00 | 0.1122 |
| Page: 1 2 3 4 5 6 |
| Tissue | Expression Dynamics | Abbreviation |
| Cervix | 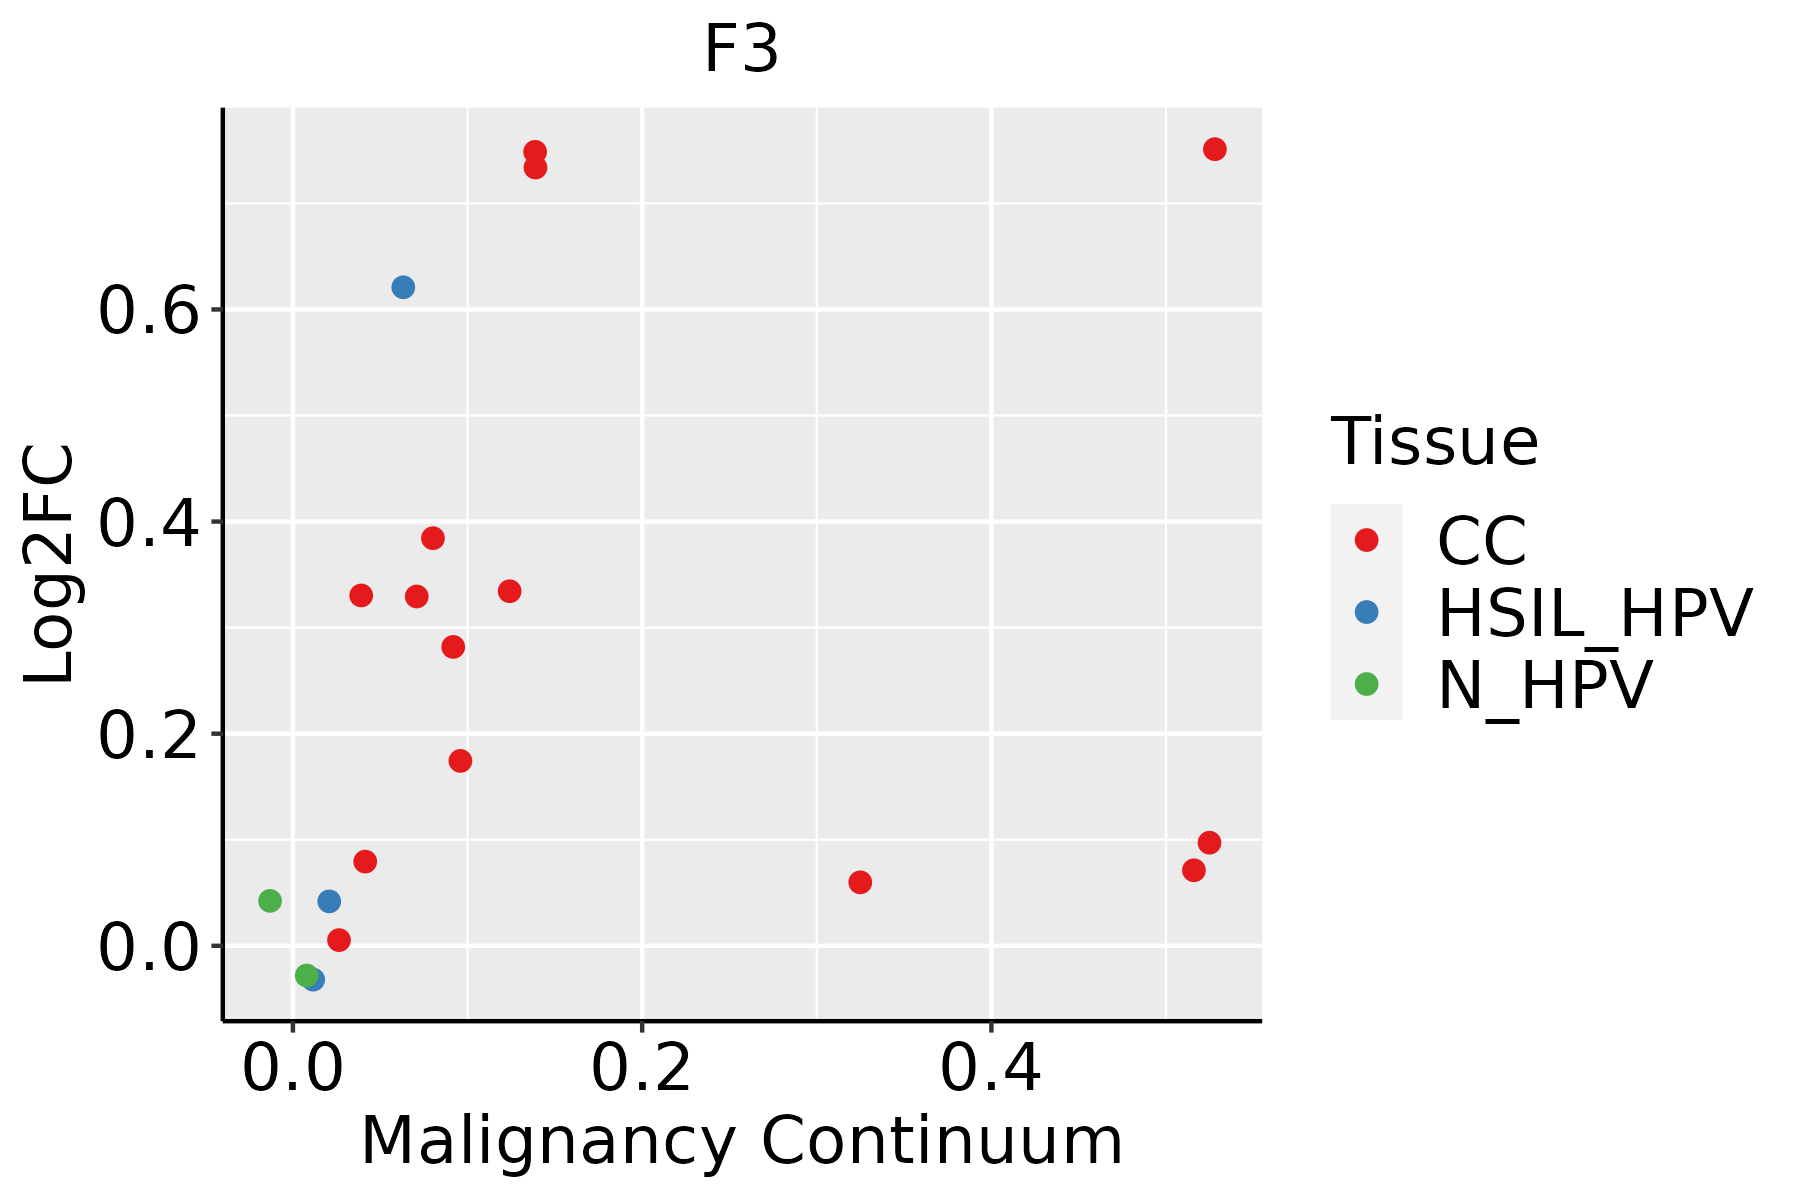 | CC: Cervix cancer |
| HSIL_HPV: HPV-infected high-grade squamous intraepithelial lesions | ||
| N_HPV: HPV-infected normal cervix | ||
| Esophagus | 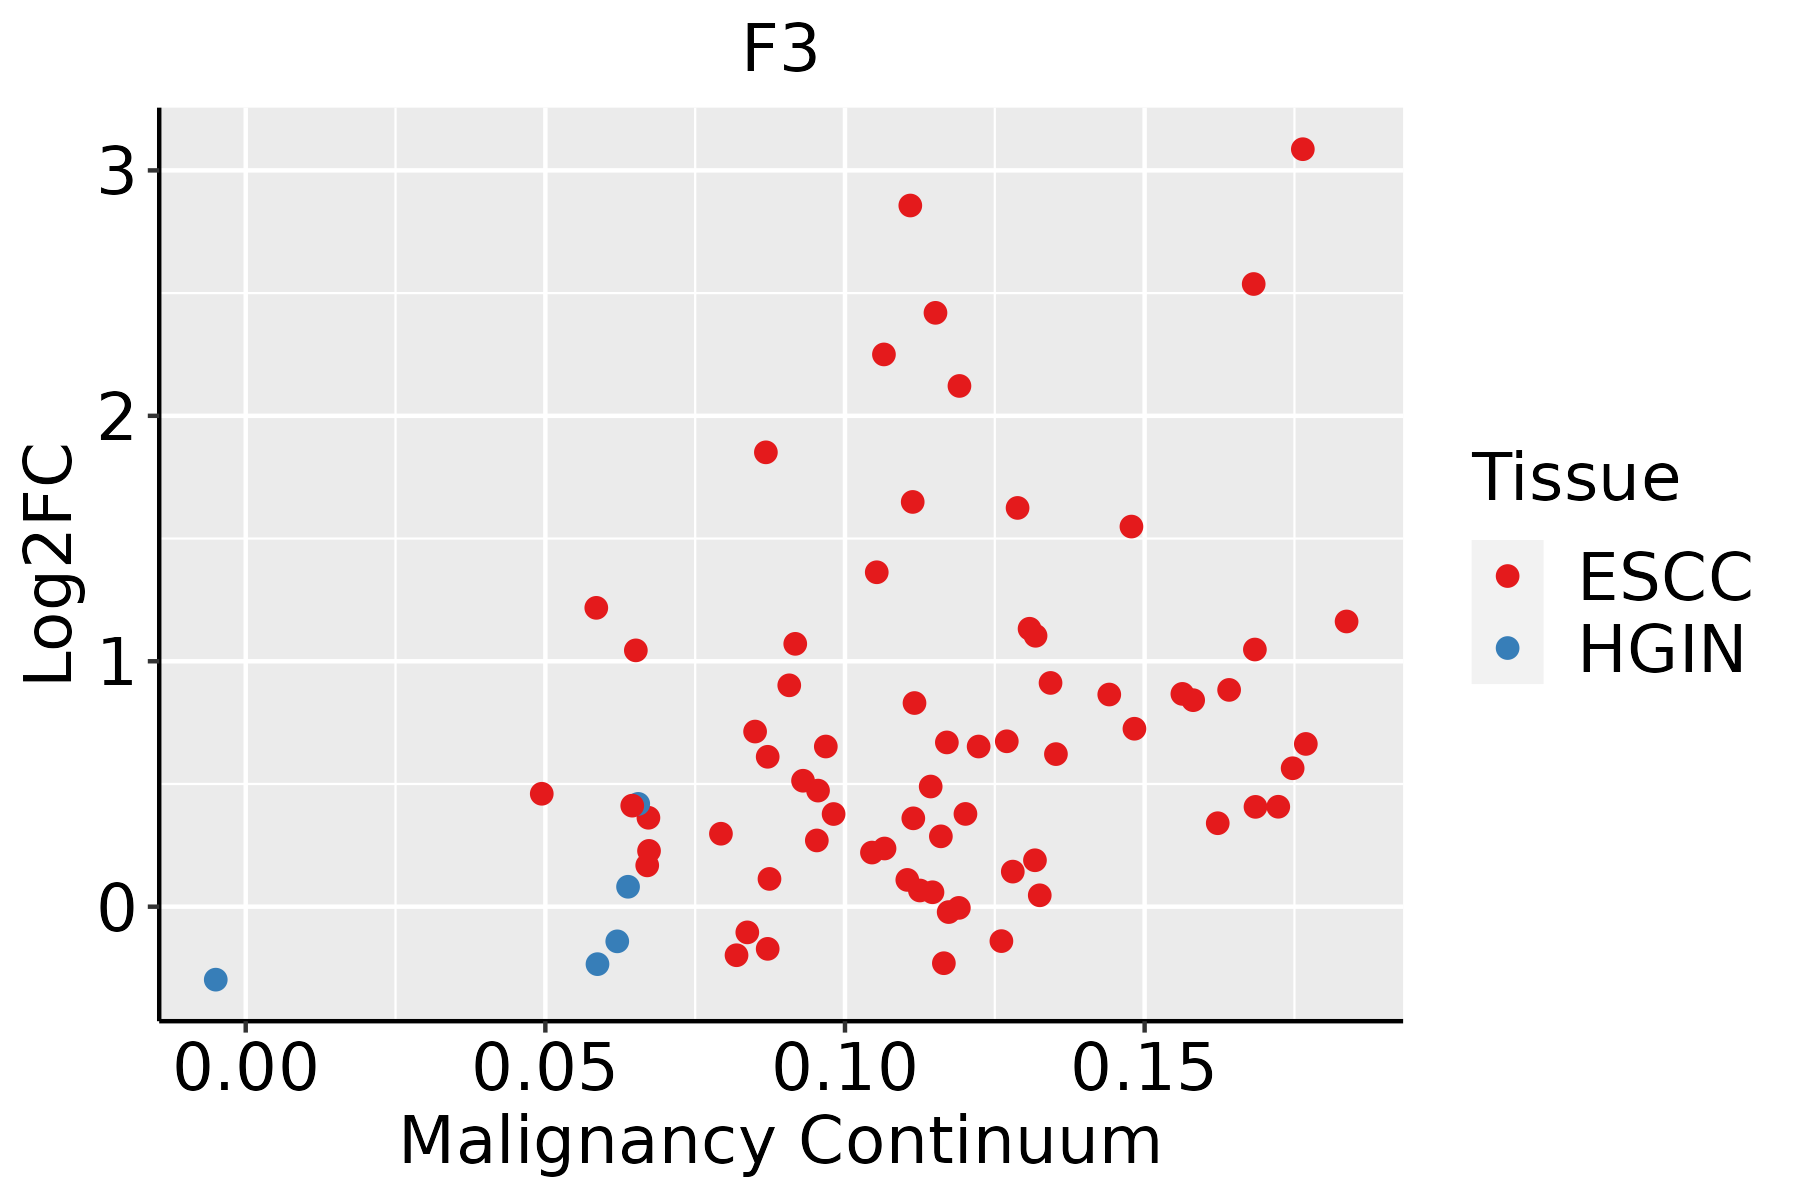 | ESCC: Esophageal squamous cell carcinoma |
| HGIN: High-grade intraepithelial neoplasias | ||
| LGIN: Low-grade intraepithelial neoplasias | ||
| Oral Cavity |  | EOLP: Erosive Oral lichen planus |
| LP: leukoplakia | ||
| NEOLP: Non-erosive oral lichen planus | ||
| OSCC: Oral squamous cell carcinoma | ||
| Prostate | 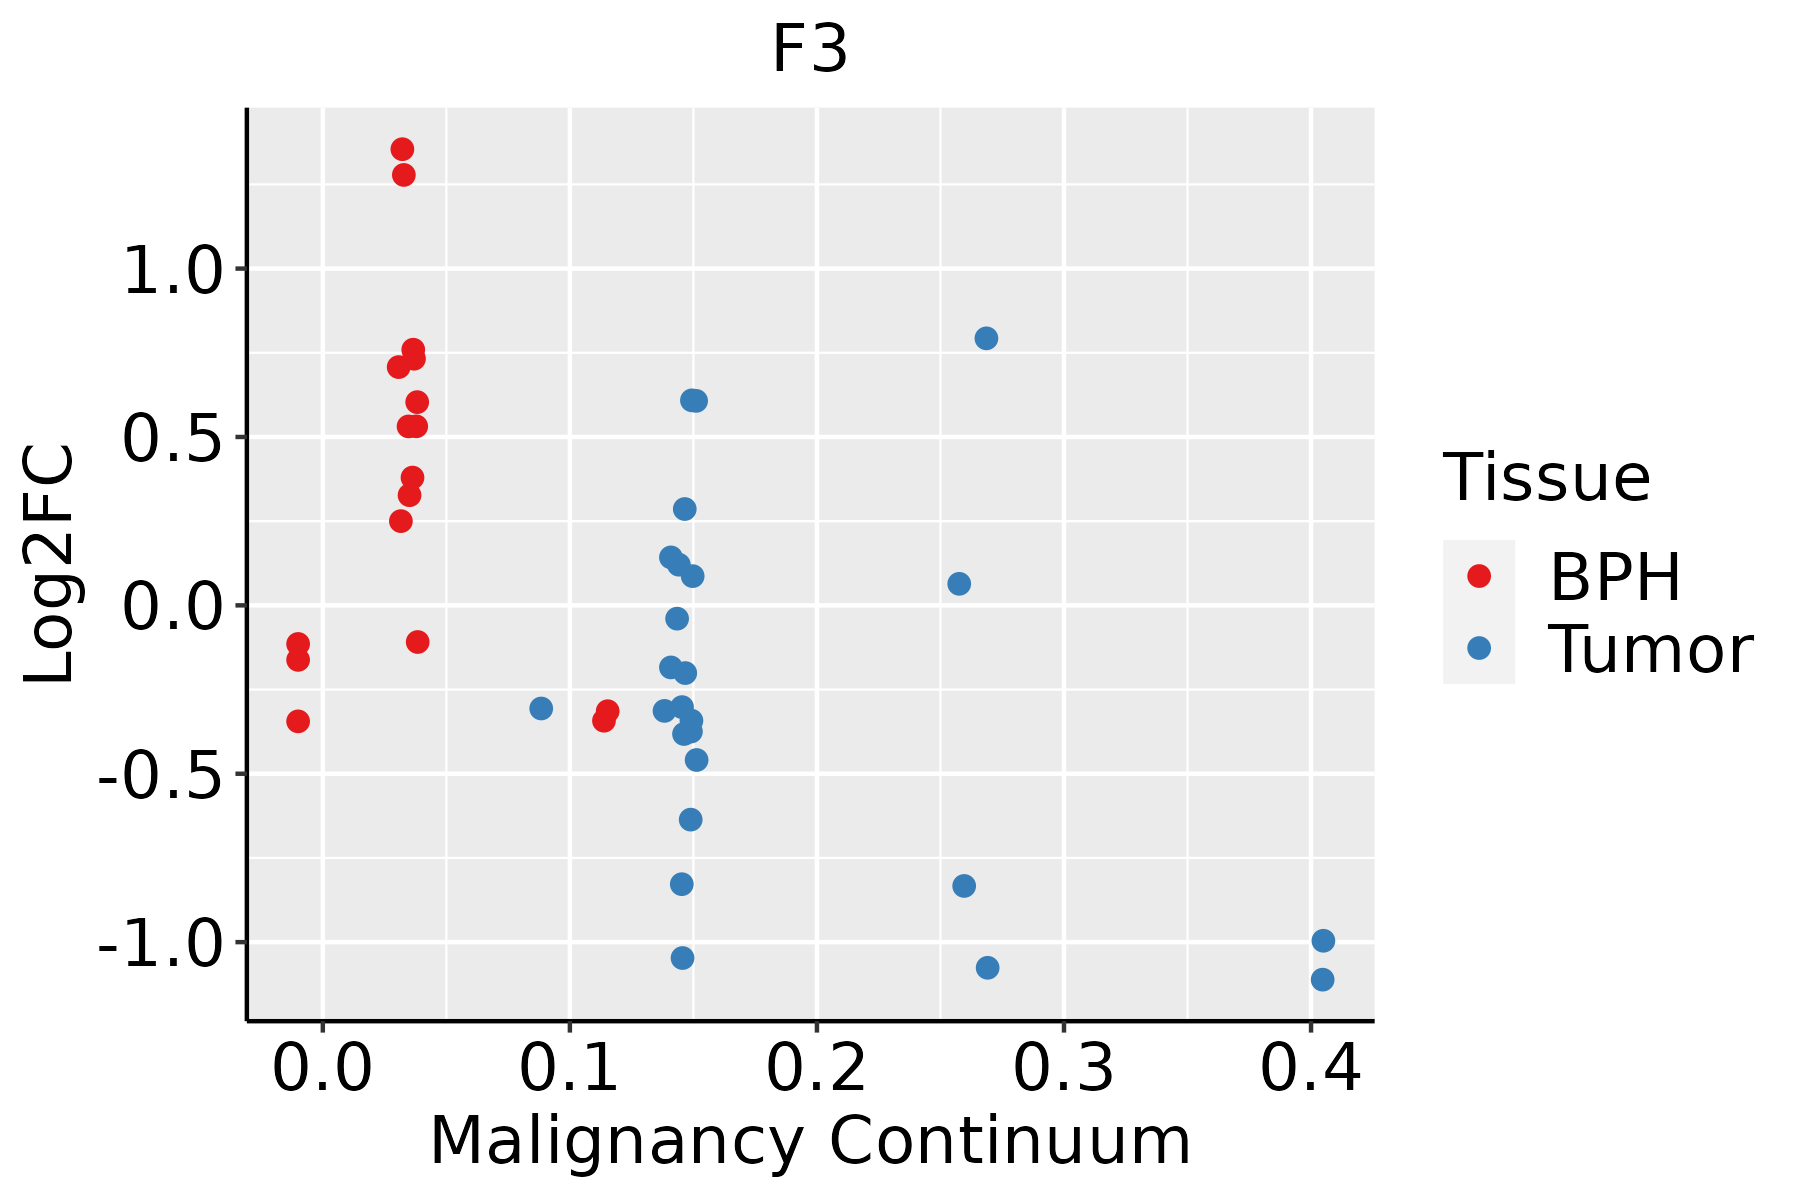 | BPH: Benign Prostatic Hyperplasia |
| Skin | 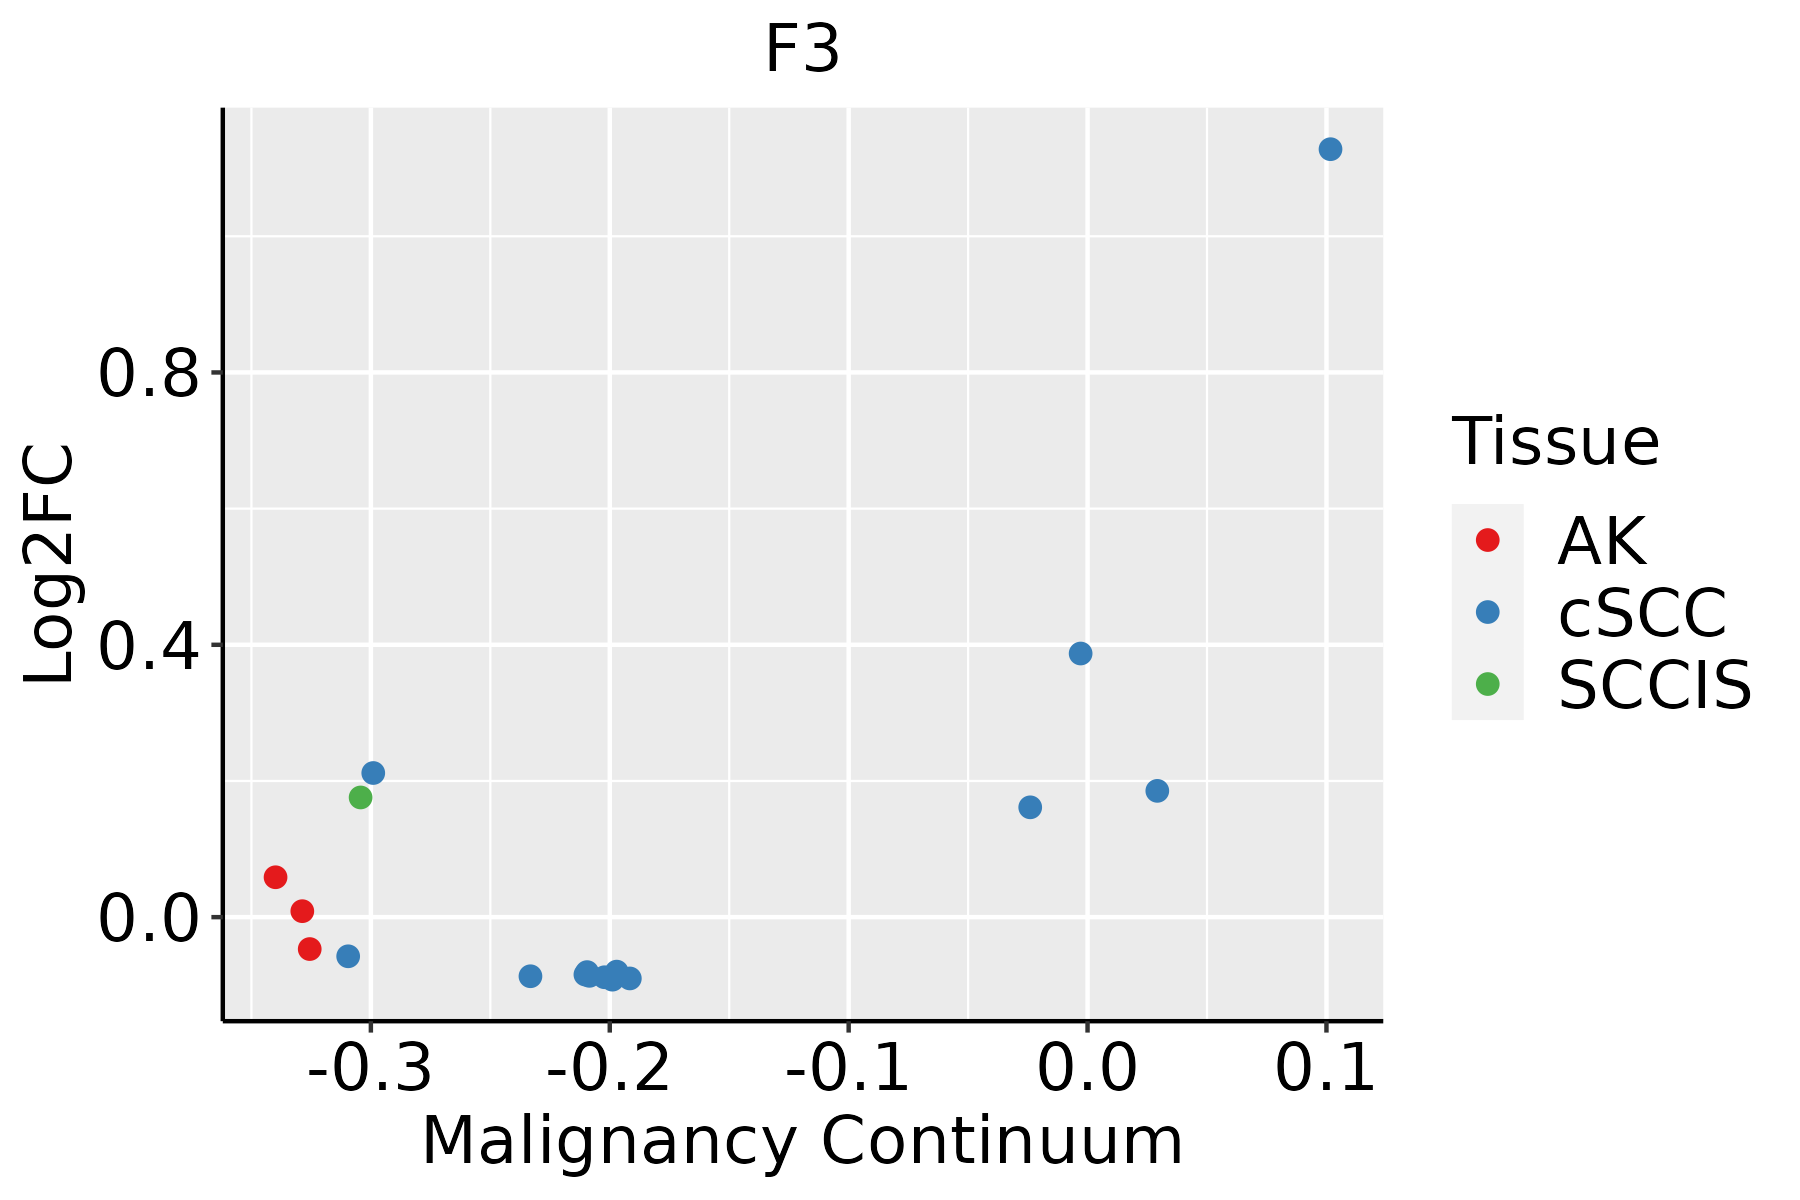 | AK: Actinic keratosis |
| cSCC: Cutaneous squamous cell carcinoma | ||
| SCCIS:squamous cell carcinoma in situ | ||
| Thyroid | 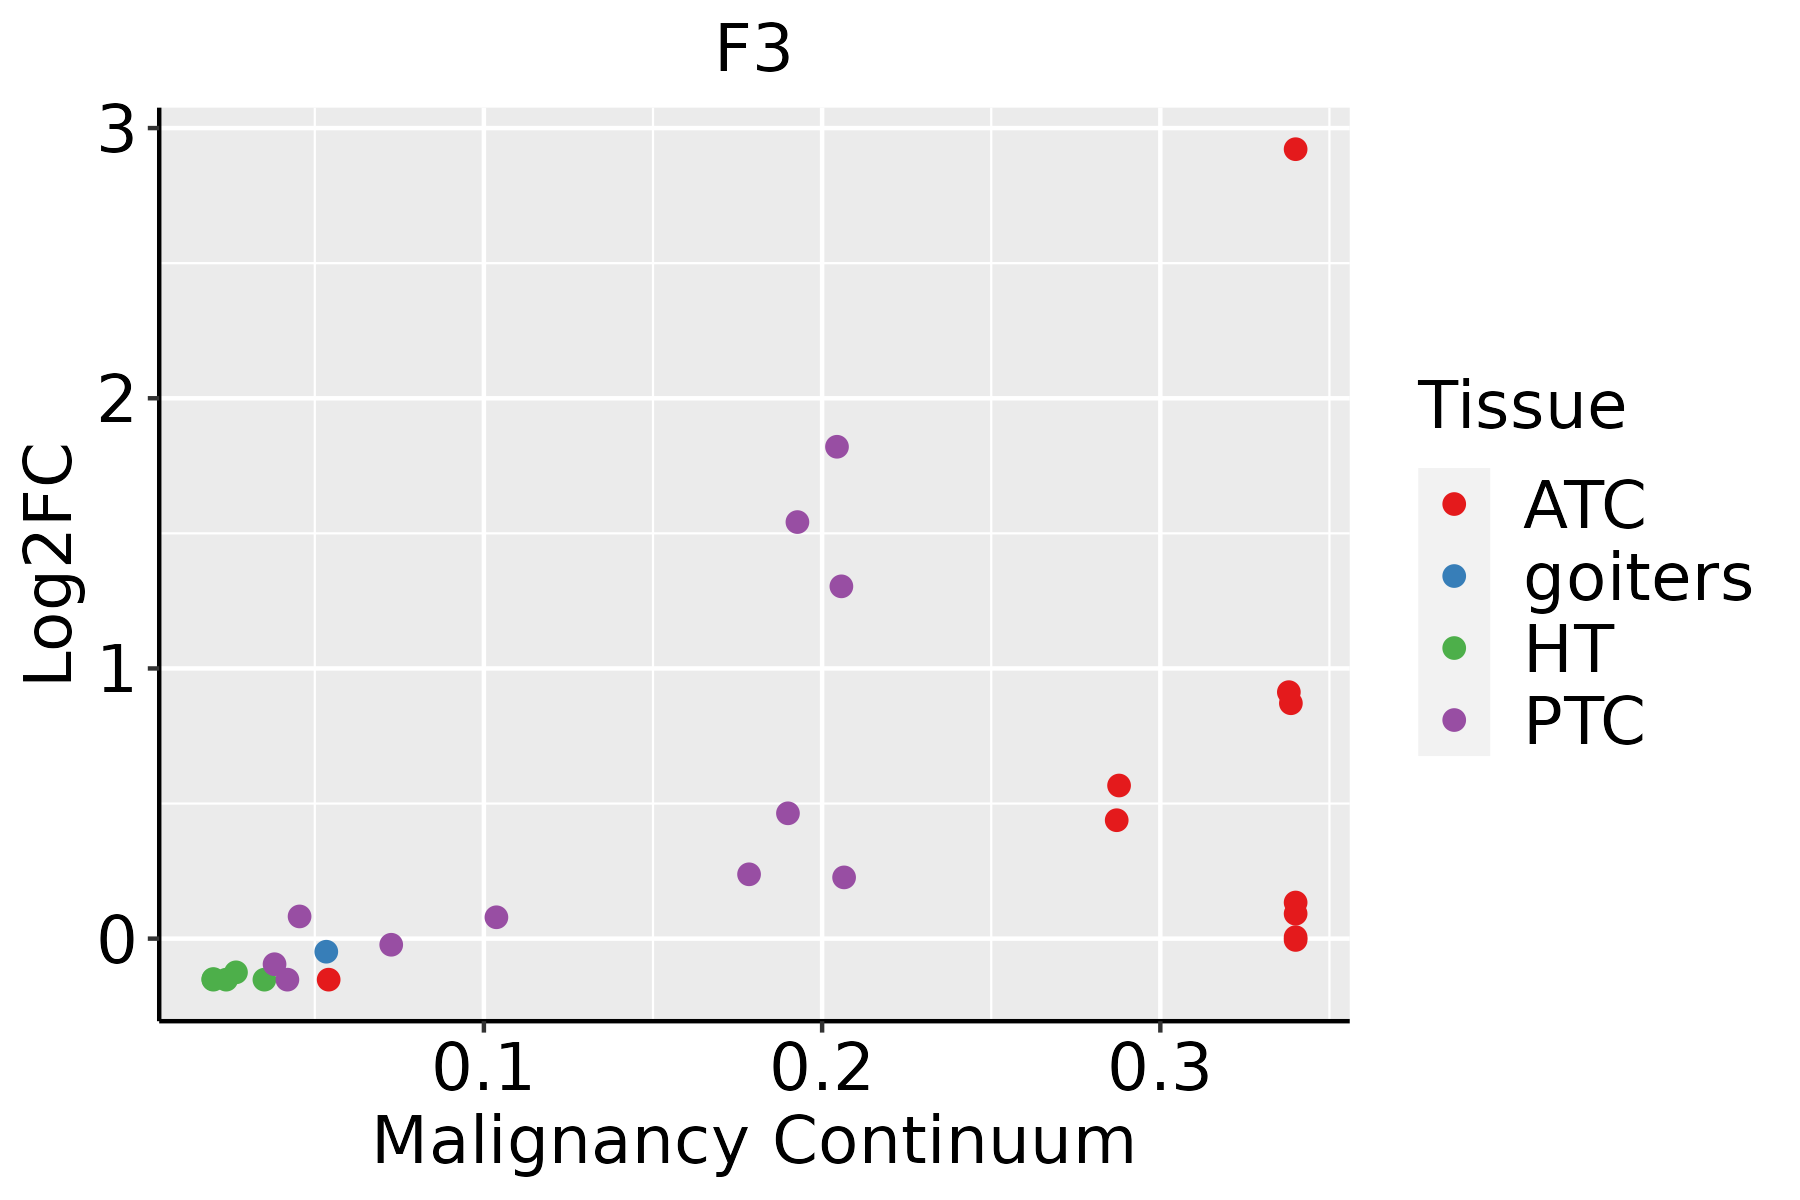 | ATC: Anaplastic thyroid cancer |
| HT: Hashimoto's thyroiditis | ||
| PTC: Papillary thyroid cancer |
| ∗log2FC in expression of this searched gene in stem-like cells from each diseased tissue sample relative to stem-like cells in normal samples in each tissue plotted against the malignancy continuum. Samples are colored based on if they are from different disease stage. |
Top |
Malignant transformation related pathway analysis |
| Find out the enriched GO biological processes and KEGG pathways involved in transition from healthy to precancer to cancer |
| Tissue | Disease Stage | Enriched GO biological Processes |
| Colorectum | AD |  |
| Colorectum | SER |  |
| Colorectum | MSS |  |
| Colorectum | MSI-H |  |
| Colorectum | FAP |  |
| ∗Top 15 enriched GO BP terms are showed in the bar plot of each disease state in each tissue. Each row represents a significant GO biological process which is colored according to the -log10(p.adjust). |
| Page: 1 2 3 4 5 6 7 8 9 |
| GO ID | Tissue | Disease Stage | Description | Gene Ratio | Bg Ratio | pvalue | p.adjust | Count |
| GO:00021819 | Breast | Precancer | cytoplasmic translation | 80/1080 | 148/18723 | 1.59e-59 | 8.54e-56 | 80 |
| GO:00226139 | Breast | Precancer | ribonucleoprotein complex biogenesis | 79/1080 | 463/18723 | 2.11e-18 | 1.03e-15 | 79 |
| GO:20012339 | Breast | Precancer | regulation of apoptotic signaling pathway | 65/1080 | 356/18723 | 7.70e-17 | 3.17e-14 | 65 |
| GO:00718269 | Breast | Precancer | ribonucleoprotein complex subunit organization | 48/1080 | 227/18723 | 2.68e-15 | 8.45e-13 | 48 |
| GO:00226189 | Breast | Precancer | ribonucleoprotein complex assembly | 47/1080 | 220/18723 | 3.47e-15 | 1.03e-12 | 47 |
| GO:00083809 | Breast | Precancer | RNA splicing | 65/1080 | 434/18723 | 1.27e-12 | 2.53e-10 | 65 |
| GO:00434849 | Breast | Precancer | regulation of RNA splicing | 34/1080 | 148/18723 | 2.66e-12 | 4.75e-10 | 34 |
| GO:00064138 | Breast | Precancer | translational initiation | 30/1080 | 118/18723 | 3.23e-12 | 5.58e-10 | 30 |
| GO:00064179 | Breast | Precancer | regulation of translation | 67/1080 | 468/18723 | 4.71e-12 | 7.64e-10 | 67 |
| GO:00457279 | Breast | Precancer | positive regulation of translation | 32/1080 | 136/18723 | 5.89e-12 | 9.27e-10 | 32 |
| GO:00003759 | Breast | Precancer | RNA splicing, via transesterification reactions | 52/1080 | 324/18723 | 1.74e-11 | 2.22e-09 | 52 |
| GO:00003779 | Breast | Precancer | RNA splicing, via transesterification reactions with bulged adenosine as nucleophile | 51/1080 | 320/18723 | 3.55e-11 | 4.04e-09 | 51 |
| GO:00003989 | Breast | Precancer | mRNA splicing, via spliceosome | 51/1080 | 320/18723 | 3.55e-11 | 4.04e-09 | 51 |
| GO:00342509 | Breast | Precancer | positive regulation of cellular amide metabolic process | 33/1080 | 162/18723 | 1.72e-10 | 1.77e-08 | 33 |
| GO:00102578 | Breast | Precancer | NADH dehydrogenase complex assembly | 19/1080 | 57/18723 | 1.93e-10 | 1.92e-08 | 19 |
| GO:00329818 | Breast | Precancer | mitochondrial respiratory chain complex I assembly | 19/1080 | 57/18723 | 1.93e-10 | 1.92e-08 | 19 |
| GO:00331088 | Breast | Precancer | mitochondrial respiratory chain complex assembly | 24/1080 | 93/18723 | 3.39e-10 | 3.16e-08 | 24 |
| GO:00160329 | Breast | Precancer | viral process | 58/1080 | 415/18723 | 3.42e-10 | 3.16e-08 | 58 |
| GO:00069869 | Breast | Precancer | response to unfolded protein | 28/1080 | 137/18723 | 3.81e-09 | 3.00e-07 | 28 |
| GO:00359669 | Breast | Precancer | response to topologically incorrect protein | 29/1080 | 159/18723 | 3.00e-08 | 1.89e-06 | 29 |
| Pathway ID | Tissue | Disease Stage | Description | Gene Ratio | Bg Ratio | pvalue | p.adjust | qvalue | Count |
| hsa049336 | Cervix | CC | AGE-RAGE signaling pathway in diabetic complications | 25/1267 | 100/8465 | 5.64e-03 | 1.88e-02 | 1.11e-02 | 25 |
| hsa0493313 | Cervix | CC | AGE-RAGE signaling pathway in diabetic complications | 25/1267 | 100/8465 | 5.64e-03 | 1.88e-02 | 1.11e-02 | 25 |
| hsa0493310 | Esophagus | ESCC | AGE-RAGE signaling pathway in diabetic complications | 72/4205 | 100/8465 | 4.15e-06 | 2.28e-05 | 1.17e-05 | 72 |
| hsa0493317 | Esophagus | ESCC | AGE-RAGE signaling pathway in diabetic complications | 72/4205 | 100/8465 | 4.15e-06 | 2.28e-05 | 1.17e-05 | 72 |
| hsa049339 | Oral cavity | OSCC | AGE-RAGE signaling pathway in diabetic complications | 69/3704 | 100/8465 | 2.61e-07 | 1.65e-06 | 8.41e-07 | 69 |
| hsa0493316 | Oral cavity | OSCC | AGE-RAGE signaling pathway in diabetic complications | 69/3704 | 100/8465 | 2.61e-07 | 1.65e-06 | 8.41e-07 | 69 |
| hsa049338 | Prostate | BPH | AGE-RAGE signaling pathway in diabetic complications | 36/1718 | 100/8465 | 1.82e-04 | 1.02e-03 | 6.30e-04 | 36 |
| hsa0493315 | Prostate | BPH | AGE-RAGE signaling pathway in diabetic complications | 36/1718 | 100/8465 | 1.82e-04 | 1.02e-03 | 6.30e-04 | 36 |
| hsa0493322 | Prostate | Tumor | AGE-RAGE signaling pathway in diabetic complications | 33/1791 | 100/8465 | 3.79e-03 | 1.36e-02 | 8.46e-03 | 33 |
| hsa0493332 | Prostate | Tumor | AGE-RAGE signaling pathway in diabetic complications | 33/1791 | 100/8465 | 3.79e-03 | 1.36e-02 | 8.46e-03 | 33 |
| Page: 1 |
Top |
Cell-cell communication analysis |
| Identification of potential cell-cell interactions between two cell types and their ligand-receptor pairs for different disease states |
| Ligand | Receptor | LRpair | Pathway | Tissue | Disease Stage |
| CSF3 | CSF3R | CSF3_CSF3R | CSF3 | Breast | Healthy |
| CSF3 | CSF3R | CSF3_CSF3R | CSF3 | Cervix | ADJ |
| CSF3 | CSF3R | CSF3_CSF3R | CSF3 | Cervix | CC |
| CSF3 | CSF3R | CSF3_CSF3R | CSF3 | Cervix | Healthy |
| CSF3 | CSF3R | CSF3_CSF3R | CSF3 | Endometrium | EEC |
| CSF3 | CSF3R | CSF3_CSF3R | CSF3 | Esophagus | ESCC |
| CSF3 | CSF3R | CSF3_CSF3R | CSF3 | HNSCC | ADJ |
| CSF3 | CSF3R | CSF3_CSF3R | CSF3 | HNSCC | OSCC |
| CSF3 | CSF3R | CSF3_CSF3R | CSF3 | HNSCC | Precancer |
| CSF3 | CSF3R | CSF3_CSF3R | CSF3 | Prostate | BPH |
| CSF3 | CSF3R | CSF3_CSF3R | CSF3 | Prostate | Healthy |
| Page: 1 |
Top |
Single-cell gene regulatory network inference analysis |
| Find out the significant the regulons (TFs) and the target genes of each regulon across cell types for different disease states |
| TF | Cell Type | Tissue | Disease Stage | Target Gene | RSS | Regulon Activity |
| ∗The dot plots of a searched regulon are shown for all cell subpopulations in each disease state of each tissue based on the regulon specific score inferred using pySCENIC and by calculating the average expression. |
| Page: 1 |
Top |
Somatic mutation of malignant transformation related genes |
| Annotation of somatic variants for genes involved in malignant transformation |
| Hugo Symbol | Variant Class | Variant Classification | dbSNP RS | HGVSc | HGVSp | HGVSp Short | SWISSPROT | BIOTYPE | SIFT | PolyPhen | Tumor Sample Barcode | Tissue | Histology | Sex | Age | Stage | Therapy Types | Drugs | Outcome |
| F3 | SNV | Missense_Mutation | novel | c.404N>G | p.Tyr135Cys | p.Y135C | P13726 | protein_coding | deleterious(0) | probably_damaging(0.974) | TCGA-5M-AAT6-01 | Colorectum | colon adenocarcinoma | Female | <65 | III/IV | Unknown | Unknown | PD |
| F3 | SNV | Missense_Mutation | c.521N>A | p.Ser174Asn | p.S174N | P13726 | protein_coding | deleterious(0.02) | possibly_damaging(0.772) | TCGA-AA-3858-01 | Colorectum | colon adenocarcinoma | Male | >=65 | I/II | Unknown | Unknown | SD | |
| F3 | SNV | Missense_Mutation | novel | c.127A>G | p.Asn43Asp | p.N43D | P13726 | protein_coding | deleterious(0.04) | possibly_damaging(0.479) | TCGA-AG-A002-01 | Colorectum | rectum adenocarcinoma | Male | <65 | I/II | Unknown | Unknown | SD |
| F3 | SNV | Missense_Mutation | c.529G>T | p.Asp177Tyr | p.D177Y | P13726 | protein_coding | deleterious(0) | probably_damaging(0.964) | TCGA-EI-6513-01 | Colorectum | rectum adenocarcinoma | Male | <65 | III/IV | Unknown | Unknown | SD | |
| F3 | deletion | In_Frame_Del | c.326_328delCCT | p.Ser109del | p.S109del | P13726 | protein_coding | TCGA-AG-A02N-01 | Colorectum | rectum adenocarcinoma | Male | >=65 | I/II | Chemotherapy | folinic | CR | |||
| F3 | SNV | Missense_Mutation | rs187119941 | c.475G>A | p.Val159Ile | p.V159I | P13726 | protein_coding | tolerated(0.33) | benign(0.04) | TCGA-A5-A0R7-01 | Endometrium | uterine corpus endometrioid carcinoma | Female | <65 | I/II | Unknown | Unknown | SD |
| F3 | SNV | Missense_Mutation | c.242N>T | p.Cys81Phe | p.C81F | P13726 | protein_coding | deleterious(0) | probably_damaging(1) | TCGA-AP-A0LM-01 | Endometrium | uterine corpus endometrioid carcinoma | Female | <65 | III/IV | Chemotherapy | cisplatin | SD | |
| F3 | SNV | Missense_Mutation | rs759484806 | c.421G>A | p.Gly141Arg | p.G141R | P13726 | protein_coding | deleterious(0) | probably_damaging(0.996) | TCGA-AX-A2HD-01 | Endometrium | uterine corpus endometrioid carcinoma | Female | >=65 | III/IV | Unknown | Unknown | SD |
| F3 | SNV | Missense_Mutation | novel | c.509A>C | p.Asn170Thr | p.N170T | P13726 | protein_coding | deleterious(0) | benign(0) | TCGA-B5-A3FC-01 | Endometrium | uterine corpus endometrioid carcinoma | Female | <65 | I/II | Unknown | Unknown | SD |
| F3 | SNV | Missense_Mutation | novel | c.334G>A | p.Ala112Thr | p.A112T | P13726 | protein_coding | tolerated(0.45) | benign(0.062) | TCGA-B5-A3FC-01 | Endometrium | uterine corpus endometrioid carcinoma | Female | <65 | I/II | Unknown | Unknown | SD |
| Page: 1 2 3 |
Top |
Related drugs of malignant transformation related genes |
| Identification of chemicals and drugs interact with genes involved in malignant transfromation |
| (DGIdb 4.0) |
| Entrez ID | Symbol | Category | Interaction Types | Drug Claim Name | Drug Name | PMIDs |
| 2152 | F3 | DRUGGABLE GENOME, CELL SURFACE | ALT-836 | |||
| 2152 | F3 | DRUGGABLE GENOME, CELL SURFACE | MORAb-066 | |||
| 2152 | F3 | DRUGGABLE GENOME, CELL SURFACE | TT-173 | |||
| 2152 | F3 | DRUGGABLE GENOME, CELL SURFACE | simvastatin | SIMVASTATIN | 19027114 |
| Page: 1 |

Copyright 2023-Present -The University of Texas Health Science Center at Houston |