
|
|||||
|
 | |
| |
| |
| |
| |
| |
|
Gene: F2RL3 |
Gene summary for F2RL3 |
| Gene information | Species | Human | Gene symbol | F2RL3 | Gene ID | 9002 |
| Gene name | F2R like thrombin or trypsin receptor 3 | |
| Gene Alias | PAR4 | |
| Cytomap | 19p13.11 | |
| Gene Type | protein-coding | GO ID | GO:0001775 | UniProtAcc | Q96RI0 |
Top |
Malignant transformation analysis |
| Identification of the aberrant gene expression in precancerous and cancerous lesions by comparing the gene expression of stem-like cells in diseased tissues with normal stem cells |
| Entrez ID | Symbol | Replicates | Species | Organ | Tissue | Adj P-value | Log2FC | Malignancy |
| 9002 | F2RL3 | HCC1 | Human | Liver | HCC | 3.29e-07 | 1.41e+00 | 0.5336 |
| 9002 | F2RL3 | HCC2 | Human | Liver | HCC | 3.91e-14 | 1.29e+00 | 0.5341 |
| 9002 | F2RL3 | HCC5 | Human | Liver | HCC | 3.25e-10 | 6.47e-01 | 0.4932 |
| Page: 1 |
| Tissue | Expression Dynamics | Abbreviation |
| Liver | 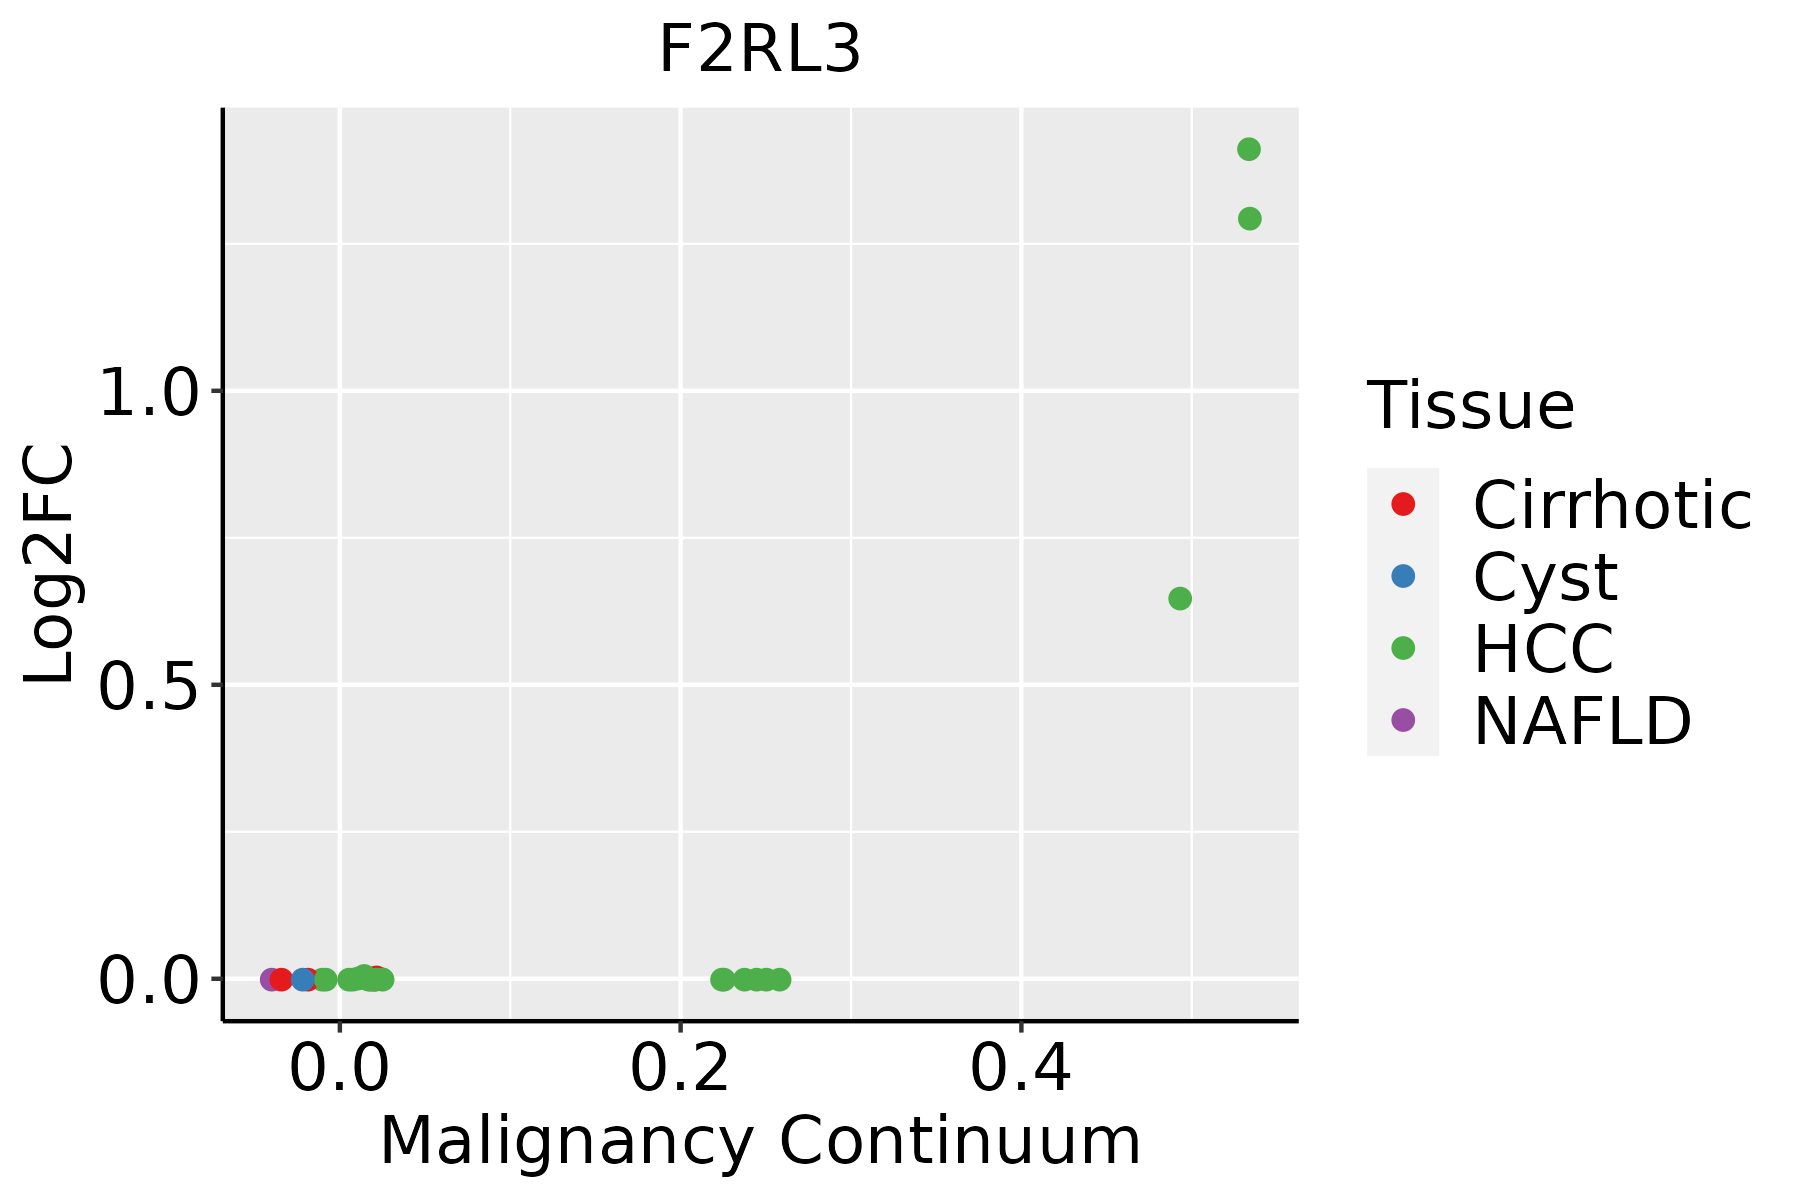 | HCC: Hepatocellular carcinoma |
| NAFLD: Non-alcoholic fatty liver disease |
| ∗log2FC in expression of this searched gene in stem-like cells from each diseased tissue sample relative to stem-like cells in normal samples in each tissue plotted against the malignancy continuum. Samples are colored based on if they are from different disease stage. |
Top |
Malignant transformation related pathway analysis |
| Find out the enriched GO biological processes and KEGG pathways involved in transition from healthy to precancer to cancer |
| Tissue | Disease Stage | Enriched GO biological Processes |
| Colorectum | AD |  |
| Colorectum | SER |  |
| Colorectum | MSS |  |
| Colorectum | MSI-H |  |
| Colorectum | FAP |  |
| ∗Top 15 enriched GO BP terms are showed in the bar plot of each disease state in each tissue. Each row represents a significant GO biological process which is colored according to the -log10(p.adjust). |
| Page: 1 2 3 4 5 6 7 8 9 |
| GO ID | Tissue | Disease Stage | Description | Gene Ratio | Bg Ratio | pvalue | p.adjust | Count |
| GO:001605021 | Liver | HCC | vesicle organization | 194/7958 | 300/18723 | 5.58e-15 | 3.97e-13 | 194 |
| GO:005123521 | Liver | HCC | maintenance of location | 185/7958 | 327/18723 | 1.70e-07 | 3.12e-06 | 185 |
| GO:000726521 | Liver | HCC | Ras protein signal transduction | 187/7958 | 337/18723 | 8.89e-07 | 1.35e-05 | 187 |
| GO:004206022 | Liver | HCC | wound healing | 219/7958 | 422/18723 | 5.34e-05 | 5.04e-04 | 219 |
| GO:005165112 | Liver | HCC | maintenance of location in cell | 119/7958 | 214/18723 | 7.11e-05 | 6.39e-04 | 119 |
| GO:00075962 | Liver | HCC | blood coagulation | 118/7958 | 217/18723 | 2.63e-04 | 1.94e-03 | 118 |
| GO:00075992 | Liver | HCC | hemostasis | 119/7958 | 222/18723 | 5.25e-04 | 3.41e-03 | 119 |
| GO:00508172 | Liver | HCC | coagulation | 118/7958 | 222/18723 | 8.41e-04 | 5.03e-03 | 118 |
| GO:005087822 | Liver | HCC | regulation of body fluid levels | 191/7958 | 379/18723 | 1.06e-03 | 6.11e-03 | 191 |
| GO:000726621 | Liver | HCC | Rho protein signal transduction | 76/7958 | 137/18723 | 1.46e-03 | 7.75e-03 | 76 |
| GO:004657811 | Liver | HCC | regulation of Ras protein signal transduction | 100/7958 | 189/18723 | 2.42e-03 | 1.18e-02 | 100 |
| Page: 1 |
| Pathway ID | Tissue | Disease Stage | Description | Gene Ratio | Bg Ratio | pvalue | p.adjust | qvalue | Count |
| hsa046104 | Liver | HCC | Complement and coagulation cascades | 57/4020 | 86/8465 | 3.19e-04 | 1.45e-03 | 8.04e-04 | 57 |
| hsa046112 | Liver | HCC | Platelet activation | 71/4020 | 124/8465 | 1.77e-02 | 4.15e-02 | 2.31e-02 | 71 |
| hsa046105 | Liver | HCC | Complement and coagulation cascades | 57/4020 | 86/8465 | 3.19e-04 | 1.45e-03 | 8.04e-04 | 57 |
| hsa0461111 | Liver | HCC | Platelet activation | 71/4020 | 124/8465 | 1.77e-02 | 4.15e-02 | 2.31e-02 | 71 |
| Page: 1 |
Top |
Cell-cell communication analysis |
| Identification of potential cell-cell interactions between two cell types and their ligand-receptor pairs for different disease states |
| Ligand | Receptor | LRpair | Pathway | Tissue | Disease Stage |
| CTSG | F2RL3 | CTSG_F2RL3 | PARs | Breast | Healthy |
| GZMA | F2RL3 | GZMA_F2RL3 | PARs | Breast | Healthy |
| PRSS3 | F2RL3 | PRSS3_F2RL3 | PARs | CRC | AD |
| CTSG | F2RL3 | CTSG_F2RL3 | PARs | CRC | AD |
| GZMA | F2RL3 | GZMA_F2RL3 | PARs | CRC | AD |
| GZMA | F2RL3 | GZMA_F2RL3 | PARs | Esophagus | ESCC |
| PRSS3 | F2RL3 | PRSS3_F2RL3 | PARs | HNSCC | OSCC |
| CTSG | F2RL3 | CTSG_F2RL3 | PARs | HNSCC | OSCC |
| GZMA | F2RL3 | GZMA_F2RL3 | PARs | HNSCC | OSCC |
| GZMA | F2RL3 | GZMA_F2RL3 | PARs | THCA | Cancer |
| Page: 1 |
Top |
Single-cell gene regulatory network inference analysis |
| Find out the significant the regulons (TFs) and the target genes of each regulon across cell types for different disease states |
| TF | Cell Type | Tissue | Disease Stage | Target Gene | RSS | Regulon Activity |
| ∗The dot plots of a searched regulon are shown for all cell subpopulations in each disease state of each tissue based on the regulon specific score inferred using pySCENIC and by calculating the average expression. |
| Page: 1 |
Top |
Somatic mutation of malignant transformation related genes |
| Annotation of somatic variants for genes involved in malignant transformation |
| Hugo Symbol | Variant Class | Variant Classification | dbSNP RS | HGVSc | HGVSp | HGVSp Short | SWISSPROT | BIOTYPE | SIFT | PolyPhen | Tumor Sample Barcode | Tissue | Histology | Sex | Age | Stage | Therapy Types | Drugs | Outcome |
| F2RL3 | SNV | Missense_Mutation | rs201593664 | c.940N>A | p.Ala314Thr | p.A314T | Q96RI0 | protein_coding | tolerated(0.59) | benign(0.013) | TCGA-A2-A1FW-01 | Breast | breast invasive carcinoma | Female | <65 | III/IV | Chemotherapy | cytoxan | SD |
| F2RL3 | SNV | Missense_Mutation | rs372809419 | c.1118G>A | p.Gly373Asp | p.G373D | Q96RI0 | protein_coding | tolerated(0.52) | benign(0.003) | TCGA-BI-A0VR-01 | Cervix | cervical & endocervical cancer | Female | <65 | III/IV | Unknown | Unknown | SD |
| F2RL3 | SNV | Missense_Mutation | c.1017N>G | p.Ile339Met | p.I339M | Q96RI0 | protein_coding | deleterious(0) | possibly_damaging(0.659) | TCGA-C5-A1BN-01 | Cervix | cervical & endocervical cancer | Female | <65 | I/II | Chemotherapy | cisplatin | PD | |
| F2RL3 | deletion | In_Frame_Del | novel | c.897_899delNNN | p.Asn300del | p.N300del | Q96RI0 | protein_coding | TCGA-DS-A1OD-01 | Cervix | cervical & endocervical cancer | Female | <65 | I/II | Chemotherapy | cisplatin | SD | ||
| F2RL3 | SNV | Missense_Mutation | rs775233424 | c.746N>T | p.Ala249Val | p.A249V | Q96RI0 | protein_coding | tolerated(0.96) | benign(0.035) | TCGA-AA-3502-01 | Colorectum | colon adenocarcinoma | Male | >=65 | I/II | Unknown | Unknown | SD |
| F2RL3 | SNV | Missense_Mutation | novel | c.974N>T | p.Ser325Ile | p.S325I | Q96RI0 | protein_coding | deleterious(0.01) | probably_damaging(0.986) | TCGA-AA-3713-01 | Colorectum | colon adenocarcinoma | Male | >=65 | III/IV | Chemotherapy | 5-fluorouracil | PR |
| F2RL3 | SNV | Missense_Mutation | novel | c.892N>T | p.Pro298Ser | p.P298S | Q96RI0 | protein_coding | deleterious(0) | probably_damaging(1) | TCGA-D1-A175-01 | Endometrium | uterine corpus endometrioid carcinoma | Female | <65 | I/II | Chemotherapy | paclitaxel | SD |
| F2RL3 | SNV | Missense_Mutation | novel | c.203G>C | p.Arg68Pro | p.R68P | Q96RI0 | protein_coding | deleterious(0.02) | possibly_damaging(0.511) | TCGA-DI-A2QY-01 | Endometrium | uterine corpus endometrioid carcinoma | Female | <65 | I/II | Chemotherapy | paclitaxel | CR |
| F2RL3 | SNV | Missense_Mutation | c.1036N>A | p.Glu346Lys | p.E346K | Q96RI0 | protein_coding | deleterious(0.01) | possibly_damaging(0.883) | TCGA-EY-A1G8-01 | Endometrium | uterine corpus endometrioid carcinoma | Female | >=65 | I/II | Unknown | Unknown | SD | |
| F2RL3 | SNV | Missense_Mutation | novel | c.998N>A | p.Ser333Asn | p.S333N | Q96RI0 | protein_coding | deleterious(0.03) | probably_damaging(0.999) | TCGA-PG-A917-01 | Endometrium | uterine corpus endometrioid carcinoma | Female | >=65 | I/II | Unknown | Unknown | SD |
| Page: 1 2 3 |
Top |
Related drugs of malignant transformation related genes |
| Identification of chemicals and drugs interact with genes involved in malignant transfromation |
| (DGIdb 4.0) |
| Entrez ID | Symbol | Category | Interaction Types | Drug Claim Name | Drug Name | PMIDs |
| 9002 | F2RL3 | G PROTEIN COUPLED RECEPTOR, DRUGGABLE GENOME | antagonist | 381744952 | ||
| 9002 | F2RL3 | G PROTEIN COUPLED RECEPTOR, DRUGGABLE GENOME | antagonist | 329968398 | ||
| 9002 | F2RL3 | G PROTEIN COUPLED RECEPTOR, DRUGGABLE GENOME | agonist | 178100603 | ||
| 9002 | F2RL3 | G PROTEIN COUPLED RECEPTOR, DRUGGABLE GENOME | RUSALATIDE | RUSALATIDE | ||
| 9002 | F2RL3 | G PROTEIN COUPLED RECEPTOR, DRUGGABLE GENOME | VORAPAXAR | VORAPAXAR | ||
| 9002 | F2RL3 | G PROTEIN COUPLED RECEPTOR, DRUGGABLE GENOME | antagonist | 385612202 | ||
| 9002 | F2RL3 | G PROTEIN COUPLED RECEPTOR, DRUGGABLE GENOME | agonist | 178100719 | ||
| 9002 | F2RL3 | G PROTEIN COUPLED RECEPTOR, DRUGGABLE GENOME | antagonist | 329968399 | ||
| 9002 | F2RL3 | G PROTEIN COUPLED RECEPTOR, DRUGGABLE GENOME | agonist | 178100885 | ||
| 9002 | F2RL3 | G PROTEIN COUPLED RECEPTOR, DRUGGABLE GENOME | antagonist | 381744951 |
| Page: 1 2 |

Copyright 2023-Present -The University of Texas Health Science Center at Houston |