
|
|||||
|
 | |
| |
| |
| |
| |
| |
|
Gene: F12 |
Gene summary for F12 |
| Gene information | Species | Human | Gene symbol | F12 | Gene ID | 2161 |
| Gene name | coagulation factor XII | |
| Gene Alias | HAE3 | |
| Cytomap | 5q35.3 | |
| Gene Type | protein-coding | GO ID | GO:0002254 | UniProtAcc | P00748 |
Top |
Malignant transformation analysis |
| Identification of the aberrant gene expression in precancerous and cancerous lesions by comparing the gene expression of stem-like cells in diseased tissues with normal stem cells |
| Entrez ID | Symbol | Replicates | Species | Organ | Tissue | Adj P-value | Log2FC | Malignancy |
| 2161 | F12 | LZE4T | Human | Esophagus | ESCC | 1.33e-06 | 2.02e-01 | 0.0811 |
| 2161 | F12 | LZE24T | Human | Esophagus | ESCC | 3.87e-07 | 3.38e-01 | 0.0596 |
| 2161 | F12 | LZE21T | Human | Esophagus | ESCC | 8.73e-03 | 4.30e-01 | 0.0655 |
| 2161 | F12 | LZE6T | Human | Esophagus | ESCC | 2.64e-03 | 1.92e-01 | 0.0845 |
| 2161 | F12 | P1T-E | Human | Esophagus | ESCC | 4.64e-02 | 2.89e-01 | 0.0875 |
| 2161 | F12 | P2T-E | Human | Esophagus | ESCC | 1.29e-09 | 2.60e-01 | 0.1177 |
| 2161 | F12 | P4T-E | Human | Esophagus | ESCC | 3.08e-29 | 8.28e-01 | 0.1323 |
| 2161 | F12 | P5T-E | Human | Esophagus | ESCC | 1.41e-35 | 7.80e-01 | 0.1327 |
| 2161 | F12 | P9T-E | Human | Esophagus | ESCC | 4.63e-08 | 2.49e-01 | 0.1131 |
| 2161 | F12 | P10T-E | Human | Esophagus | ESCC | 7.44e-16 | 3.02e-01 | 0.116 |
| 2161 | F12 | P11T-E | Human | Esophagus | ESCC | 1.28e-03 | 3.17e-01 | 0.1426 |
| 2161 | F12 | P12T-E | Human | Esophagus | ESCC | 4.33e-24 | 6.02e-01 | 0.1122 |
| 2161 | F12 | P15T-E | Human | Esophagus | ESCC | 3.66e-26 | 6.47e-01 | 0.1149 |
| 2161 | F12 | P16T-E | Human | Esophagus | ESCC | 4.79e-16 | 3.87e-01 | 0.1153 |
| 2161 | F12 | P17T-E | Human | Esophagus | ESCC | 1.57e-05 | 2.99e-01 | 0.1278 |
| 2161 | F12 | P19T-E | Human | Esophagus | ESCC | 1.10e-02 | 7.09e-01 | 0.1662 |
| 2161 | F12 | P20T-E | Human | Esophagus | ESCC | 1.16e-17 | 4.24e-01 | 0.1124 |
| 2161 | F12 | P21T-E | Human | Esophagus | ESCC | 4.64e-28 | 6.15e-01 | 0.1617 |
| 2161 | F12 | P22T-E | Human | Esophagus | ESCC | 2.01e-19 | 4.29e-01 | 0.1236 |
| 2161 | F12 | P23T-E | Human | Esophagus | ESCC | 3.95e-12 | 4.44e-01 | 0.108 |
| Page: 1 2 3 4 5 |
| Tissue | Expression Dynamics | Abbreviation |
| Esophagus | 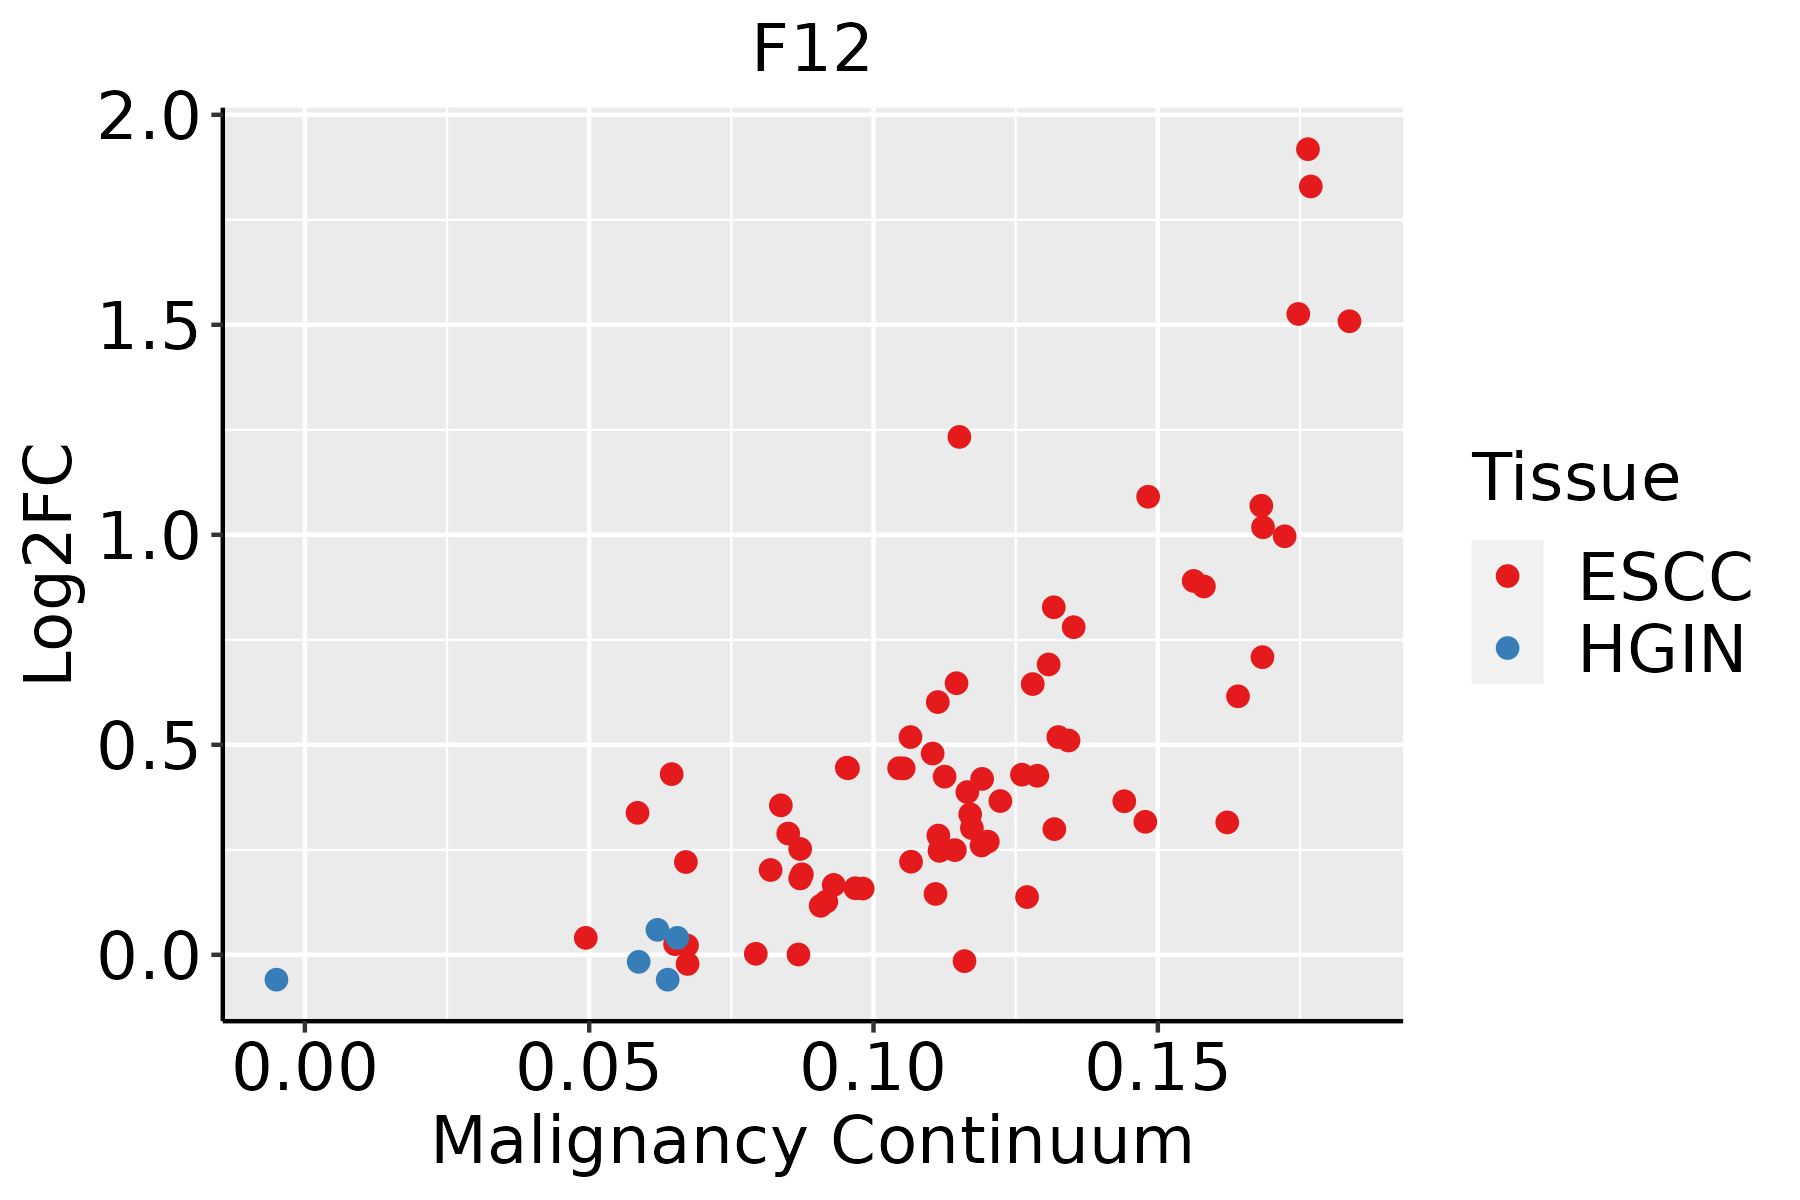 | ESCC: Esophageal squamous cell carcinoma |
| HGIN: High-grade intraepithelial neoplasias | ||
| LGIN: Low-grade intraepithelial neoplasias | ||
| Liver | 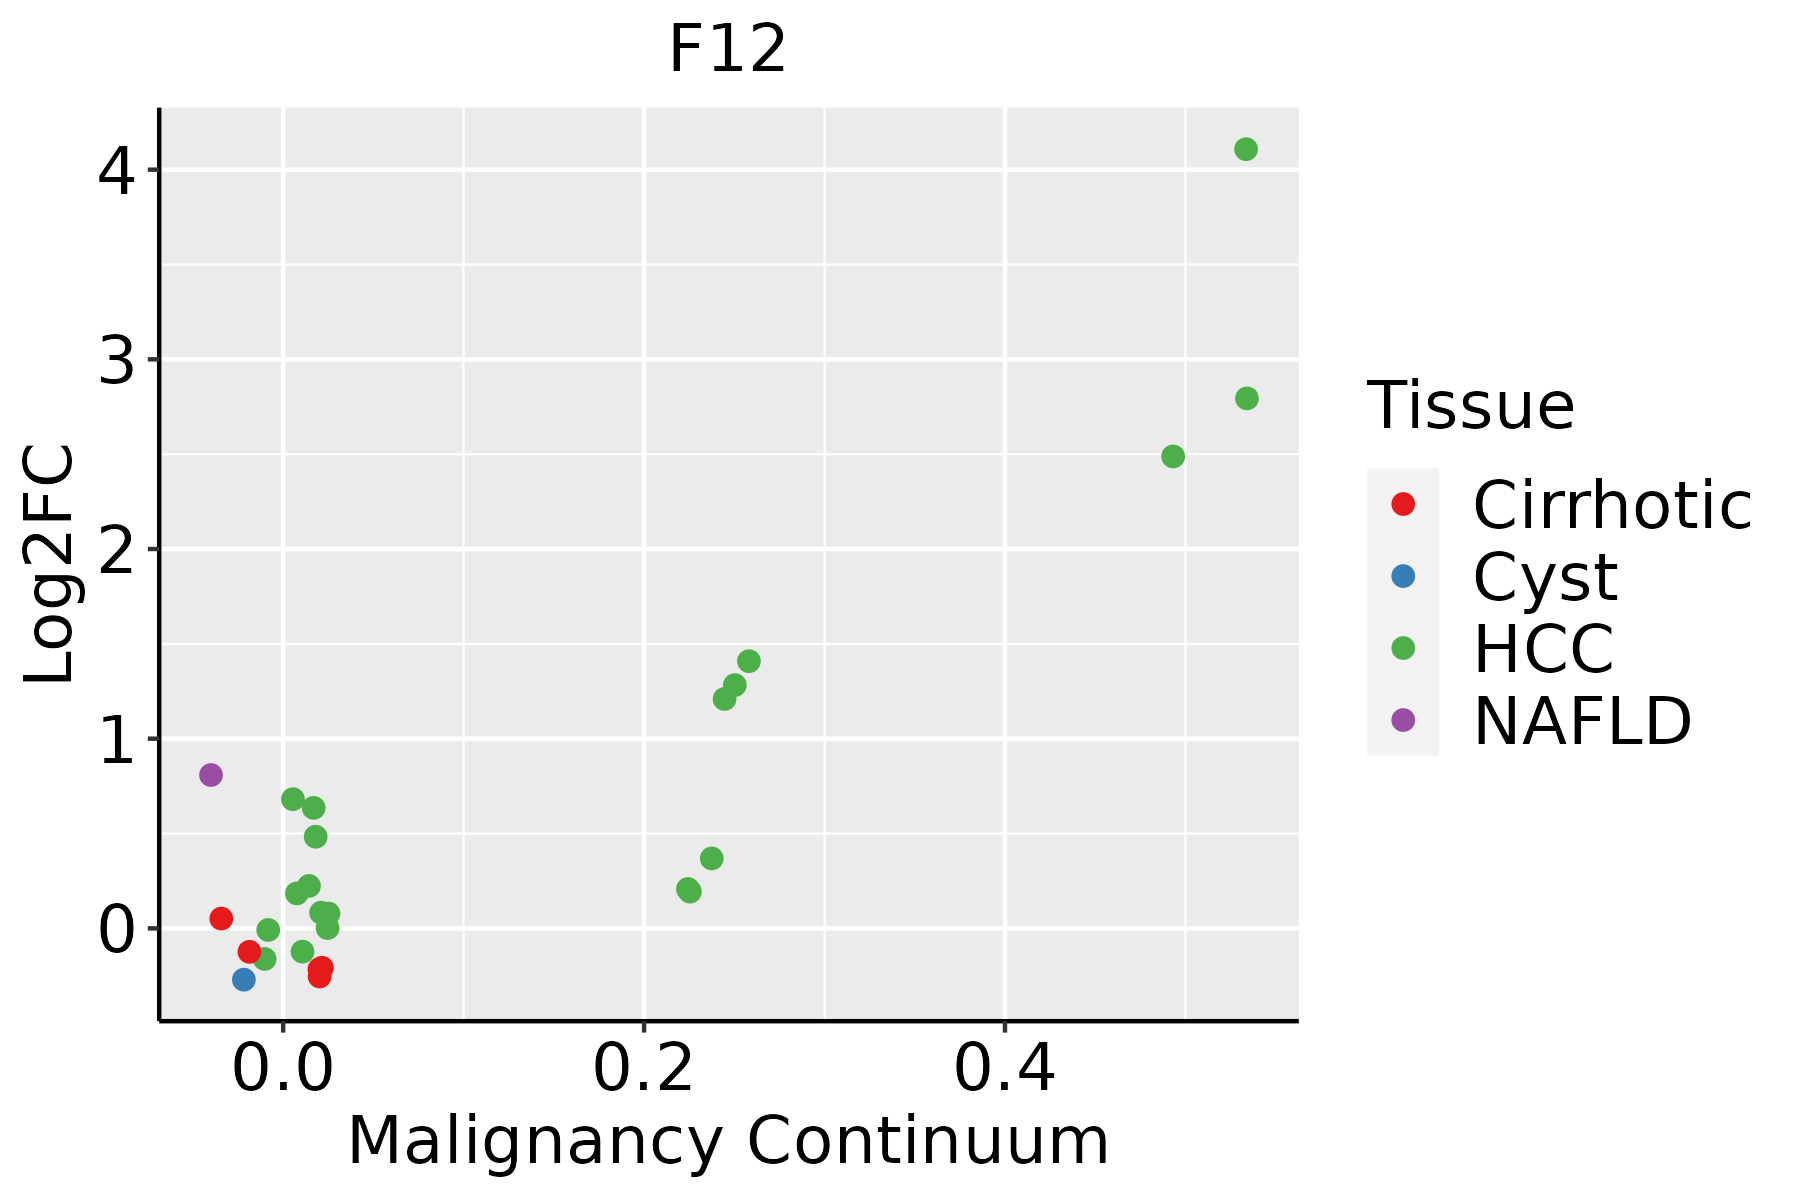 | HCC: Hepatocellular carcinoma |
| NAFLD: Non-alcoholic fatty liver disease | ||
| Oral Cavity |  | EOLP: Erosive Oral lichen planus |
| LP: leukoplakia | ||
| NEOLP: Non-erosive oral lichen planus | ||
| OSCC: Oral squamous cell carcinoma | ||
| Skin | 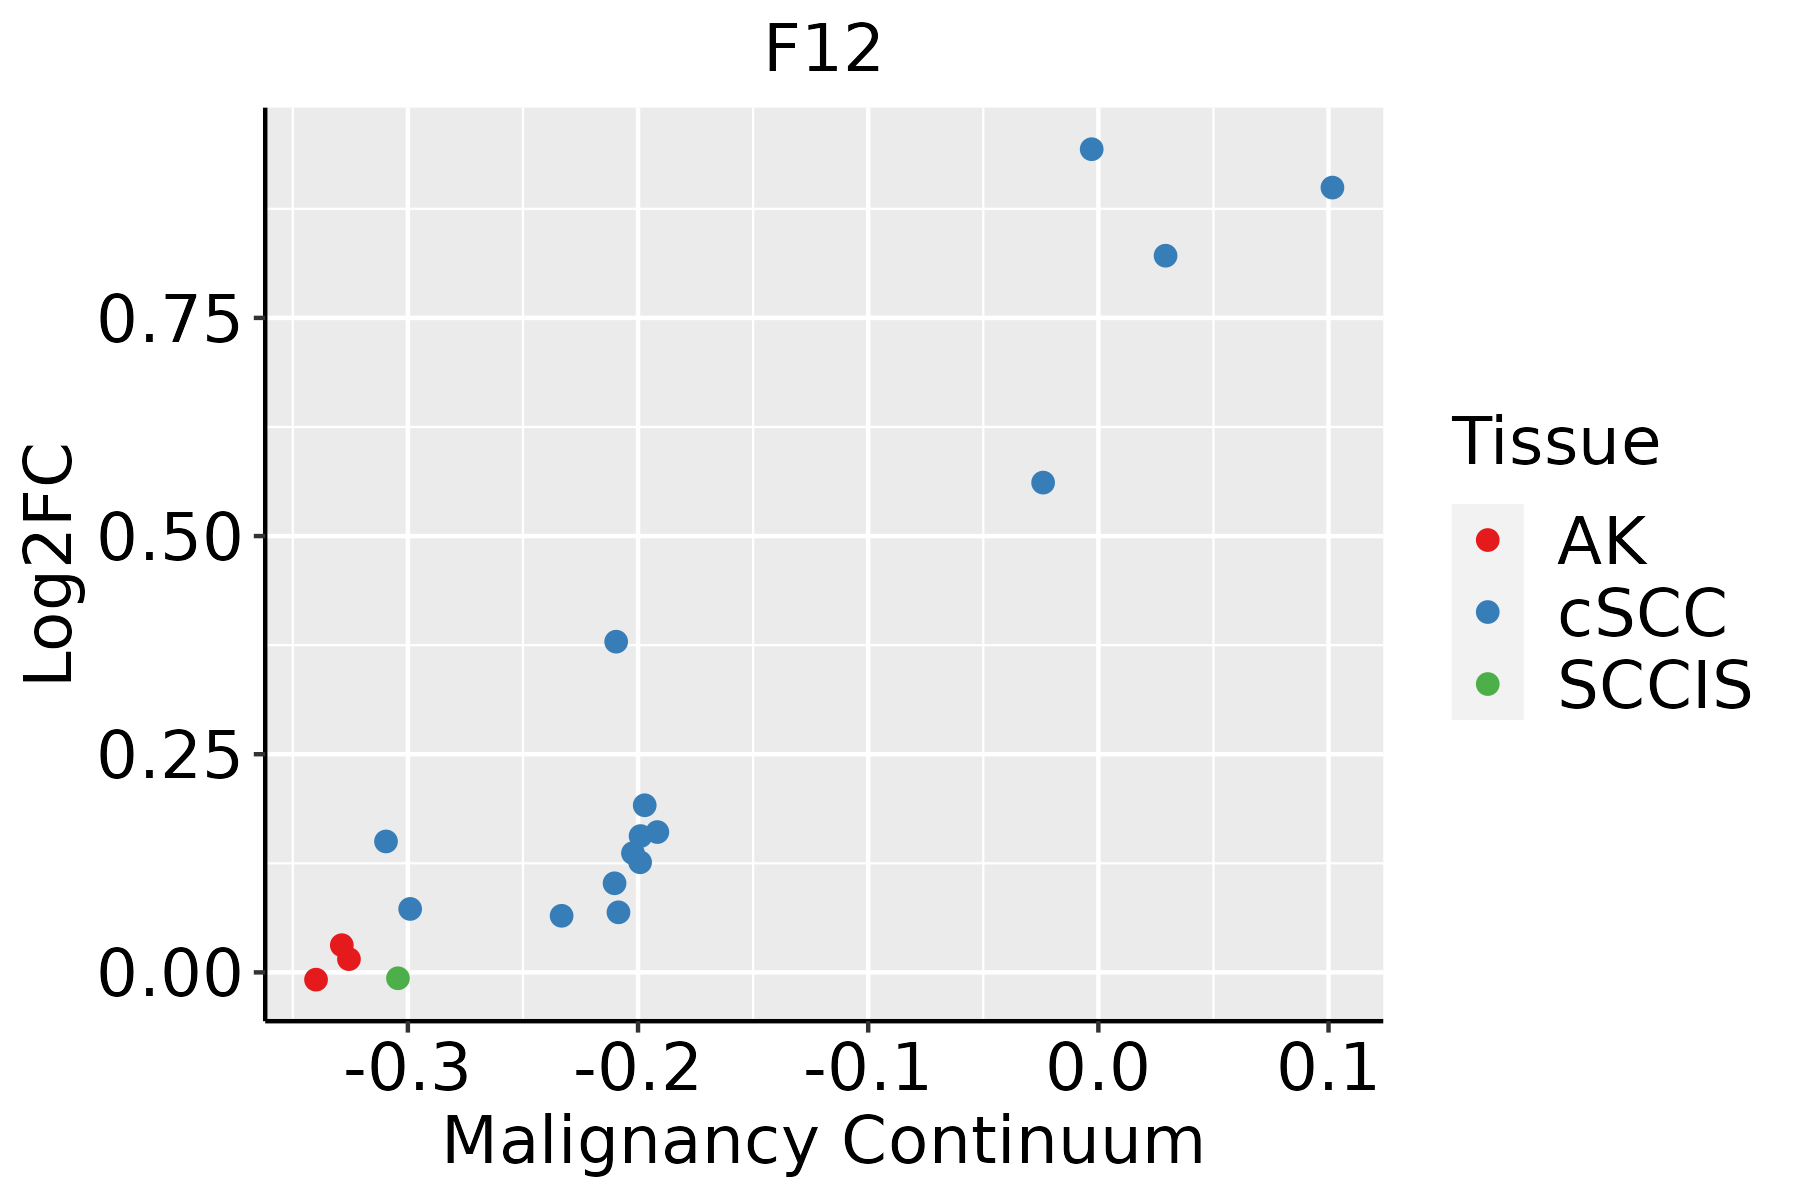 | AK: Actinic keratosis |
| cSCC: Cutaneous squamous cell carcinoma | ||
| SCCIS:squamous cell carcinoma in situ |
| ∗log2FC in expression of this searched gene in stem-like cells from each diseased tissue sample relative to stem-like cells in normal samples in each tissue plotted against the malignancy continuum. Samples are colored based on if they are from different disease stage. |
Top |
Malignant transformation related pathway analysis |
| Find out the enriched GO biological processes and KEGG pathways involved in transition from healthy to precancer to cancer |
| Tissue | Disease Stage | Enriched GO biological Processes |
| Colorectum | AD |  |
| Colorectum | SER |  |
| Colorectum | MSS |  |
| Colorectum | MSI-H |  |
| Colorectum | FAP |  |
| ∗Top 15 enriched GO BP terms are showed in the bar plot of each disease state in each tissue. Each row represents a significant GO biological process which is colored according to the -log10(p.adjust). |
| Page: 1 2 3 4 5 6 7 8 9 |
| GO ID | Tissue | Disease Stage | Description | Gene Ratio | Bg Ratio | pvalue | p.adjust | Count |
| GO:20012339 | Breast | Precancer | regulation of apoptotic signaling pathway | 65/1080 | 356/18723 | 7.70e-17 | 3.17e-14 | 65 |
| GO:20012356 | Breast | Precancer | positive regulation of apoptotic signaling pathway | 24/1080 | 126/18723 | 1.98e-07 | 1.01e-05 | 24 |
| GO:00420609 | Breast | Precancer | wound healing | 48/1080 | 422/18723 | 5.48e-06 | 1.63e-04 | 48 |
| GO:20012369 | Breast | Precancer | regulation of extrinsic apoptotic signaling pathway | 24/1080 | 151/18723 | 5.78e-06 | 1.70e-04 | 24 |
| GO:00971919 | Breast | Precancer | extrinsic apoptotic signaling pathway | 30/1080 | 219/18723 | 9.42e-06 | 2.50e-04 | 30 |
| GO:19030348 | Breast | Precancer | regulation of response to wounding | 19/1080 | 167/18723 | 3.60e-03 | 2.98e-02 | 19 |
| GO:200123314 | Breast | IDC | regulation of apoptotic signaling pathway | 82/1434 | 356/18723 | 6.27e-20 | 5.93e-17 | 82 |
| GO:200123514 | Breast | IDC | positive regulation of apoptotic signaling pathway | 31/1434 | 126/18723 | 4.13e-09 | 3.35e-07 | 31 |
| GO:009719114 | Breast | IDC | extrinsic apoptotic signaling pathway | 42/1434 | 219/18723 | 2.56e-08 | 1.73e-06 | 42 |
| GO:200123614 | Breast | IDC | regulation of extrinsic apoptotic signaling pathway | 32/1434 | 151/18723 | 1.07e-07 | 6.26e-06 | 32 |
| GO:004206014 | Breast | IDC | wound healing | 55/1434 | 422/18723 | 7.27e-05 | 1.45e-03 | 55 |
| GO:20012385 | Breast | IDC | positive regulation of extrinsic apoptotic signaling pathway | 12/1434 | 48/18723 | 2.03e-04 | 3.32e-03 | 12 |
| GO:190303413 | Breast | IDC | regulation of response to wounding | 24/1434 | 167/18723 | 2.07e-03 | 1.95e-02 | 24 |
| GO:200123324 | Breast | DCIS | regulation of apoptotic signaling pathway | 81/1390 | 356/18723 | 3.51e-20 | 3.31e-17 | 81 |
| GO:200123523 | Breast | DCIS | positive regulation of apoptotic signaling pathway | 31/1390 | 126/18723 | 1.96e-09 | 1.76e-07 | 31 |
| GO:009719123 | Breast | DCIS | extrinsic apoptotic signaling pathway | 40/1390 | 219/18723 | 9.43e-08 | 5.28e-06 | 40 |
| GO:200123623 | Breast | DCIS | regulation of extrinsic apoptotic signaling pathway | 31/1390 | 151/18723 | 1.79e-07 | 9.04e-06 | 31 |
| GO:004206024 | Breast | DCIS | wound healing | 54/1390 | 422/18723 | 6.09e-05 | 1.22e-03 | 54 |
| GO:200123812 | Breast | DCIS | positive regulation of extrinsic apoptotic signaling pathway | 12/1390 | 48/18723 | 1.51e-04 | 2.55e-03 | 12 |
| GO:190303422 | Breast | DCIS | regulation of response to wounding | 24/1390 | 167/18723 | 1.37e-03 | 1.42e-02 | 24 |
| Page: 1 2 3 4 5 6 7 8 9 10 11 12 13 14 15 16 17 18 19 20 21 22 23 24 25 26 27 28 29 30 31 32 33 34 35 36 37 38 39 40 41 42 |
| Pathway ID | Tissue | Disease Stage | Description | Gene Ratio | Bg Ratio | pvalue | p.adjust | qvalue | Count |
| hsa04610 | Liver | NAFLD | Complement and coagulation cascades | 35/1043 | 86/8465 | 2.48e-11 | 2.04e-09 | 1.64e-09 | 35 |
| hsa046101 | Liver | NAFLD | Complement and coagulation cascades | 35/1043 | 86/8465 | 2.48e-11 | 2.04e-09 | 1.64e-09 | 35 |
| hsa046102 | Liver | Cirrhotic | Complement and coagulation cascades | 48/2530 | 86/8465 | 4.41e-07 | 5.44e-06 | 3.35e-06 | 48 |
| hsa046103 | Liver | Cirrhotic | Complement and coagulation cascades | 48/2530 | 86/8465 | 4.41e-07 | 5.44e-06 | 3.35e-06 | 48 |
| hsa046104 | Liver | HCC | Complement and coagulation cascades | 57/4020 | 86/8465 | 3.19e-04 | 1.45e-03 | 8.04e-04 | 57 |
| hsa046105 | Liver | HCC | Complement and coagulation cascades | 57/4020 | 86/8465 | 3.19e-04 | 1.45e-03 | 8.04e-04 | 57 |
| Page: 1 |
Top |
Cell-cell communication analysis |
| Identification of potential cell-cell interactions between two cell types and their ligand-receptor pairs for different disease states |
| Ligand | Receptor | LRpair | Pathway | Tissue | Disease Stage |
| TNFSF12 | TNFRSF12A | TNFSF12_TNFRSF12A | TWEAK | Breast | DCIS |
| TNFSF12 | TNFRSF12A | TNFSF12_TNFRSF12A | TWEAK | Breast | Healthy |
| TNFSF12 | TNFRSF12A | TNFSF12_TNFRSF12A | TWEAK | Cervix | ADJ |
| TNFSF12 | TNFRSF12A | TNFSF12_TNFRSF12A | TWEAK | Cervix | Healthy |
| TNFSF12 | TNFRSF12A | TNFSF12_TNFRSF12A | TWEAK | Cervix | Precancer |
| TNFSF12 | TNFRSF12A | TNFSF12_TNFRSF12A | TWEAK | Endometrium | AEH |
| TNFSF12 | TNFRSF12A | TNFSF12_TNFRSF12A | TWEAK | Endometrium | EEC |
| TNFSF12 | TNFRSF12A | TNFSF12_TNFRSF12A | TWEAK | Endometrium | Healthy |
| TNFSF12 | TNFRSF12A | TNFSF12_TNFRSF12A | TWEAK | Esophagus | ESCC |
| TNFSF12 | TNFRSF12A | TNFSF12_TNFRSF12A | TWEAK | HNSCC | ADJ |
| TNFSF12 | TNFRSF12A | TNFSF12_TNFRSF12A | TWEAK | HNSCC | Healthy |
| TNFSF12 | TNFRSF12A | TNFSF12_TNFRSF12A | TWEAK | HNSCC | OSCC |
| TNFSF12 | TNFRSF12A | TNFSF12_TNFRSF12A | TWEAK | HNSCC | Precancer |
| TNFSF12 | TNFRSF12A | TNFSF12_TNFRSF12A | TWEAK | Liver | Healthy |
| TNFSF12 | TNFRSF12A | TNFSF12_TNFRSF12A | TWEAK | Lung | AAH |
| TNFSF12 | TNFRSF12A | TNFSF12_TNFRSF12A | TWEAK | Lung | IAC |
| TNFSF12 | TNFRSF12A | TNFSF12_TNFRSF12A | TWEAK | Lung | MIAC |
| TNFSF12 | TNFRSF12A | TNFSF12_TNFRSF12A | TWEAK | Lung | Precancer |
| TNFSF12 | TNFRSF12A | TNFSF12_TNFRSF12A | TWEAK | Prostate | BPH |
| TNFSF12 | TNFRSF12A | TNFSF12_TNFRSF12A | TWEAK | Prostate | Healthy |
| Page: 1 |
Top |
Single-cell gene regulatory network inference analysis |
| Find out the significant the regulons (TFs) and the target genes of each regulon across cell types for different disease states |
| TF | Cell Type | Tissue | Disease Stage | Target Gene | RSS | Regulon Activity |
| ∗The dot plots of a searched regulon are shown for all cell subpopulations in each disease state of each tissue based on the regulon specific score inferred using pySCENIC and by calculating the average expression. |
| Page: 1 |
Top |
Somatic mutation of malignant transformation related genes |
| Annotation of somatic variants for genes involved in malignant transformation |
| Hugo Symbol | Variant Class | Variant Classification | dbSNP RS | HGVSc | HGVSp | HGVSp Short | SWISSPROT | BIOTYPE | SIFT | PolyPhen | Tumor Sample Barcode | Tissue | Histology | Sex | Age | Stage | Therapy Types | Drugs | Outcome |
| F12 | SNV | Missense_Mutation | c.1669N>T | p.Asp557Tyr | p.D557Y | P00748 | protein_coding | deleterious(0) | probably_damaging(1) | TCGA-EW-A1PB-01 | Breast | breast invasive carcinoma | Female | >=65 | III/IV | Unknown | Unknown | SD | |
| F12 | insertion | In_Frame_Ins | novel | c.277_278insGCATTGACTGTGGCGTGGACCCTAAGGGCTGGGTGC | p.Lys93delinsSerIleAspCysGlyValAspProLysGlyTrpValGln | p.K93delinsSIDCGVDPKGWVQ | P00748 | protein_coding | TCGA-A2-A04Y-01 | Breast | breast invasive carcinoma | Female | <65 | I/II | Chemotherapy | cytoxan | SD | ||
| F12 | insertion | Frame_Shift_Ins | novel | c.1555_1556insG | p.Leu519ArgfsTer44 | p.L519Rfs*44 | P00748 | protein_coding | TCGA-A8-A06Q-01 | Breast | breast invasive carcinoma | Female | <65 | III/IV | Unknown | Unknown | SD | ||
| F12 | insertion | Nonsense_Mutation | novel | c.1554_1555insTCCACAGCTCTCAGAGAACAAGGTCTATGAGATCTTAA | p.Leu519SerfsTer10 | p.L519Sfs*10 | P00748 | protein_coding | TCGA-A8-A06Q-01 | Breast | breast invasive carcinoma | Female | <65 | III/IV | Unknown | Unknown | SD | ||
| F12 | insertion | In_Frame_Ins | novel | c.905_906insATTTATGGAAATCATACTTATCTTGTACTCTATCAGTGCAGTACATTT | p.Ala302_Pro303insPheMetGluIleIleLeuIleLeuTyrSerIleSerAlaValHisLeu | p.A302_P303insFMEIILILYSISAVHL | P00748 | protein_coding | TCGA-AN-A0FX-01 | Breast | breast invasive carcinoma | Female | <65 | I/II | Unknown | Unknown | SD | ||
| F12 | SNV | Missense_Mutation | c.573N>T | p.Glu191Asp | p.E191D | P00748 | protein_coding | tolerated(0.36) | benign(0.438) | TCGA-CK-6746-01 | Colorectum | colon adenocarcinoma | Female | >=65 | I/II | Unknown | Unknown | SD | |
| F12 | SNV | Missense_Mutation | novel | c.146T>C | p.Phe49Ser | p.F49S | P00748 | protein_coding | deleterious(0) | probably_damaging(0.999) | TCGA-DC-4749-01 | Colorectum | rectum adenocarcinoma | Male | <65 | I/II | Unknown | Unknown | SD |
| F12 | SNV | Missense_Mutation | novel | c.513N>T | p.Gln171His | p.Q171H | P00748 | protein_coding | deleterious(0.03) | benign(0.187) | TCGA-A5-A0G1-01 | Endometrium | uterine corpus endometrioid carcinoma | Female | >=65 | I/II | Unknown | Unknown | SD |
| F12 | SNV | Missense_Mutation | novel | c.373N>T | p.Leu125Phe | p.L125F | P00748 | protein_coding | tolerated(1) | benign(0.007) | TCGA-A5-A0G2-01 | Endometrium | uterine corpus endometrioid carcinoma | Female | <65 | III/IV | Unknown | Unknown | SD |
| F12 | SNV | Missense_Mutation | novel | c.513N>T | p.Gln171His | p.Q171H | P00748 | protein_coding | deleterious(0.03) | benign(0.187) | TCGA-A5-A0GG-01 | Endometrium | uterine corpus endometrioid carcinoma | Female | >=65 | I/II | Unknown | Unknown | SD |
| Page: 1 2 3 4 |
Top |
Related drugs of malignant transformation related genes |
| Identification of chemicals and drugs interact with genes involved in malignant transfromation |
| (DGIdb 4.0) |
| Entrez ID | Symbol | Category | Interaction Types | Drug Claim Name | Drug Name | PMIDs |
| 2161 | F12 | DRUGGABLE GENOME, ENZYME, PROTEASE | ANTITHROMBIN | |||
| 2161 | F12 | DRUGGABLE GENOME, ENZYME, PROTEASE | BORTEZOMIB | BORTEZOMIB | 20875739 | |
| 2161 | F12 | DRUGGABLE GENOME, ENZYME, PROTEASE | Enzymes | 23280790 | ||
| 2161 | F12 | DRUGGABLE GENOME, ENZYME, PROTEASE | inhibitor | 178103167 | ||
| 2161 | F12 | DRUGGABLE GENOME, ENZYME, PROTEASE | PENTAMIDINE ISETHIONATE | PENTAMIDINE ISETHIONATE |
| Page: 1 |

Copyright 2023-Present -The University of Texas Health Science Center at Houston |