
|
|||||
|
 | |
| |
| |
| |
| |
| |
|
Gene: F11R |
Gene summary for F11R |
| Gene information | Species | Human | Gene symbol | F11R | Gene ID | 50848 |
| Gene name | F11 receptor | |
| Gene Alias | CD321 | |
| Cytomap | 1q23.3 | |
| Gene Type | protein-coding | GO ID | GO:0000902 | UniProtAcc | Q9Y624 |
Top |
Malignant transformation analysis |
| Identification of the aberrant gene expression in precancerous and cancerous lesions by comparing the gene expression of stem-like cells in diseased tissues with normal stem cells |
| Entrez ID | Symbol | Replicates | Species | Organ | Tissue | Adj P-value | Log2FC | Malignancy |
| 50848 | F11R | CA_HPV_2 | Human | Cervix | CC | 1.25e-06 | 2.80e-01 | 0.0391 |
| 50848 | F11R | CCI_1 | Human | Cervix | CC | 4.54e-02 | 5.33e-01 | 0.528 |
| 50848 | F11R | Tumor | Human | Cervix | CC | 4.05e-24 | 5.09e-01 | 0.1241 |
| 50848 | F11R | sample1 | Human | Cervix | CC | 2.70e-04 | 4.11e-01 | 0.0959 |
| 50848 | F11R | sample3 | Human | Cervix | CC | 1.69e-58 | 7.73e-01 | 0.1387 |
| 50848 | F11R | H2 | Human | Cervix | HSIL_HPV | 5.46e-10 | 3.67e-01 | 0.0632 |
| 50848 | F11R | L1 | Human | Cervix | CC | 7.15e-10 | 4.98e-01 | 0.0802 |
| 50848 | F11R | T1 | Human | Cervix | CC | 5.61e-07 | 3.51e-01 | 0.0918 |
| 50848 | F11R | T2 | Human | Cervix | CC | 6.61e-03 | 4.22e-01 | 0.0709 |
| 50848 | F11R | T3 | Human | Cervix | CC | 8.29e-50 | 7.45e-01 | 0.1389 |
| 50848 | F11R | HTA11_2487_2000001011 | Human | Colorectum | SER | 1.17e-07 | 5.41e-01 | -0.1808 |
| 50848 | F11R | HTA11_1938_2000001011 | Human | Colorectum | AD | 1.55e-06 | 5.22e-01 | -0.0811 |
| 50848 | F11R | HTA11_78_2000001011 | Human | Colorectum | AD | 2.82e-05 | 3.47e-01 | -0.1088 |
| 50848 | F11R | HTA11_347_2000001011 | Human | Colorectum | AD | 1.26e-14 | 4.78e-01 | -0.1954 |
| 50848 | F11R | HTA11_411_2000001011 | Human | Colorectum | SER | 4.29e-04 | 9.02e-01 | -0.2602 |
| 50848 | F11R | HTA11_83_2000001011 | Human | Colorectum | SER | 3.86e-03 | 3.98e-01 | -0.1526 |
| 50848 | F11R | HTA11_696_2000001011 | Human | Colorectum | AD | 3.96e-04 | 2.67e-01 | -0.1464 |
| 50848 | F11R | HTA11_1391_2000001011 | Human | Colorectum | AD | 3.64e-11 | 5.58e-01 | -0.059 |
| 50848 | F11R | HTA11_5212_2000001011 | Human | Colorectum | AD | 5.83e-04 | 5.08e-01 | -0.2061 |
| 50848 | F11R | HTA11_866_3004761011 | Human | Colorectum | AD | 8.02e-06 | 3.51e-01 | 0.096 |
| Page: 1 2 3 4 5 6 7 8 9 |
| Tissue | Expression Dynamics | Abbreviation |
| Cervix | 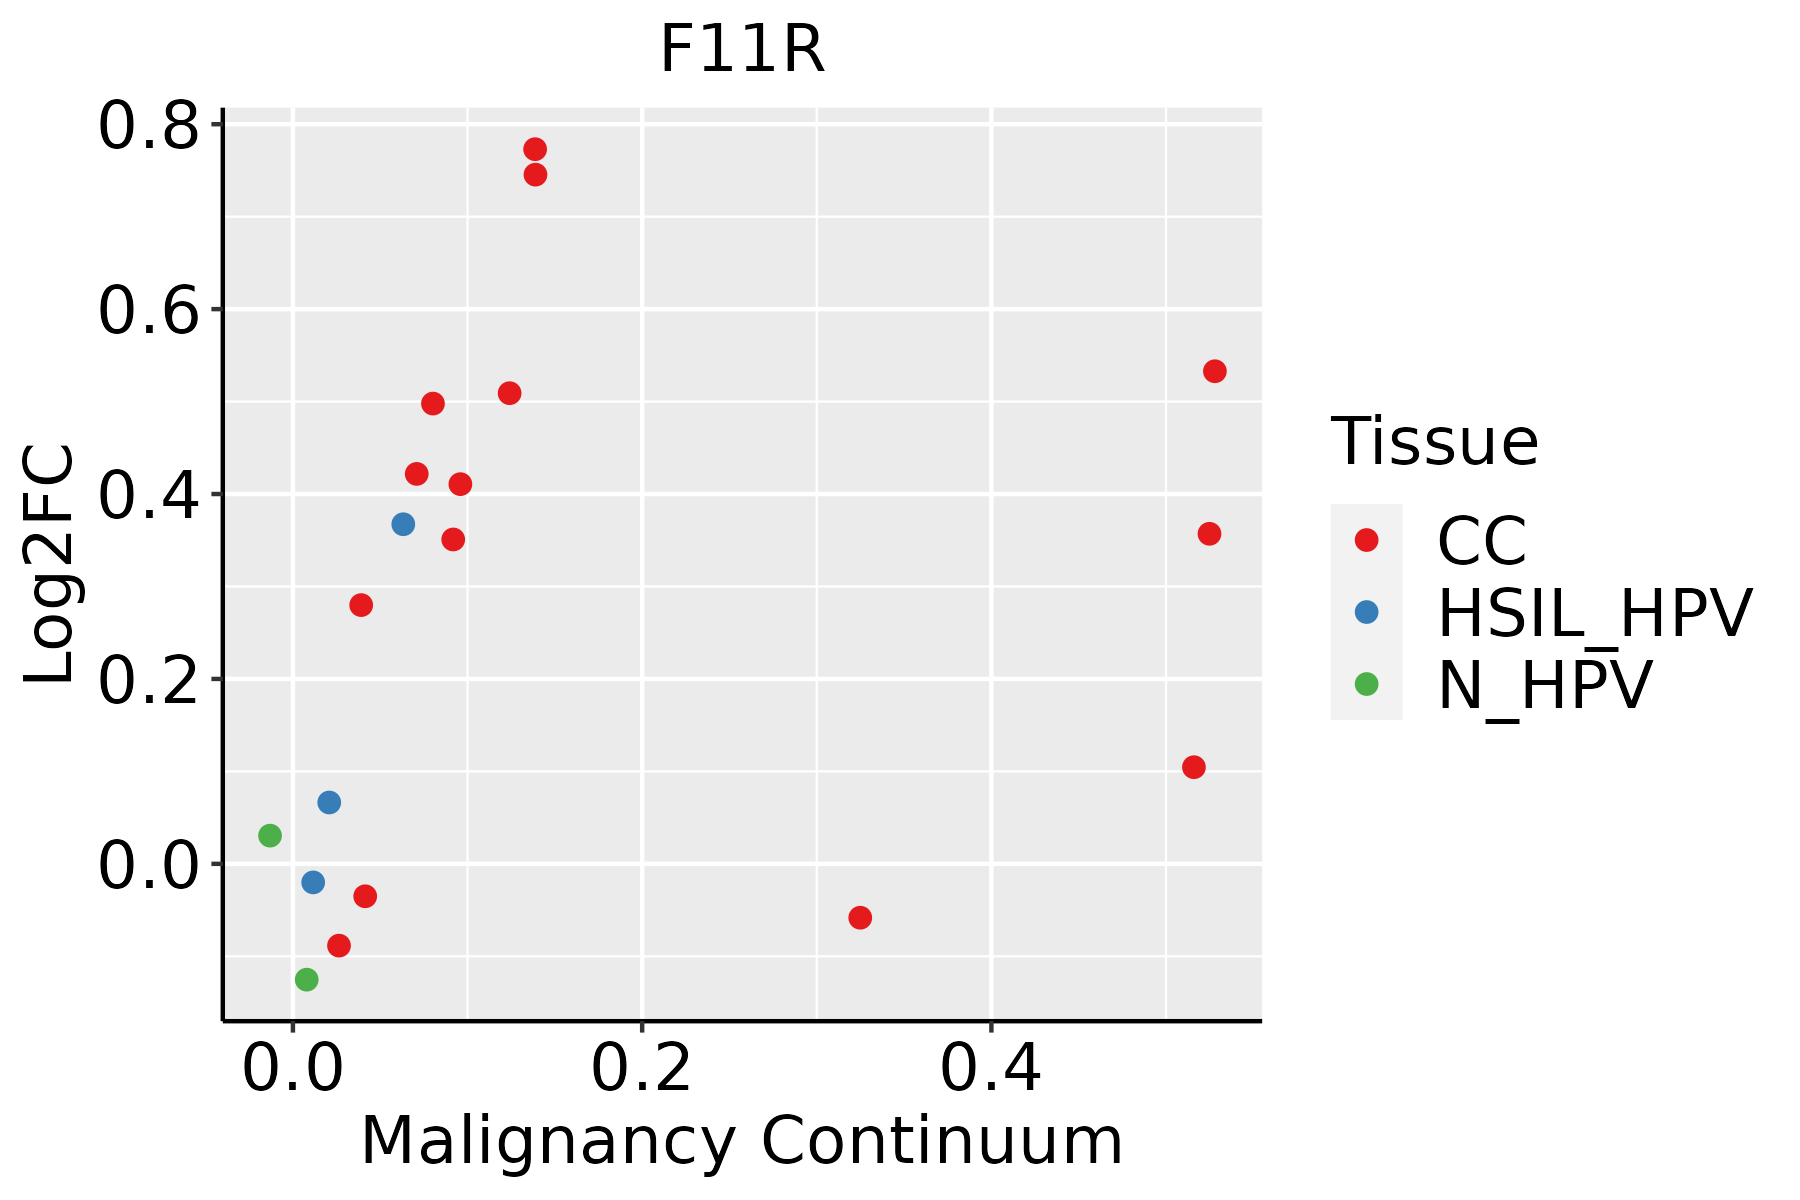 | CC: Cervix cancer |
| HSIL_HPV: HPV-infected high-grade squamous intraepithelial lesions | ||
| N_HPV: HPV-infected normal cervix | ||
| Colorectum (GSE201348) | 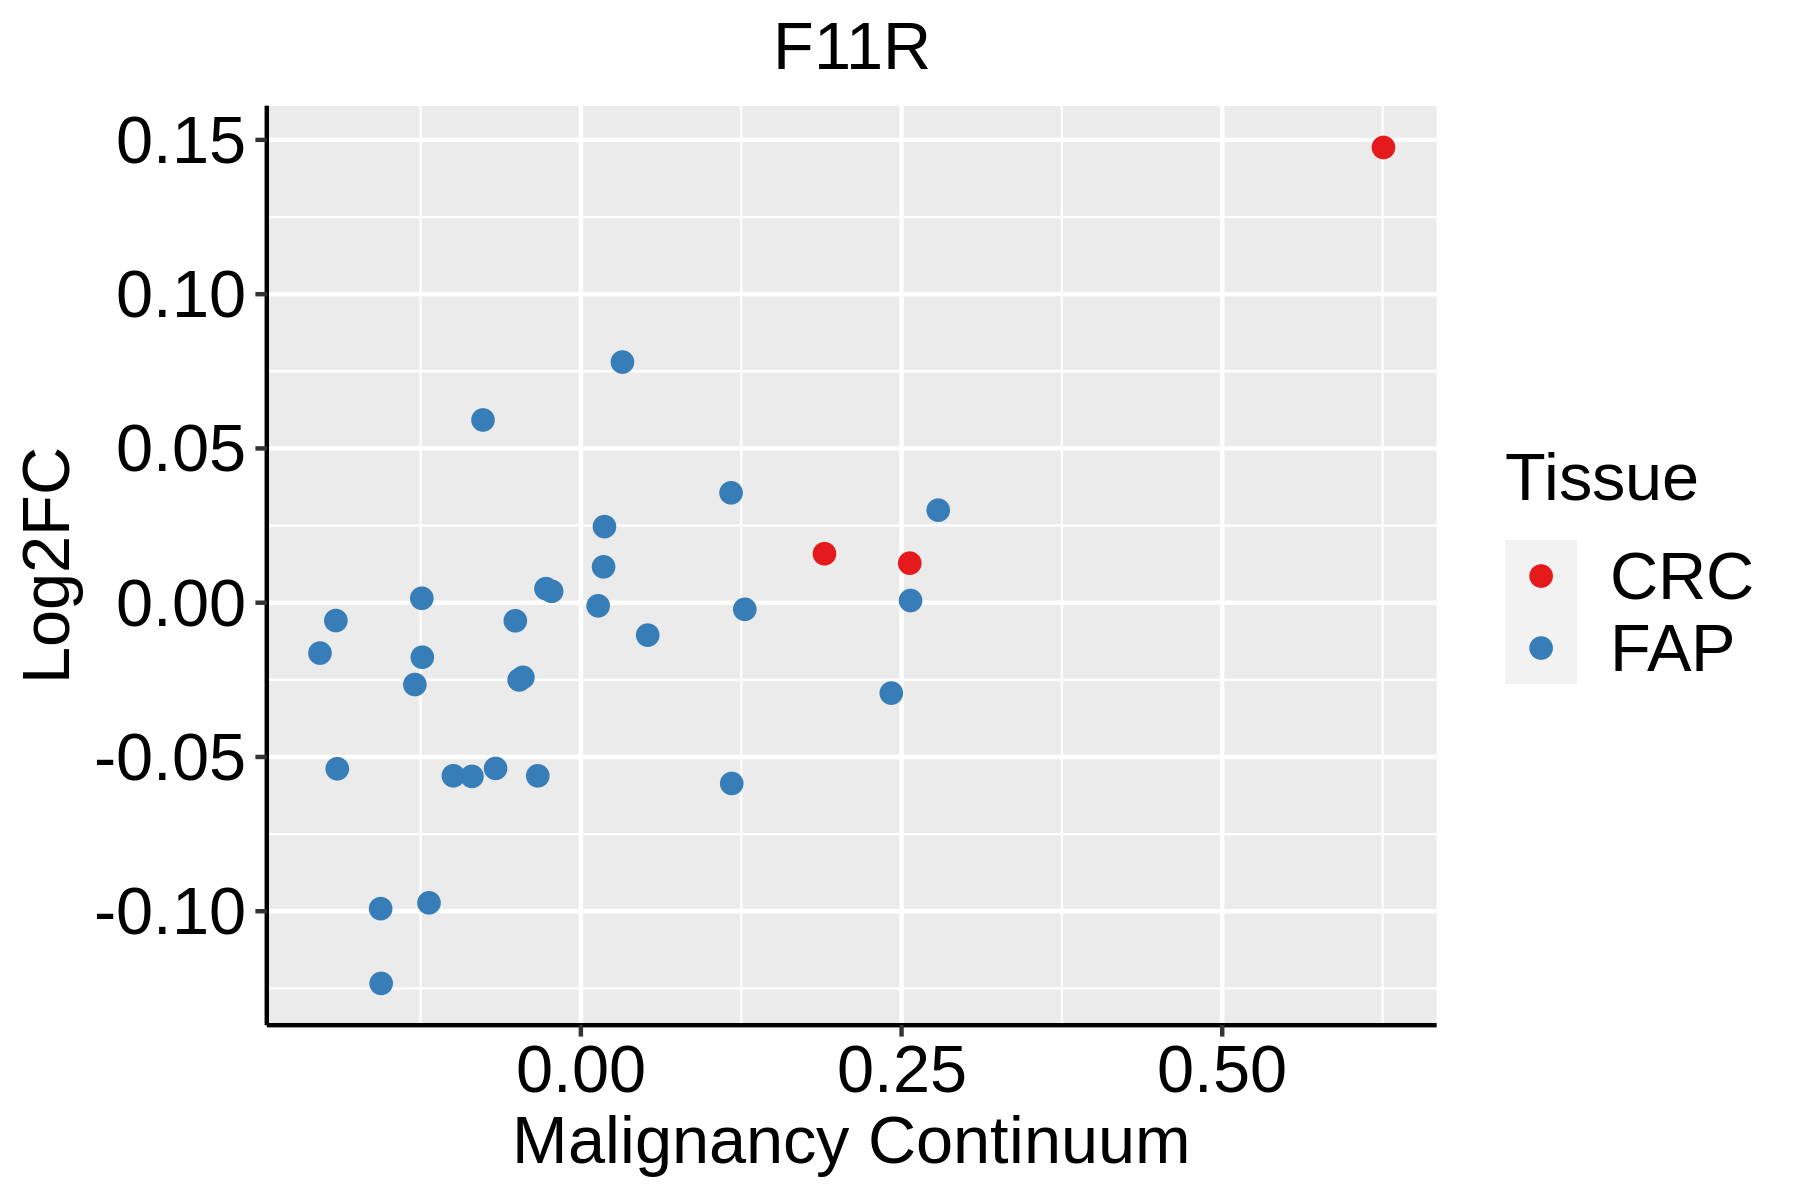 | FAP: Familial adenomatous polyposis |
| CRC: Colorectal cancer | ||
| Colorectum (HTA11) | 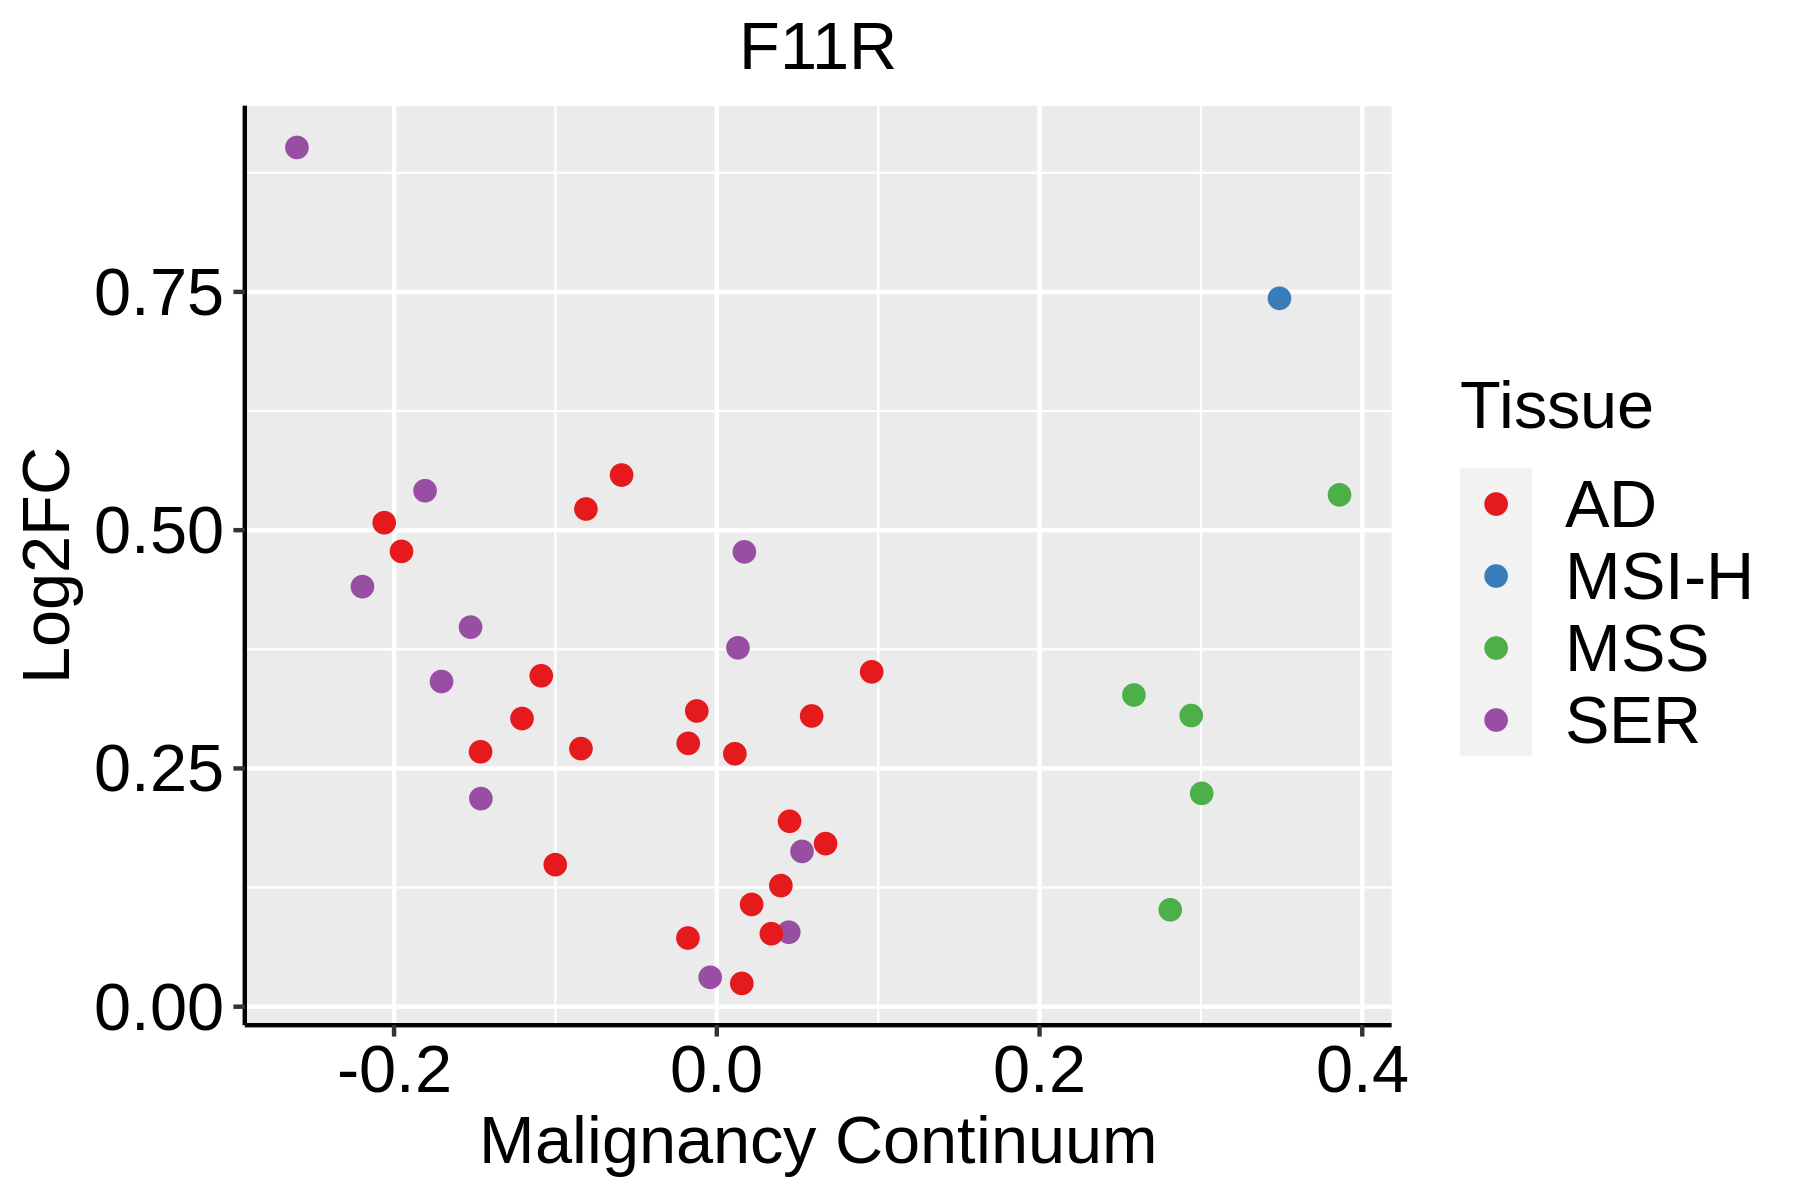 | AD: Adenomas |
| SER: Sessile serrated lesions | ||
| MSI-H: Microsatellite-high colorectal cancer | ||
| MSS: Microsatellite stable colorectal cancer | ||
| Esophagus |  | ESCC: Esophageal squamous cell carcinoma |
| HGIN: High-grade intraepithelial neoplasias | ||
| LGIN: Low-grade intraepithelial neoplasias | ||
| Liver |  | HCC: Hepatocellular carcinoma |
| NAFLD: Non-alcoholic fatty liver disease | ||
| Oral Cavity | 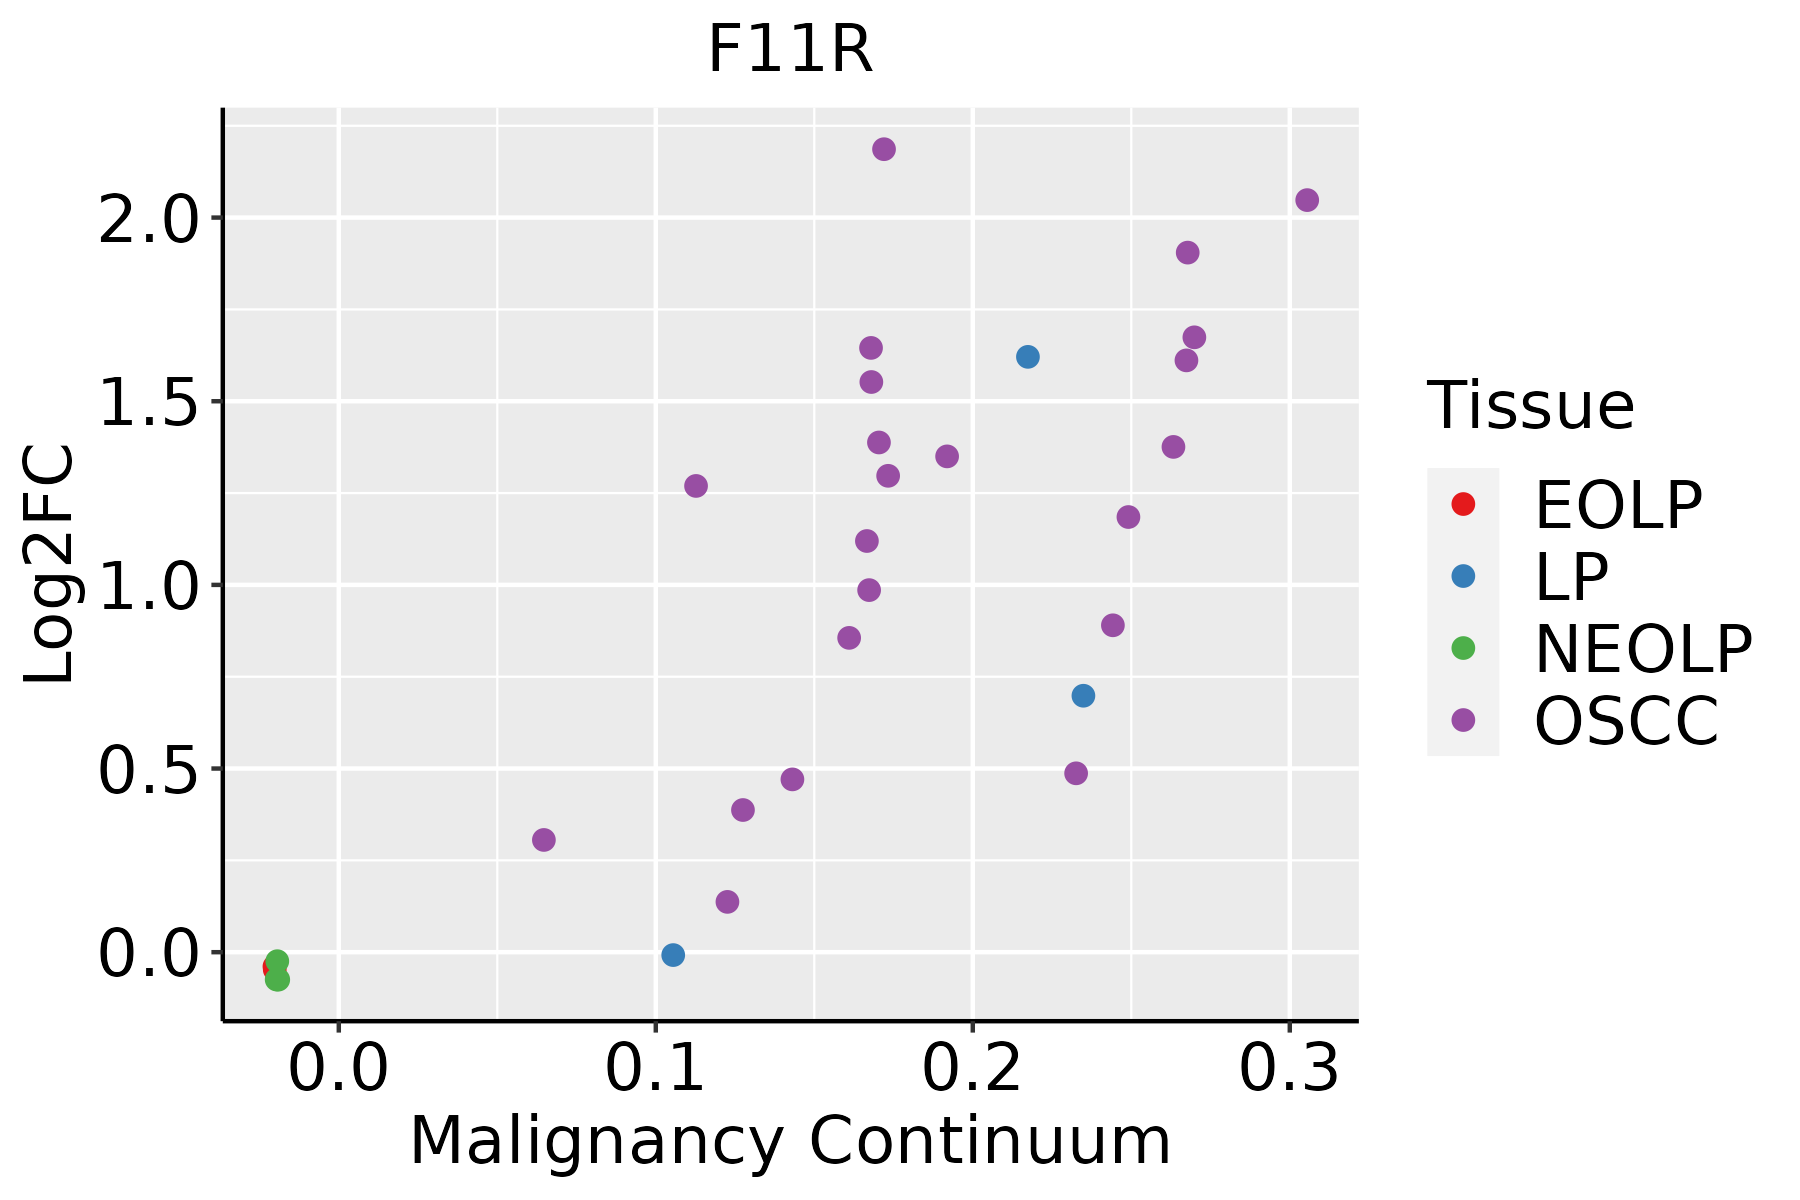 | EOLP: Erosive Oral lichen planus |
| LP: leukoplakia | ||
| NEOLP: Non-erosive oral lichen planus | ||
| OSCC: Oral squamous cell carcinoma | ||
| Prostate | 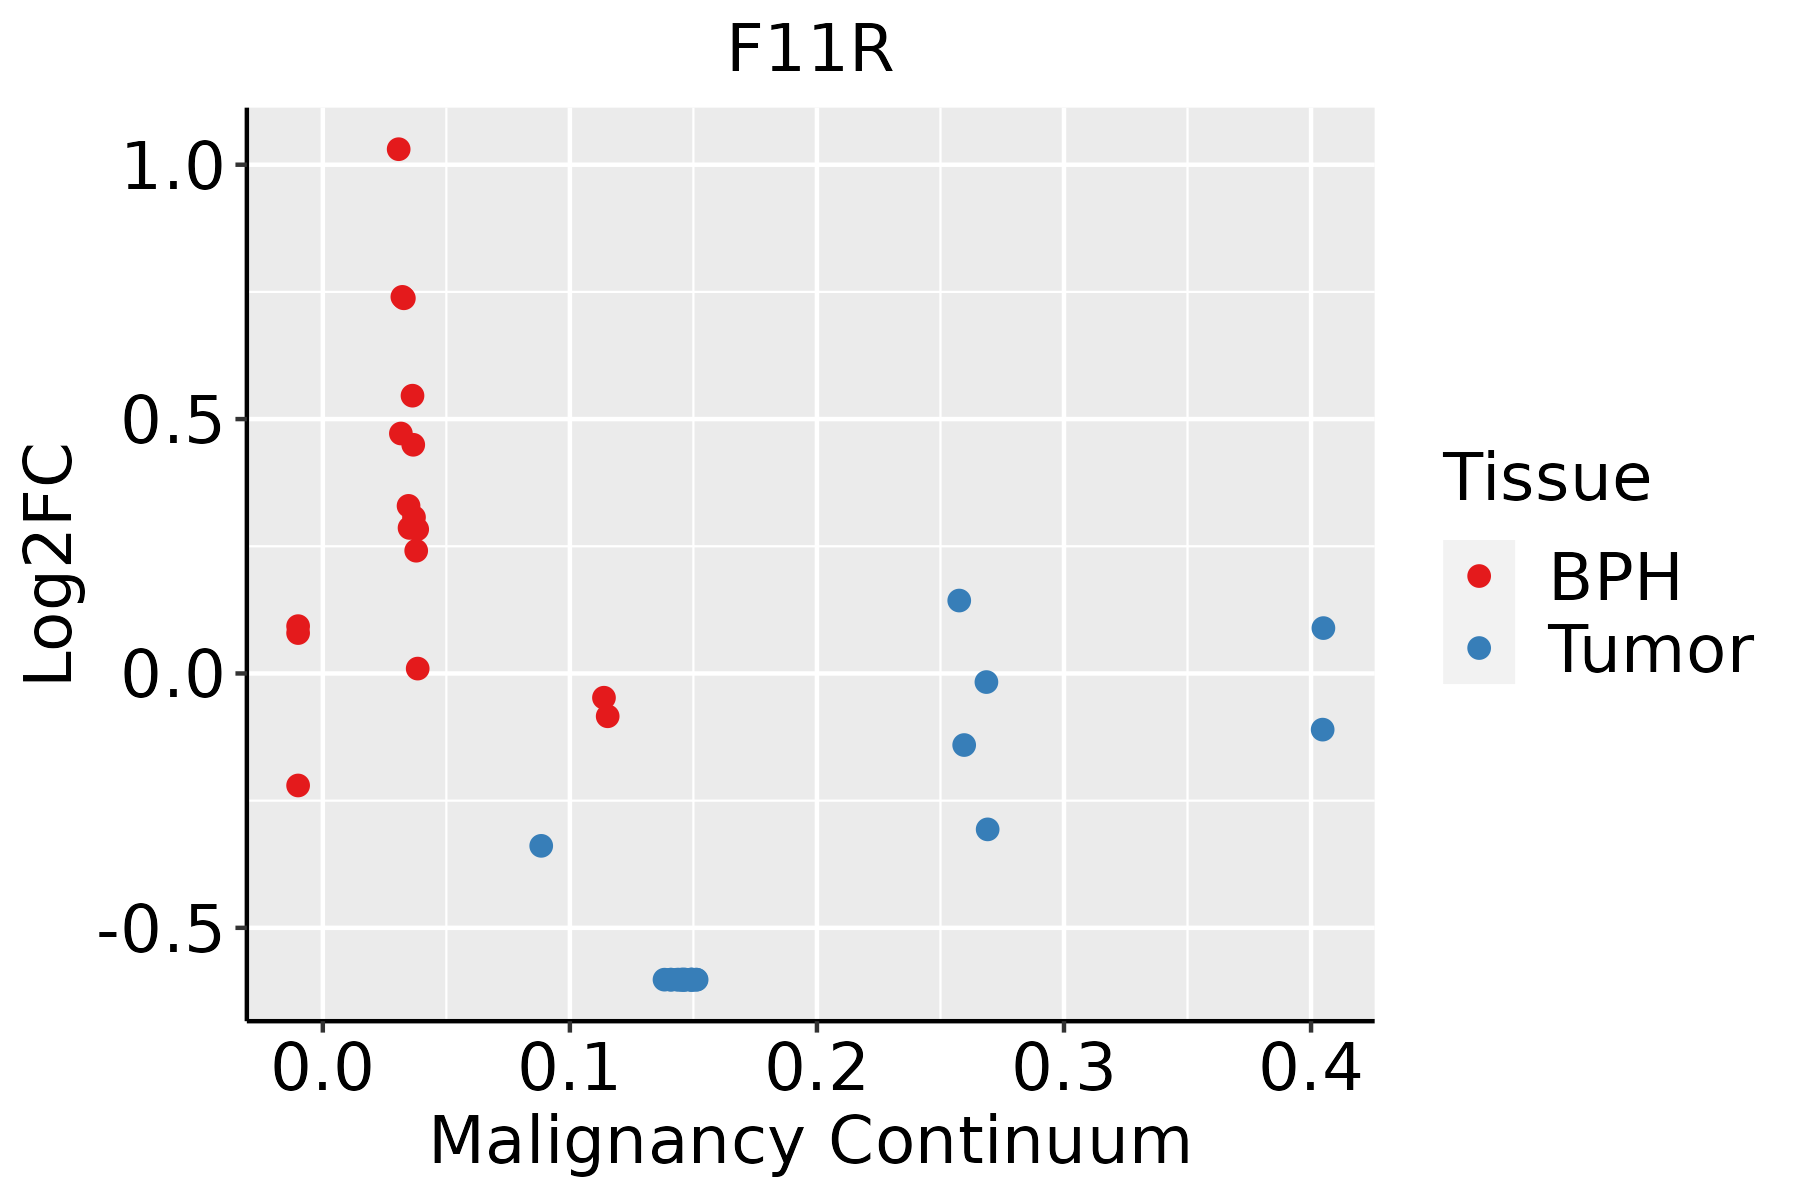 | BPH: Benign Prostatic Hyperplasia |
| Skin | 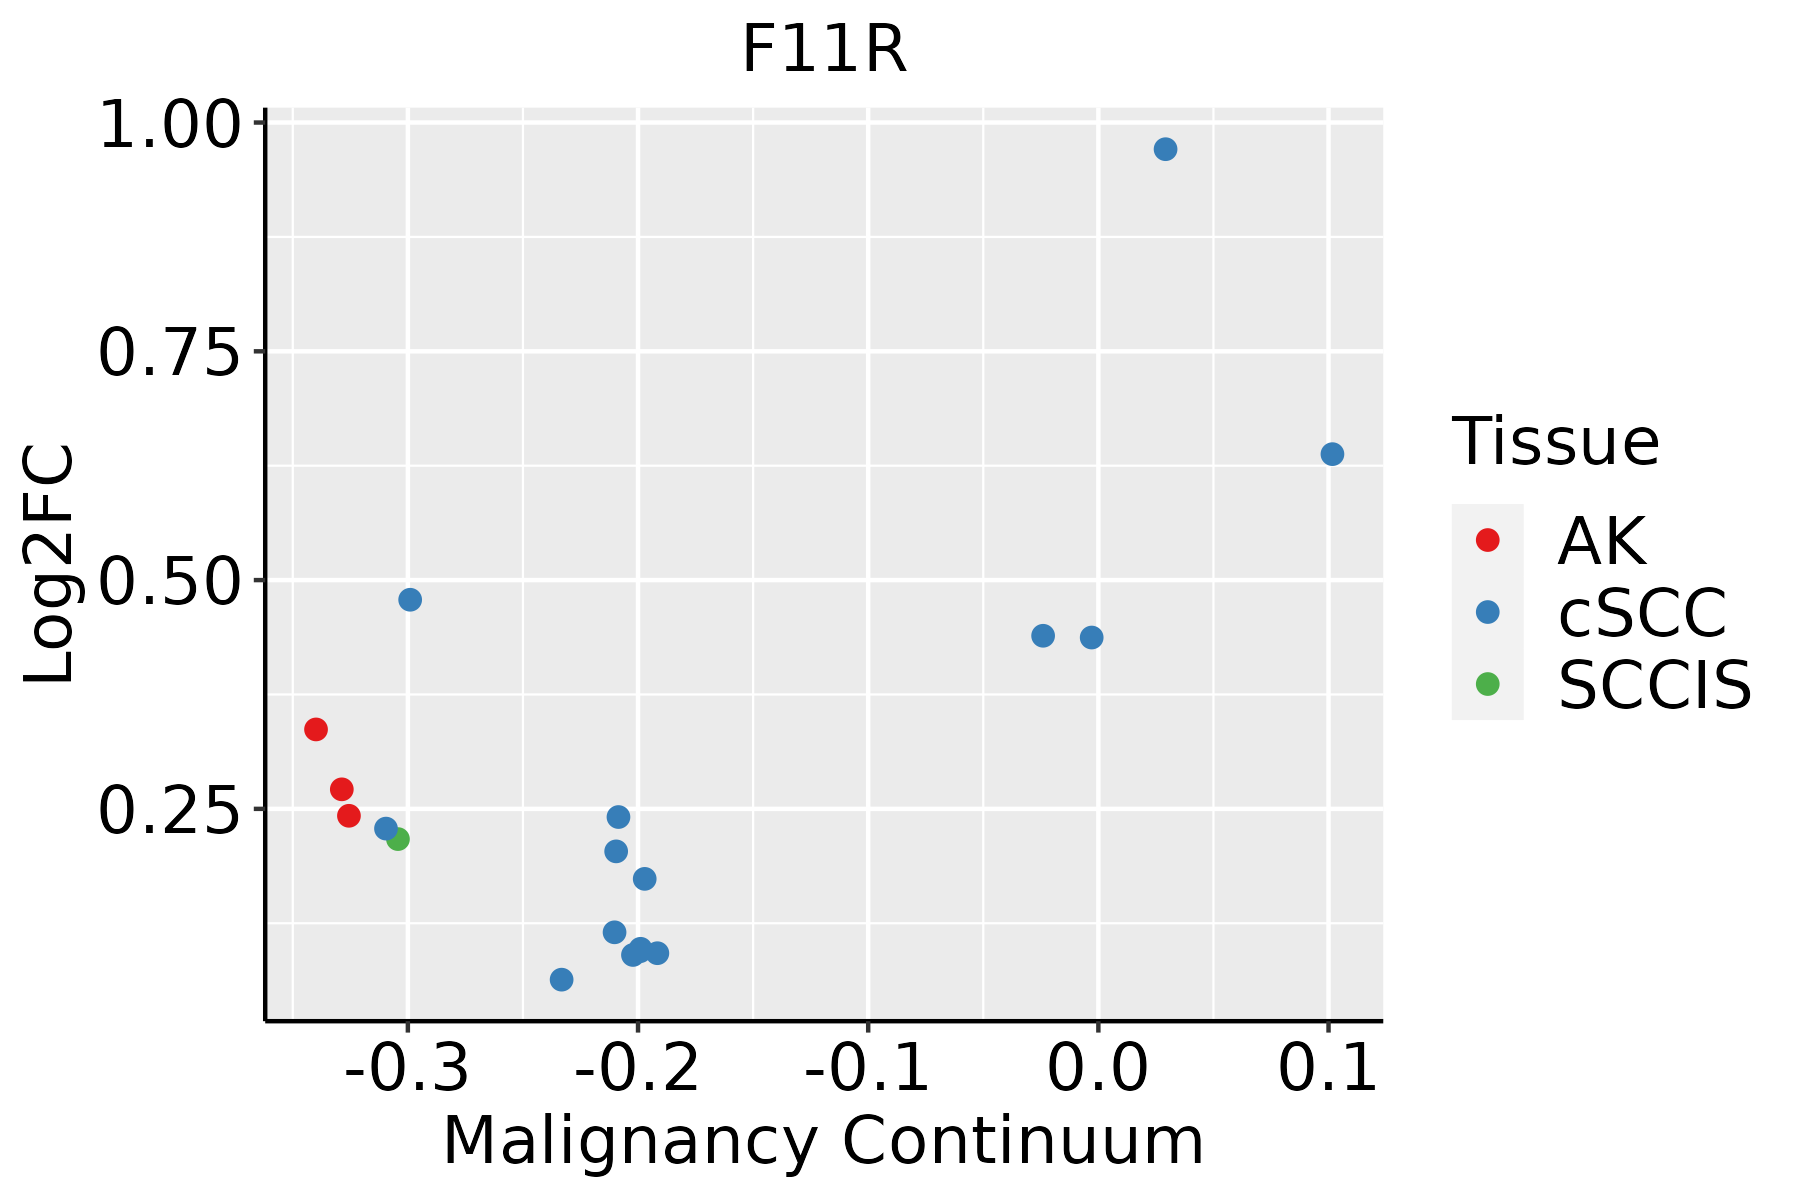 | AK: Actinic keratosis |
| cSCC: Cutaneous squamous cell carcinoma | ||
| SCCIS:squamous cell carcinoma in situ | ||
| Thyroid | 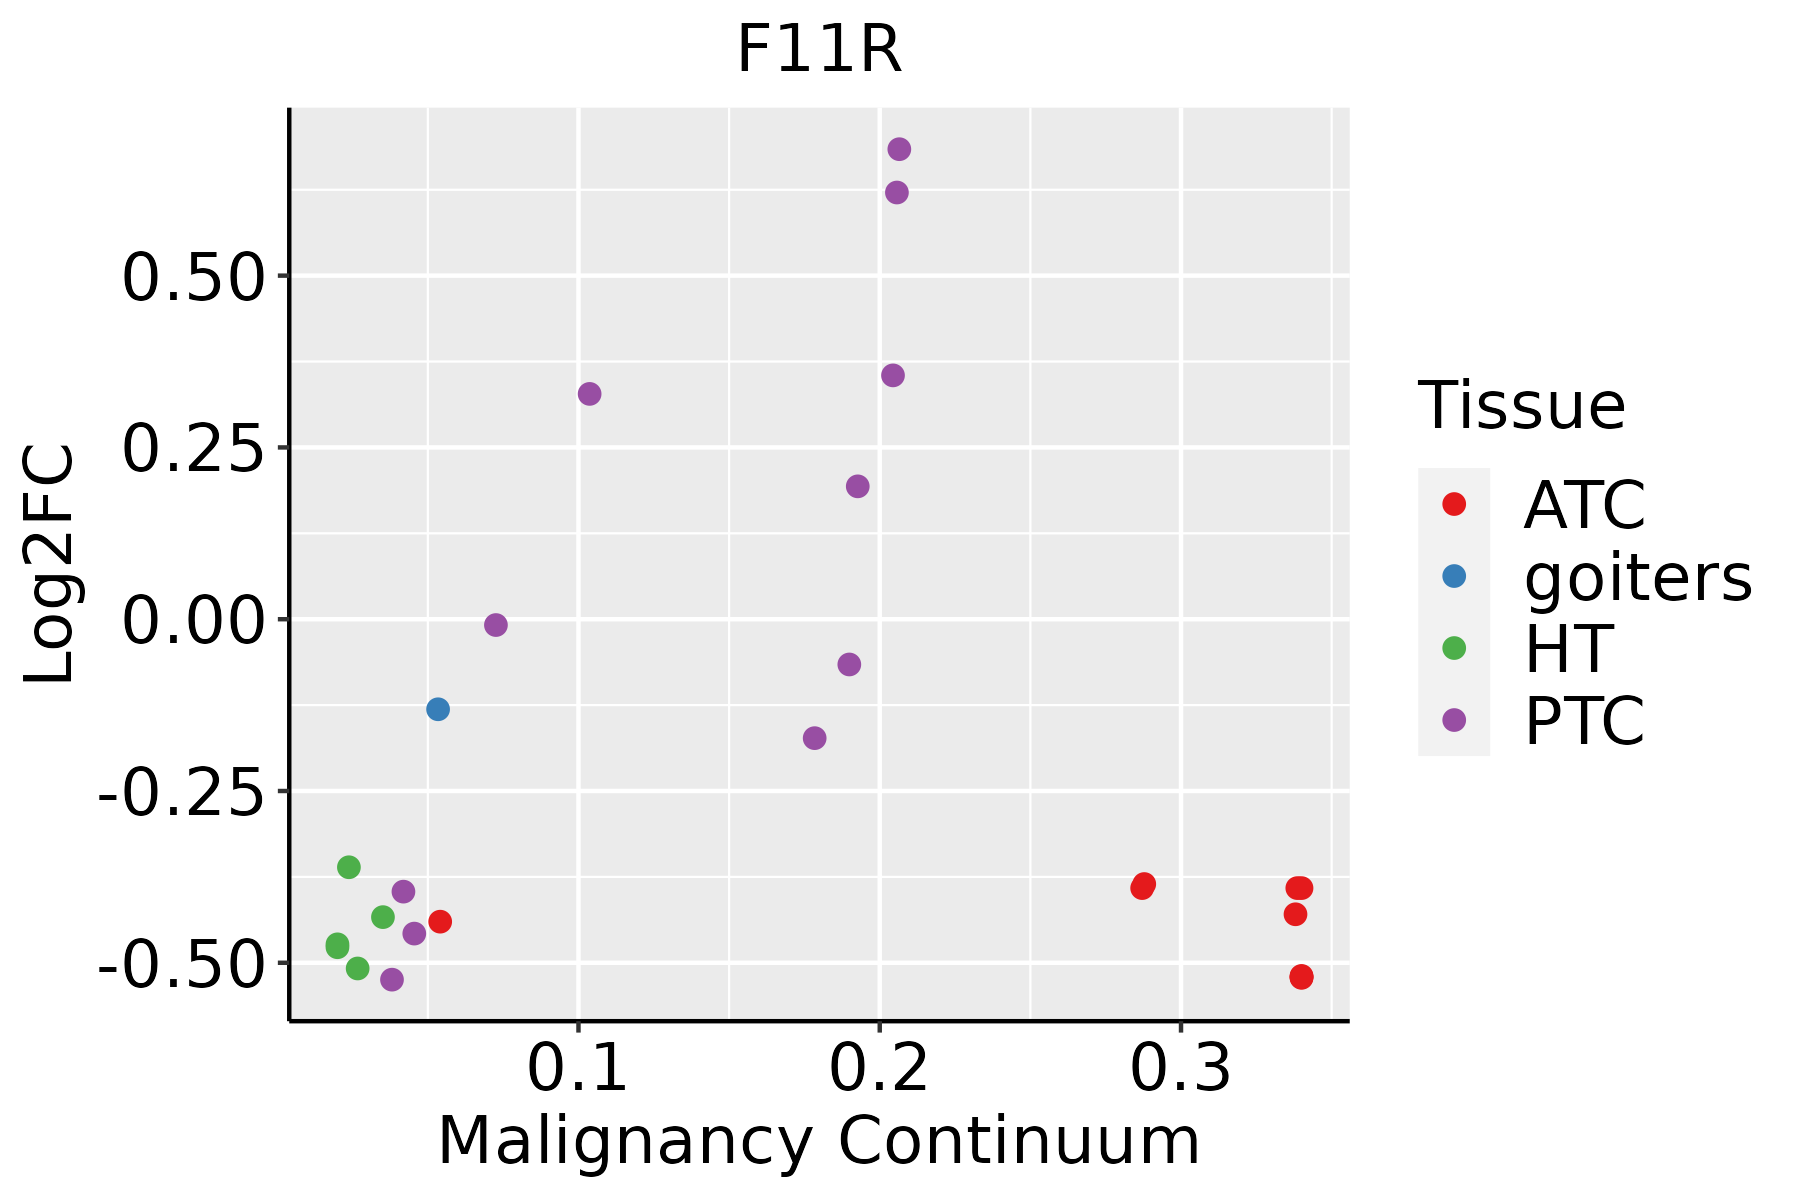 | ATC: Anaplastic thyroid cancer |
| HT: Hashimoto's thyroiditis | ||
| PTC: Papillary thyroid cancer |
| ∗log2FC in expression of this searched gene in stem-like cells from each diseased tissue sample relative to stem-like cells in normal samples in each tissue plotted against the malignancy continuum. Samples are colored based on if they are from different disease stage. |
Top |
Malignant transformation related pathway analysis |
| Find out the enriched GO biological processes and KEGG pathways involved in transition from healthy to precancer to cancer |
| Tissue | Disease Stage | Enriched GO biological Processes |
| Colorectum | AD |  |
| Colorectum | SER |  |
| Colorectum | MSS |  |
| Colorectum | MSI-H |  |
| Colorectum | FAP |  |
| ∗Top 15 enriched GO BP terms are showed in the bar plot of each disease state in each tissue. Each row represents a significant GO biological process which is colored according to the -log10(p.adjust). |
| Page: 1 2 3 4 5 6 7 8 9 |
| GO ID | Tissue | Disease Stage | Description | Gene Ratio | Bg Ratio | pvalue | p.adjust | Count |
| GO:001603210 | Cervix | CC | viral process | 109/2311 | 415/18723 | 5.40e-15 | 6.46e-12 | 109 |
| GO:004206010 | Cervix | CC | wound healing | 109/2311 | 422/18723 | 1.84e-14 | 1.57e-11 | 109 |
| GO:001905810 | Cervix | CC | viral life cycle | 87/2311 | 317/18723 | 2.20e-13 | 1.20e-10 | 87 |
| GO:000701510 | Cervix | CC | actin filament organization | 109/2311 | 442/18723 | 4.92e-13 | 2.45e-10 | 109 |
| GO:002260410 | Cervix | CC | regulation of cell morphogenesis | 84/2311 | 309/18723 | 1.00e-12 | 4.29e-10 | 84 |
| GO:003297010 | Cervix | CC | regulation of actin filament-based process | 96/2311 | 397/18723 | 4.00e-11 | 8.54e-09 | 96 |
| GO:190290310 | Cervix | CC | regulation of supramolecular fiber organization | 92/2311 | 383/18723 | 1.49e-10 | 2.48e-08 | 92 |
| GO:002240710 | Cervix | CC | regulation of cell-cell adhesion | 103/2311 | 448/18723 | 1.78e-10 | 2.87e-08 | 103 |
| GO:004578510 | Cervix | CC | positive regulation of cell adhesion | 101/2311 | 437/18723 | 1.96e-10 | 3.08e-08 | 101 |
| GO:007265910 | Cervix | CC | protein localization to plasma membrane | 73/2311 | 284/18723 | 4.95e-10 | 6.73e-08 | 73 |
| GO:003295610 | Cervix | CC | regulation of actin cytoskeleton organization | 86/2311 | 358/18723 | 5.90e-10 | 7.51e-08 | 86 |
| GO:005212610 | Cervix | CC | movement in host environment | 52/2311 | 175/18723 | 7.03e-10 | 8.76e-08 | 52 |
| GO:004440910 | Cervix | CC | entry into host | 47/2311 | 151/18723 | 8.45e-10 | 1.03e-07 | 47 |
| GO:005170110 | Cervix | CC | biological process involved in interaction with host | 57/2311 | 203/18723 | 1.18e-09 | 1.41e-07 | 57 |
| GO:00510566 | Cervix | CC | regulation of small GTPase mediated signal transduction | 75/2311 | 302/18723 | 1.54e-09 | 1.74e-07 | 75 |
| GO:007149610 | Cervix | CC | cellular response to external stimulus | 78/2311 | 320/18723 | 1.82e-09 | 1.98e-07 | 78 |
| GO:004671810 | Cervix | CC | viral entry into host cell | 44/2311 | 144/18723 | 5.47e-09 | 5.03e-07 | 44 |
| GO:004440310 | Cervix | CC | biological process involved in symbiotic interaction | 71/2311 | 290/18723 | 7.94e-09 | 6.98e-07 | 71 |
| GO:00071598 | Cervix | CC | leukocyte cell-cell adhesion | 85/2311 | 371/18723 | 8.27e-09 | 7.07e-07 | 85 |
| GO:00072656 | Cervix | CC | Ras protein signal transduction | 79/2311 | 337/18723 | 9.49e-09 | 7.77e-07 | 79 |
| Page: 1 2 3 4 5 6 7 8 9 10 11 12 13 14 15 16 17 18 19 20 21 22 23 24 25 26 27 28 29 30 31 32 33 34 35 36 37 38 39 40 41 42 43 44 45 46 47 48 49 50 51 52 53 |
| Pathway ID | Tissue | Disease Stage | Description | Gene Ratio | Bg Ratio | pvalue | p.adjust | qvalue | Count |
| hsa0453020 | Cervix | CC | Tight junction | 49/1267 | 169/8465 | 1.87e-06 | 1.78e-05 | 1.05e-05 | 49 |
| hsa0467020 | Cervix | CC | Leukocyte transendothelial migration | 36/1267 | 114/8465 | 5.22e-06 | 4.83e-05 | 2.86e-05 | 36 |
| hsa051207 | Cervix | CC | Epithelial cell signaling in Helicobacter pylori infection | 24/1267 | 70/8465 | 4.35e-05 | 3.09e-04 | 1.83e-04 | 24 |
| hsa045147 | Cervix | CC | Cell adhesion molecules | 36/1267 | 157/8465 | 4.94e-03 | 1.67e-02 | 9.86e-03 | 36 |
| hsa04530110 | Cervix | CC | Tight junction | 49/1267 | 169/8465 | 1.87e-06 | 1.78e-05 | 1.05e-05 | 49 |
| hsa04670110 | Cervix | CC | Leukocyte transendothelial migration | 36/1267 | 114/8465 | 5.22e-06 | 4.83e-05 | 2.86e-05 | 36 |
| hsa0512014 | Cervix | CC | Epithelial cell signaling in Helicobacter pylori infection | 24/1267 | 70/8465 | 4.35e-05 | 3.09e-04 | 1.83e-04 | 24 |
| hsa0451412 | Cervix | CC | Cell adhesion molecules | 36/1267 | 157/8465 | 4.94e-03 | 1.67e-02 | 9.86e-03 | 36 |
| hsa0451421 | Cervix | HSIL_HPV | Cell adhesion molecules | 20/459 | 157/8465 | 3.03e-04 | 3.06e-03 | 2.47e-03 | 20 |
| hsa0467025 | Cervix | HSIL_HPV | Leukocyte transendothelial migration | 16/459 | 114/8465 | 4.04e-04 | 3.49e-03 | 2.82e-03 | 16 |
| hsa0451431 | Cervix | HSIL_HPV | Cell adhesion molecules | 20/459 | 157/8465 | 3.03e-04 | 3.06e-03 | 2.47e-03 | 20 |
| hsa0467035 | Cervix | HSIL_HPV | Leukocyte transendothelial migration | 16/459 | 114/8465 | 4.04e-04 | 3.49e-03 | 2.82e-03 | 16 |
| hsa04530 | Colorectum | AD | Tight junction | 76/2092 | 169/8465 | 5.49e-09 | 9.69e-08 | 6.18e-08 | 76 |
| hsa04670 | Colorectum | AD | Leukocyte transendothelial migration | 41/2092 | 114/8465 | 4.60e-03 | 2.20e-02 | 1.40e-02 | 41 |
| hsa045301 | Colorectum | AD | Tight junction | 76/2092 | 169/8465 | 5.49e-09 | 9.69e-08 | 6.18e-08 | 76 |
| hsa046701 | Colorectum | AD | Leukocyte transendothelial migration | 41/2092 | 114/8465 | 4.60e-03 | 2.20e-02 | 1.40e-02 | 41 |
| hsa045302 | Colorectum | SER | Tight junction | 59/1580 | 169/8465 | 3.24e-07 | 5.98e-06 | 4.34e-06 | 59 |
| hsa046702 | Colorectum | SER | Leukocyte transendothelial migration | 37/1580 | 114/8465 | 2.77e-04 | 2.56e-03 | 1.86e-03 | 37 |
| hsa045303 | Colorectum | SER | Tight junction | 59/1580 | 169/8465 | 3.24e-07 | 5.98e-06 | 4.34e-06 | 59 |
| hsa046703 | Colorectum | SER | Leukocyte transendothelial migration | 37/1580 | 114/8465 | 2.77e-04 | 2.56e-03 | 1.86e-03 | 37 |
| Page: 1 2 3 |
Top |
Cell-cell communication analysis |
| Identification of potential cell-cell interactions between two cell types and their ligand-receptor pairs for different disease states |
| Ligand | Receptor | LRpair | Pathway | Tissue | Disease Stage |
| F11R | ITGAL_ITGB2 | JAM1_ITGAL_ITGB2 | JAM | Breast | ADJ |
| F11R | F11R | F11R_F11R | JAM | Breast | ADJ |
| F11R | JAM2 | F11R_JAM2 | JAM | Breast | ADJ |
| F11R | JAM3 | F11R_JAM3 | JAM | Breast | ADJ |
| JAM2 | F11R | JAM2_F11R | JAM | Breast | ADJ |
| JAM3 | F11R | JAM3_F11R | JAM | Breast | ADJ |
| F11R | ITGAL_ITGB2 | JAM1_ITGAL_ITGB2 | JAM | Breast | DCIS |
| F11R | F11R | F11R_F11R | JAM | Breast | DCIS |
| F11R | JAM2 | F11R_JAM2 | JAM | Breast | DCIS |
| F11R | JAM3 | F11R_JAM3 | JAM | Breast | DCIS |
| JAM2 | F11R | JAM2_F11R | JAM | Breast | DCIS |
| JAM3 | F11R | JAM3_F11R | JAM | Breast | DCIS |
| F11R | ITGAL_ITGB2 | JAM1_ITGAL_ITGB2 | JAM | Breast | IDC |
| F11R | F11R | F11R_F11R | JAM | Breast | IDC |
| F11R | F11R | F11R_F11R | JAM | Breast | Precancer |
| F11R | ITGAL_ITGB2 | JAM1_ITGAL_ITGB2 | JAM | Cervix | ADJ |
| F11R | F11R | F11R_F11R | JAM | Cervix | ADJ |
| F11R | JAM2 | F11R_JAM2 | JAM | Cervix | ADJ |
| JAM2 | F11R | JAM2_F11R | JAM | Cervix | ADJ |
| F11R | ITGAL_ITGB2 | JAM1_ITGAL_ITGB2 | JAM | Cervix | CC |
| Page: 1 2 3 4 5 6 7 |
Top |
Single-cell gene regulatory network inference analysis |
| Find out the significant the regulons (TFs) and the target genes of each regulon across cell types for different disease states |
| TF | Cell Type | Tissue | Disease Stage | Target Gene | RSS | Regulon Activity |
| ∗The dot plots of a searched regulon are shown for all cell subpopulations in each disease state of each tissue based on the regulon specific score inferred using pySCENIC and by calculating the average expression. |
| Page: 1 |
Top |
Somatic mutation of malignant transformation related genes |
| Annotation of somatic variants for genes involved in malignant transformation |
| Hugo Symbol | Variant Class | Variant Classification | dbSNP RS | HGVSc | HGVSp | HGVSp Short | SWISSPROT | BIOTYPE | SIFT | PolyPhen | Tumor Sample Barcode | Tissue | Histology | Sex | Age | Stage | Therapy Types | Drugs | Outcome |
| F11R | SNV | Missense_Mutation | c.282N>G | p.Ile94Met | p.I94M | Q9Y624 | protein_coding | deleterious(0) | probably_damaging(0.965) | TCGA-A2-A0YD-01 | Breast | breast invasive carcinoma | Female | <65 | I/II | Chemotherapy | cytoxan | SD | |
| F11R | SNV | Missense_Mutation | c.593T>A | p.Val198Asp | p.V198D | Q9Y624 | protein_coding | deleterious(0.01) | benign(0.443) | TCGA-AC-A5EH-01 | Breast | breast invasive carcinoma | Female | >=65 | I/II | Unknown | Unknown | SD | |
| F11R | SNV | Missense_Mutation | rs574502480 | c.554N>G | p.Asn185Ser | p.N185S | Q9Y624 | protein_coding | deleterious(0) | probably_damaging(0.995) | TCGA-BH-A1FU-01 | Breast | breast invasive carcinoma | Female | <65 | I/II | Unknown | Unknown | PD |
| F11R | insertion | In_Frame_Ins | novel | c.838_839insCAC | p.Tyr280delinsSerHis | p.Y280delinsSH | Q9Y624 | protein_coding | TCGA-E9-A244-01 | Breast | breast invasive carcinoma | Female | <65 | I/II | Chemotherapy | cyclophosphamide | SD | ||
| F11R | SNV | Missense_Mutation | c.124N>C | p.Glu42Gln | p.E42Q | Q9Y624 | protein_coding | deleterious(0.04) | probably_damaging(0.957) | TCGA-DR-A0ZM-01 | Cervix | cervical & endocervical cancer | Female | <65 | III/IV | Unspecific | Cisplatin | SD | |
| F11R | SNV | Missense_Mutation | novel | c.234G>C | p.Lys78Asn | p.K78N | Q9Y624 | protein_coding | deleterious(0.01) | possibly_damaging(0.743) | TCGA-EA-A3HU-01 | Cervix | cervical & endocervical cancer | Female | <65 | I/II | Unknown | Unknown | SD |
| F11R | SNV | Missense_Mutation | c.137T>C | p.Val46Ala | p.V46A | Q9Y624 | protein_coding | tolerated(1) | benign(0.028) | TCGA-AA-A022-01 | Colorectum | colon adenocarcinoma | Female | >=65 | I/II | Unknown | Unknown | SD | |
| F11R | SNV | Missense_Mutation | rs373771702 | c.179T>C | p.Val60Ala | p.V60A | Q9Y624 | protein_coding | deleterious(0) | benign(0.351) | TCGA-AA-A02R-01 | Colorectum | colon adenocarcinoma | Female | >=65 | I/II | Unknown | Unknown | PD |
| F11R | SNV | Missense_Mutation | novel | c.811A>C | p.Lys271Gln | p.K271Q | Q9Y624 | protein_coding | deleterious(0.02) | possibly_damaging(0.451) | TCGA-AZ-4315-01 | Colorectum | colon adenocarcinoma | Male | <65 | I/II | Unknown | Unknown | SD |
| F11R | SNV | Missense_Mutation | c.662N>A | p.Pro221His | p.P221H | Q9Y624 | protein_coding | deleterious(0) | possibly_damaging(0.709) | TCGA-D5-6928-01 | Colorectum | colon adenocarcinoma | Male | >=65 | I/II | Unknown | Unknown | SD |
| Page: 1 2 3 |
Top |
Related drugs of malignant transformation related genes |
| Identification of chemicals and drugs interact with genes involved in malignant transfromation |
| (DGIdb 4.0) |
| Entrez ID | Symbol | Category | Interaction Types | Drug Claim Name | Drug Name | PMIDs |
| Page: 1 |

Copyright 2023-Present -The University of Texas Health Science Center at Houston |