
|
|||||
|
 | |
| |
| |
| |
| |
| |
|
Gene: EZH1 |
Gene summary for EZH1 |
| Gene information | Species | Human | Gene symbol | EZH1 | Gene ID | 2145 |
| Gene name | enhancer of zeste 1 polycomb repressive complex 2 subunit | |
| Gene Alias | KMT6B | |
| Cytomap | 17q21.2 | |
| Gene Type | protein-coding | GO ID | GO:0000122 | UniProtAcc | Q92800 |
Top |
Malignant transformation analysis |
| Identification of the aberrant gene expression in precancerous and cancerous lesions by comparing the gene expression of stem-like cells in diseased tissues with normal stem cells |
| Entrez ID | Symbol | Replicates | Species | Organ | Tissue | Adj P-value | Log2FC | Malignancy |
| 2145 | EZH1 | male-WTA | Human | Thyroid | PTC | 3.93e-08 | 1.44e-01 | 0.1037 |
| 2145 | EZH1 | PTC01 | Human | Thyroid | PTC | 2.50e-06 | 1.43e-01 | 0.1899 |
| 2145 | EZH1 | PTC03 | Human | Thyroid | PTC | 8.51e-11 | 3.32e-01 | 0.1784 |
| 2145 | EZH1 | PTC04 | Human | Thyroid | PTC | 6.34e-22 | 3.28e-01 | 0.1927 |
| 2145 | EZH1 | PTC05 | Human | Thyroid | PTC | 2.24e-24 | 8.07e-01 | 0.2065 |
| 2145 | EZH1 | PTC06 | Human | Thyroid | PTC | 6.54e-29 | 5.82e-01 | 0.2057 |
| 2145 | EZH1 | PTC07 | Human | Thyroid | PTC | 5.13e-29 | 5.26e-01 | 0.2044 |
| 2145 | EZH1 | ATC09 | Human | Thyroid | ATC | 4.54e-09 | 3.24e-01 | 0.2871 |
| 2145 | EZH1 | ATC12 | Human | Thyroid | ATC | 1.72e-07 | 1.81e-01 | 0.34 |
| 2145 | EZH1 | ATC1 | Human | Thyroid | ATC | 7.49e-09 | 3.51e-01 | 0.2878 |
| 2145 | EZH1 | ATC4 | Human | Thyroid | ATC | 3.56e-09 | 2.40e-01 | 0.34 |
| 2145 | EZH1 | ATC5 | Human | Thyroid | ATC | 1.04e-03 | 8.05e-02 | 0.34 |
| Page: 1 |
| Tissue | Expression Dynamics | Abbreviation |
| Thyroid | 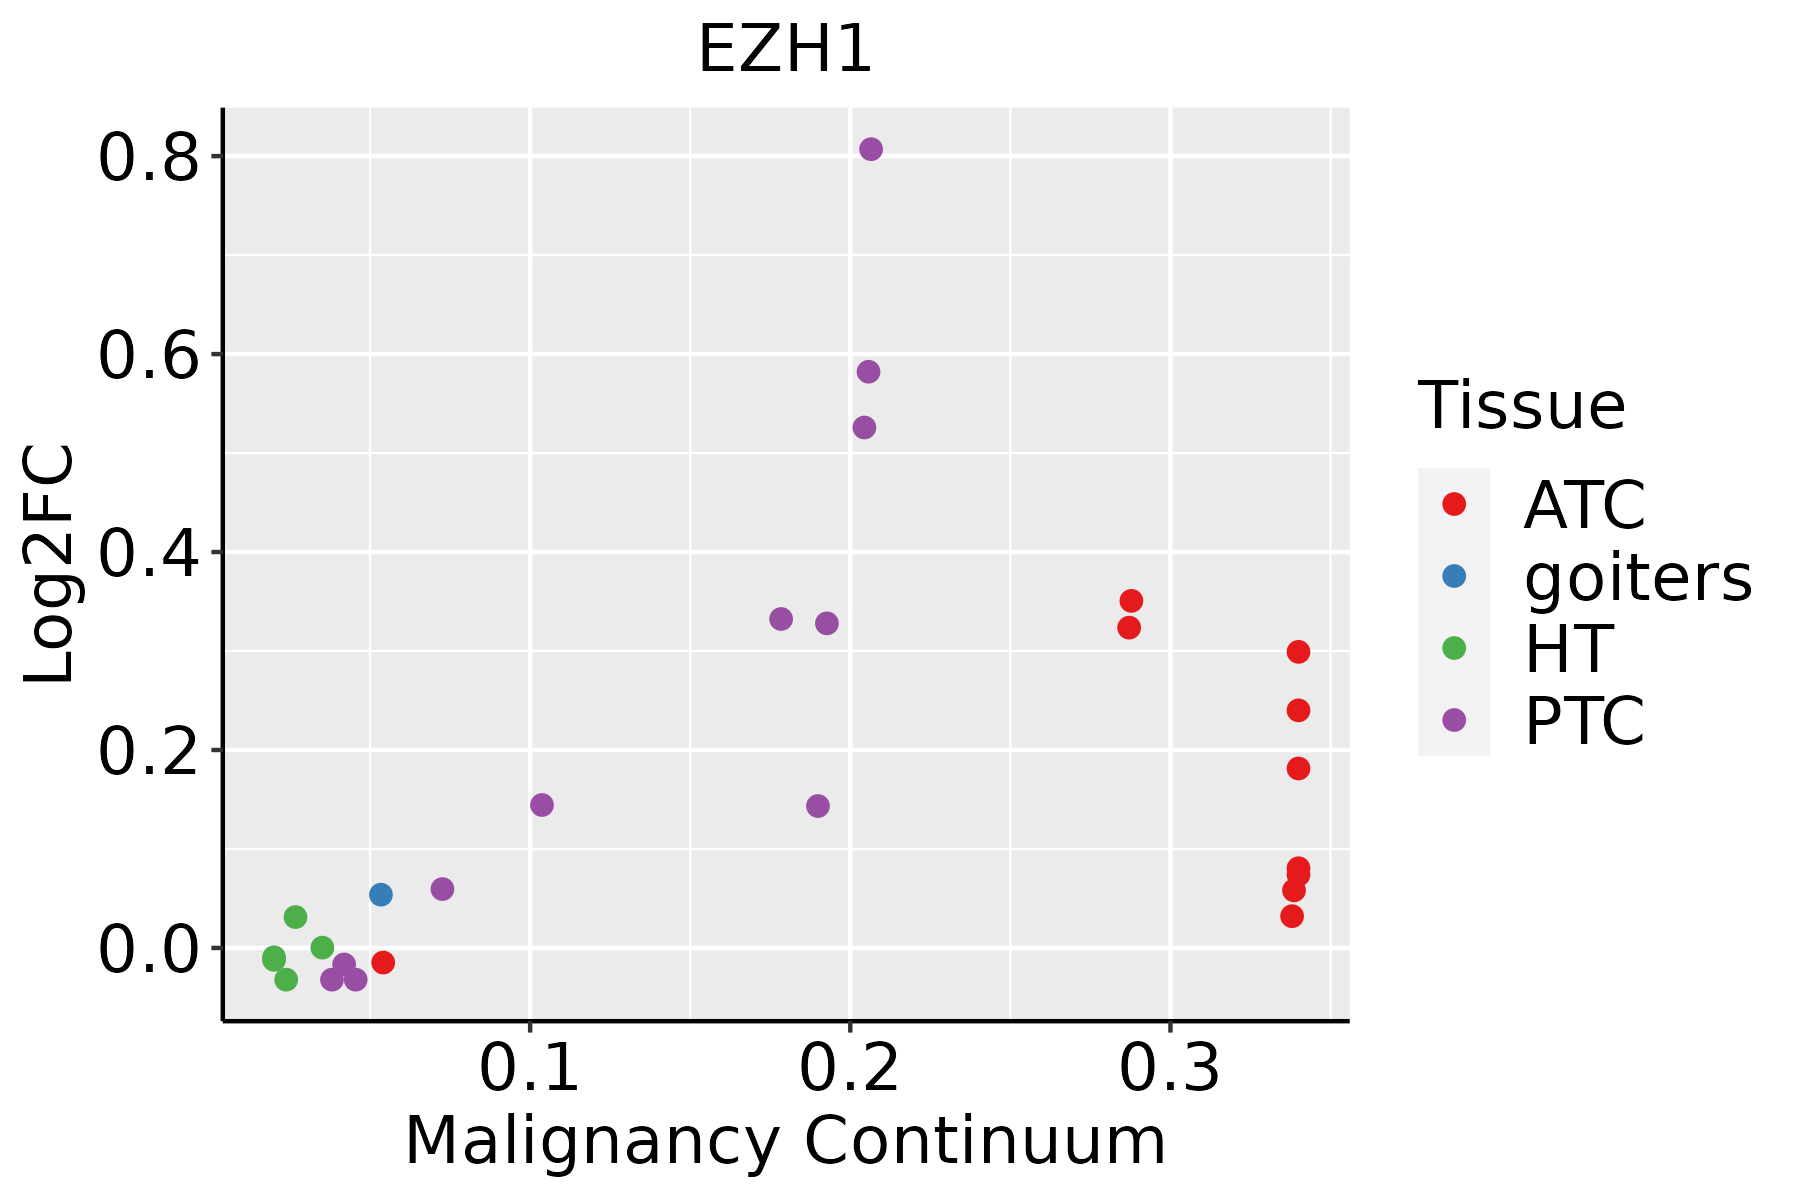 | ATC: Anaplastic thyroid cancer |
| HT: Hashimoto's thyroiditis | ||
| PTC: Papillary thyroid cancer |
| ∗log2FC in expression of this searched gene in stem-like cells from each diseased tissue sample relative to stem-like cells in normal samples in each tissue plotted against the malignancy continuum. Samples are colored based on if they are from different disease stage. |
Top |
Malignant transformation related pathway analysis |
| Find out the enriched GO biological processes and KEGG pathways involved in transition from healthy to precancer to cancer |
| Tissue | Disease Stage | Enriched GO biological Processes |
| Colorectum | AD |  |
| Colorectum | SER |  |
| Colorectum | MSS |  |
| Colorectum | MSI-H |  |
| Colorectum | FAP |  |
| ∗Top 15 enriched GO BP terms are showed in the bar plot of each disease state in each tissue. Each row represents a significant GO biological process which is colored according to the -log10(p.adjust). |
| Page: 1 2 3 4 5 6 7 8 9 |
| GO ID | Tissue | Disease Stage | Description | Gene Ratio | Bg Ratio | pvalue | p.adjust | Count |
| GO:001657010 | Thyroid | PTC | histone modification | 235/5968 | 463/18723 | 1.17e-17 | 1.15e-15 | 235 |
| GO:00182059 | Thyroid | PTC | peptidyl-lysine modification | 188/5968 | 376/18723 | 1.34e-13 | 7.09e-12 | 188 |
| GO:000632520 | Thyroid | PTC | chromatin organization | 183/5968 | 409/18723 | 2.55e-08 | 5.70e-07 | 183 |
| GO:00400297 | Thyroid | PTC | regulation of gene expression, epigenetic | 57/5968 | 105/18723 | 1.60e-06 | 2.25e-05 | 57 |
| GO:001657110 | Thyroid | PTC | histone methylation | 67/5968 | 141/18723 | 7.31e-05 | 6.31e-04 | 67 |
| GO:000647910 | Thyroid | PTC | protein methylation | 82/5968 | 181/18723 | 1.01e-04 | 8.21e-04 | 82 |
| GO:000821310 | Thyroid | PTC | protein alkylation | 82/5968 | 181/18723 | 1.01e-04 | 8.21e-04 | 82 |
| GO:00322594 | Thyroid | PTC | methylation | 146/5968 | 364/18723 | 4.99e-04 | 3.26e-03 | 146 |
| GO:00063385 | Thyroid | PTC | chromatin remodeling | 106/5968 | 255/18723 | 6.56e-04 | 4.13e-03 | 106 |
| GO:00434145 | Thyroid | PTC | macromolecule methylation | 127/5968 | 316/18723 | 1.02e-03 | 6.07e-03 | 127 |
| GO:0031507 | Thyroid | PTC | heterochromatin assembly | 22/5968 | 39/18723 | 1.32e-03 | 7.47e-03 | 22 |
| GO:003496810 | Thyroid | PTC | histone lysine methylation | 52/5968 | 115/18723 | 1.82e-03 | 9.84e-03 | 52 |
| GO:00215438 | Thyroid | PTC | pallium development | 72/5968 | 169/18723 | 2.09e-03 | 1.11e-02 | 72 |
| GO:00458142 | Thyroid | PTC | negative regulation of gene expression, epigenetic | 26/5968 | 50/18723 | 2.44e-03 | 1.27e-02 | 26 |
| GO:00215373 | Thyroid | PTC | telencephalon development | 100/5968 | 248/18723 | 2.90e-03 | 1.44e-02 | 100 |
| GO:00708282 | Thyroid | PTC | heterochromatin organization | 24/5968 | 46/18723 | 3.34e-03 | 1.63e-02 | 24 |
| GO:00309007 | Thyroid | PTC | forebrain development | 143/5968 | 379/18723 | 8.47e-03 | 3.56e-02 | 143 |
| GO:001657017 | Thyroid | ATC | histone modification | 243/6293 | 463/18723 | 2.23e-17 | 2.27e-15 | 243 |
| GO:001820516 | Thyroid | ATC | peptidyl-lysine modification | 193/6293 | 376/18723 | 6.92e-13 | 3.06e-11 | 193 |
| GO:0006325110 | Thyroid | ATC | chromatin organization | 189/6293 | 409/18723 | 6.40e-08 | 1.13e-06 | 189 |
| Page: 1 2 |
| Pathway ID | Tissue | Disease Stage | Description | Gene Ratio | Bg Ratio | pvalue | p.adjust | qvalue | Count |
| Page: 1 |
Top |
Cell-cell communication analysis |
| Identification of potential cell-cell interactions between two cell types and their ligand-receptor pairs for different disease states |
| Ligand | Receptor | LRpair | Pathway | Tissue | Disease Stage |
| Page: 1 |
Top |
Single-cell gene regulatory network inference analysis |
| Find out the significant the regulons (TFs) and the target genes of each regulon across cell types for different disease states |
| TF | Cell Type | Tissue | Disease Stage | Target Gene | RSS | Regulon Activity |
| ∗The dot plots of a searched regulon are shown for all cell subpopulations in each disease state of each tissue based on the regulon specific score inferred using pySCENIC and by calculating the average expression. |
| Page: 1 |
Top |
Somatic mutation of malignant transformation related genes |
| Annotation of somatic variants for genes involved in malignant transformation |
| Hugo Symbol | Variant Class | Variant Classification | dbSNP RS | HGVSc | HGVSp | HGVSp Short | SWISSPROT | BIOTYPE | SIFT | PolyPhen | Tumor Sample Barcode | Tissue | Histology | Sex | Age | Stage | Therapy Types | Drugs | Outcome |
| EZH1 | SNV | Missense_Mutation | c.1964N>C | p.Arg655Pro | p.R655P | Q92800 | protein_coding | deleterious(0) | probably_damaging(1) | TCGA-A2-A0CW-01 | Breast | breast invasive carcinoma | Female | >=65 | I/II | Hormone Therapy | anastrozole | SD | |
| EZH1 | deletion | Frame_Shift_Del | novel | c.528delN | p.Leu177TrpfsTer7 | p.L177Wfs*7 | Q92800 | protein_coding | TCGA-D8-A27V-01 | Breast | breast invasive carcinoma | Female | <65 | I/II | Hormone Therapy | tamoxiphen | SD | ||
| EZH1 | SNV | Missense_Mutation | novel | c.213N>A | p.Met71Ile | p.M71I | Q92800 | protein_coding | tolerated(0.42) | benign(0.065) | TCGA-C5-A2LZ-01 | Cervix | cervical & endocervical cancer | Female | >=65 | III/IV | Unknown | Unknown | PD |
| EZH1 | SNV | Missense_Mutation | c.775G>C | p.Glu259Gln | p.E259Q | Q92800 | protein_coding | deleterious(0.04) | probably_damaging(0.973) | TCGA-EA-A50E-01 | Cervix | cervical & endocervical cancer | Female | <65 | I/II | Unknown | Unknown | PD | |
| EZH1 | SNV | Missense_Mutation | novel | c.459C>A | p.Asn153Lys | p.N153K | Q92800 | protein_coding | deleterious(0) | probably_damaging(0.971) | TCGA-EX-A1H6-01 | Cervix | cervical & endocervical cancer | Female | <65 | I/II | Unknown | Unknown | SD |
| EZH1 | SNV | Missense_Mutation | rs867021719 | c.172G>A | p.Glu58Lys | p.E58K | Q92800 | protein_coding | tolerated(0.56) | benign(0.007) | TCGA-IR-A3LH-01 | Cervix | cervical & endocervical cancer | Female | <65 | I/II | Chemotherapy | cisplatin | CR |
| EZH1 | SNV | Missense_Mutation | c.1905G>C | p.Lys635Asn | p.K635N | Q92800 | protein_coding | deleterious(0) | probably_damaging(0.997) | TCGA-JW-A5VL-01 | Cervix | cervical & endocervical cancer | Female | <65 | I/II | Unknown | Unknown | SD | |
| EZH1 | SNV | Missense_Mutation | novel | c.557N>C | p.Tyr186Ser | p.Y186S | Q92800 | protein_coding | tolerated(0.05) | benign(0.007) | TCGA-VS-A9V1-01 | Cervix | cervical & endocervical cancer | Female | <65 | I/II | Chemotherapy | cisplatin | PD |
| EZH1 | SNV | Missense_Mutation | c.1794G>T | p.Lys598Asn | p.K598N | Q92800 | protein_coding | tolerated(0.1) | benign(0.443) | TCGA-AA-3663-01 | Colorectum | colon adenocarcinoma | Male | <65 | I/II | Unknown | Unknown | SD | |
| EZH1 | SNV | Missense_Mutation | novel | c.2054T>A | p.Ile685Asn | p.I685N | Q92800 | protein_coding | deleterious(0) | probably_damaging(0.999) | TCGA-AA-3715-01 | Colorectum | colon adenocarcinoma | Male | >=65 | I/II | Unknown | Unknown | PD |
| Page: 1 2 3 4 5 6 7 |
Top |
Related drugs of malignant transformation related genes |
| Identification of chemicals and drugs interact with genes involved in malignant transfromation |
| (DGIdb 4.0) |
| Entrez ID | Symbol | Category | Interaction Types | Drug Claim Name | Drug Name | PMIDs |
| 2145 | EZH1 | METHYL TRANSFERASE, ENZYME | inhibitor | 249565920 | ||
| 2145 | EZH1 | METHYL TRANSFERASE, ENZYME | DS-3201 |
| Page: 1 |

Copyright 2023-Present -The University of Texas Health Science Center at Houston |