
|
|||||
|
 | |
| |
| |
| |
| |
| |
|
Gene: EYA2 |
Gene summary for EYA2 |
| Gene information | Species | Human | Gene symbol | EYA2 | Gene ID | 2139 |
| Gene name | EYA transcriptional coactivator and phosphatase 2 | |
| Gene Alias | EAB1 | |
| Cytomap | 20q13.12 | |
| Gene Type | protein-coding | GO ID | GO:0001704 | UniProtAcc | O00167 |
Top |
Malignant transformation analysis |
| Identification of the aberrant gene expression in precancerous and cancerous lesions by comparing the gene expression of stem-like cells in diseased tissues with normal stem cells |
| Entrez ID | Symbol | Replicates | Species | Organ | Tissue | Adj P-value | Log2FC | Malignancy |
| 2139 | EYA2 | CA_HPV_1 | Human | Cervix | CC | 3.40e-02 | -1.00e-01 | 0.0264 |
| 2139 | EYA2 | CCI_1 | Human | Cervix | CC | 3.36e-16 | 1.41e+00 | 0.528 |
| 2139 | EYA2 | CCI_2 | Human | Cervix | CC | 1.96e-13 | 1.71e+00 | 0.5249 |
| 2139 | EYA2 | CCI_3 | Human | Cervix | CC | 9.44e-25 | 1.45e+00 | 0.516 |
| 2139 | EYA2 | H2 | Human | Cervix | HSIL_HPV | 3.81e-09 | 3.32e-01 | 0.0632 |
| 2139 | EYA2 | HTA11_3410_2000001011 | Human | Colorectum | AD | 7.51e-25 | -9.62e-01 | 0.0155 |
| 2139 | EYA2 | HTA11_2487_2000001011 | Human | Colorectum | SER | 5.25e-09 | -6.59e-01 | -0.1808 |
| 2139 | EYA2 | HTA11_1938_2000001011 | Human | Colorectum | AD | 1.02e-07 | -8.27e-01 | -0.0811 |
| 2139 | EYA2 | HTA11_78_2000001011 | Human | Colorectum | AD | 3.58e-07 | -7.12e-01 | -0.1088 |
| 2139 | EYA2 | HTA11_347_2000001011 | Human | Colorectum | AD | 6.95e-04 | 4.03e-01 | -0.1954 |
| 2139 | EYA2 | HTA11_3361_2000001011 | Human | Colorectum | AD | 1.19e-09 | -7.46e-01 | -0.1207 |
| 2139 | EYA2 | HTA11_866_2000001011 | Human | Colorectum | AD | 7.31e-09 | -5.70e-01 | -0.1001 |
| 2139 | EYA2 | HTA11_2992_2000001011 | Human | Colorectum | SER | 4.54e-06 | -9.72e-01 | -0.1706 |
| 2139 | EYA2 | HTA11_5212_2000001011 | Human | Colorectum | AD | 1.64e-06 | -1.01e+00 | -0.2061 |
| 2139 | EYA2 | HTA11_4255_2000001011 | Human | Colorectum | SER | 4.00e-05 | -1.07e+00 | 0.0446 |
| 2139 | EYA2 | HTA11_8622_2000001021 | Human | Colorectum | SER | 4.69e-02 | -7.70e-01 | 0.0528 |
| 2139 | EYA2 | HTA11_10711_2000001011 | Human | Colorectum | AD | 3.35e-03 | -5.98e-01 | 0.0338 |
| 2139 | EYA2 | HTA11_7696_3000711011 | Human | Colorectum | AD | 4.90e-34 | -9.22e-01 | 0.0674 |
| 2139 | EYA2 | HTA11_6818_2000001021 | Human | Colorectum | AD | 3.23e-15 | -1.00e+00 | 0.0588 |
| 2139 | EYA2 | HTA11_99999970781_79442 | Human | Colorectum | MSS | 5.76e-46 | -1.06e+00 | 0.294 |
| Page: 1 2 3 4 5 6 7 8 |
| Tissue | Expression Dynamics | Abbreviation |
| Cervix | 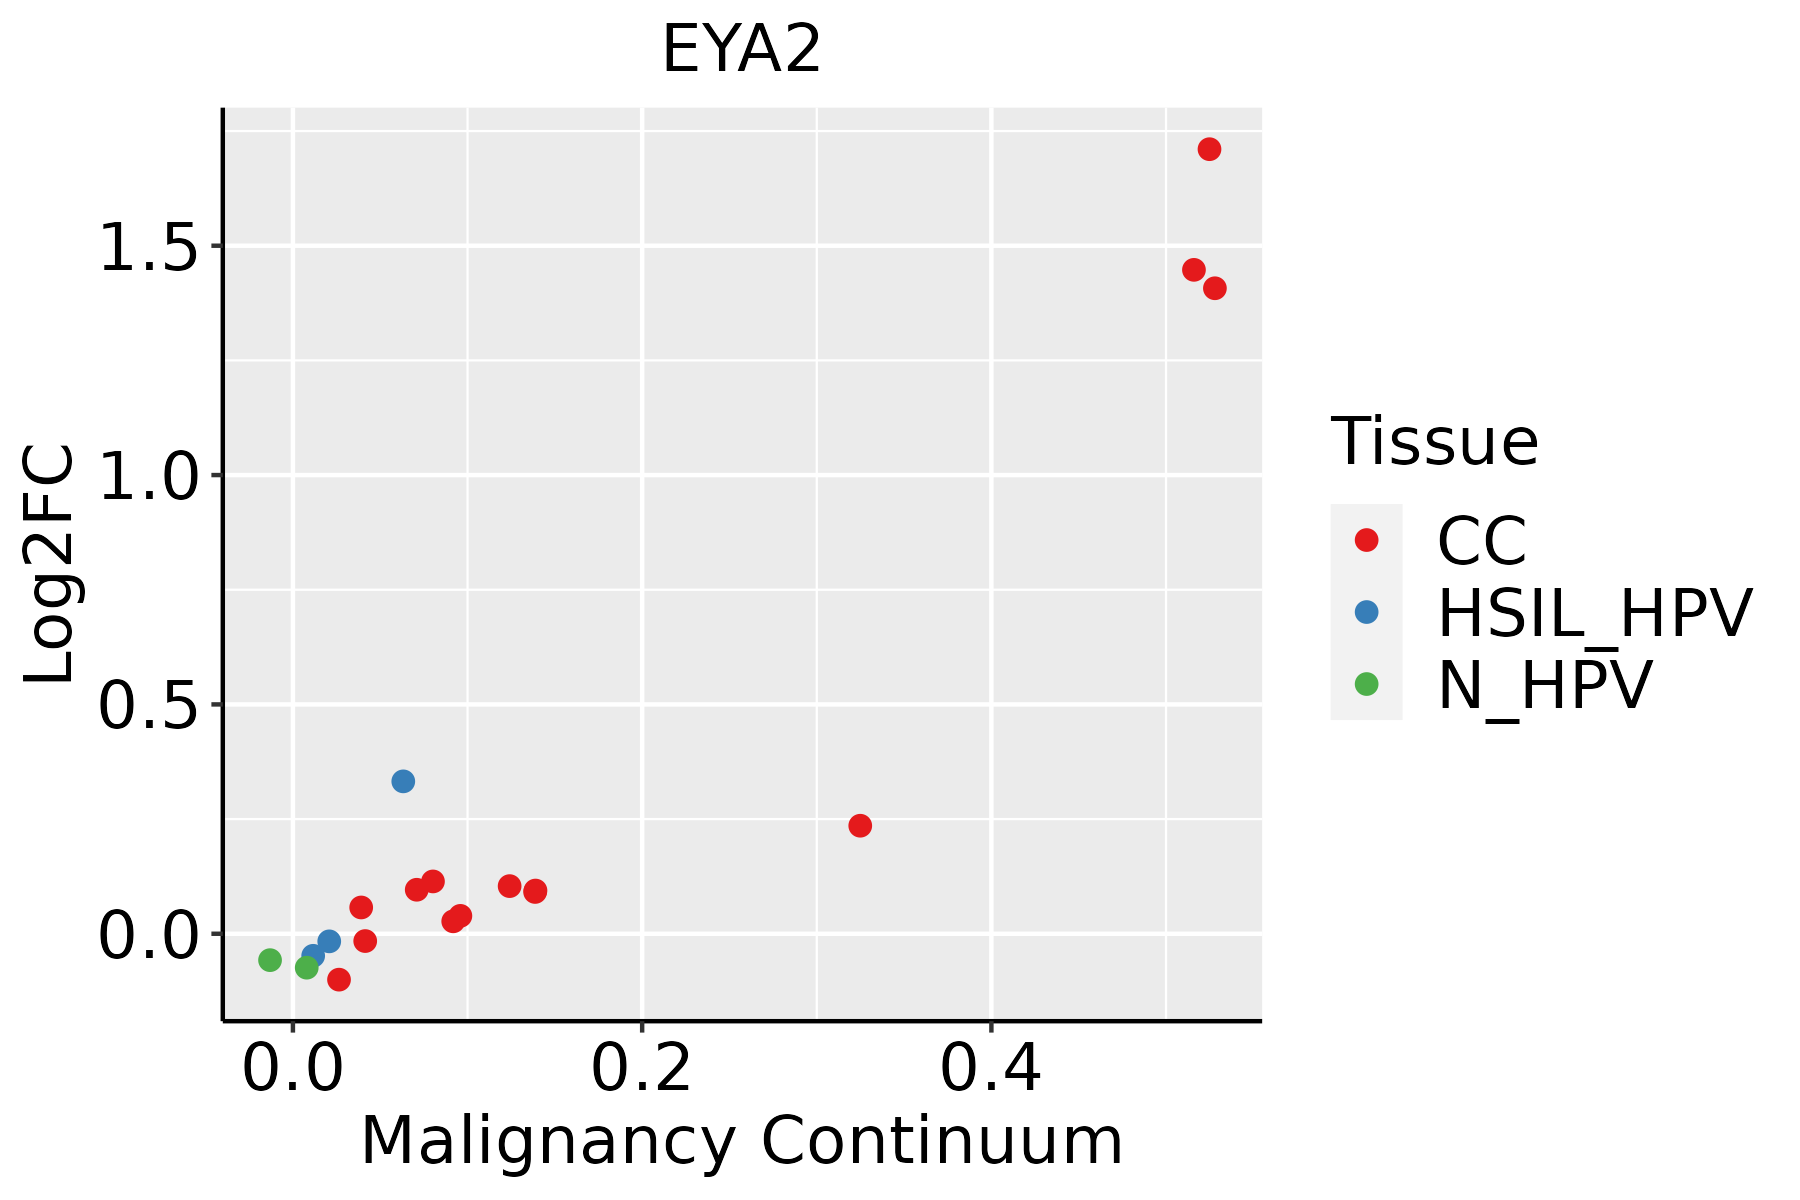 | CC: Cervix cancer |
| HSIL_HPV: HPV-infected high-grade squamous intraepithelial lesions | ||
| N_HPV: HPV-infected normal cervix | ||
| Colorectum (GSE201348) |  | FAP: Familial adenomatous polyposis |
| CRC: Colorectal cancer | ||
| Colorectum (HTA11) |  | AD: Adenomas |
| SER: Sessile serrated lesions | ||
| MSI-H: Microsatellite-high colorectal cancer | ||
| MSS: Microsatellite stable colorectal cancer | ||
| Endometrium | 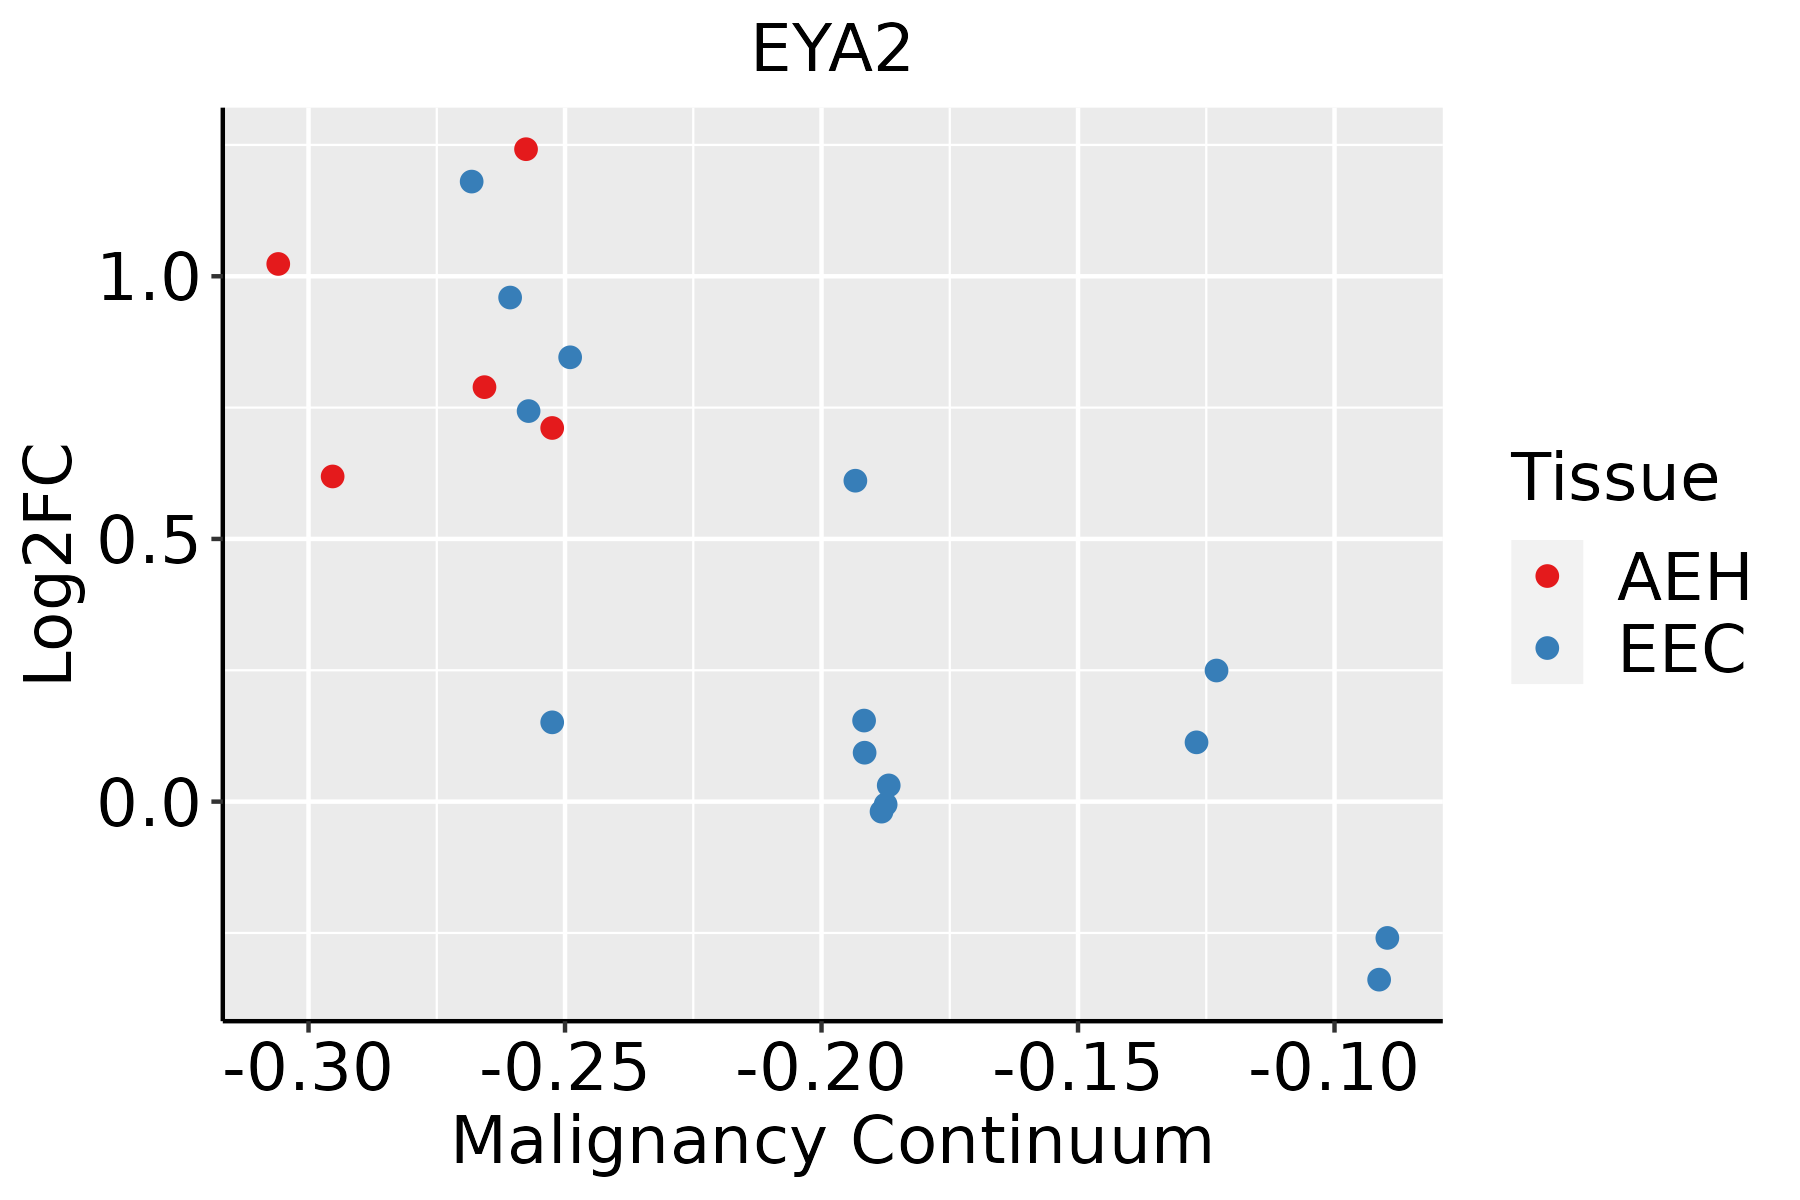 | AEH: Atypical endometrial hyperplasia |
| EEC: Endometrioid Cancer | ||
| Esophagus | 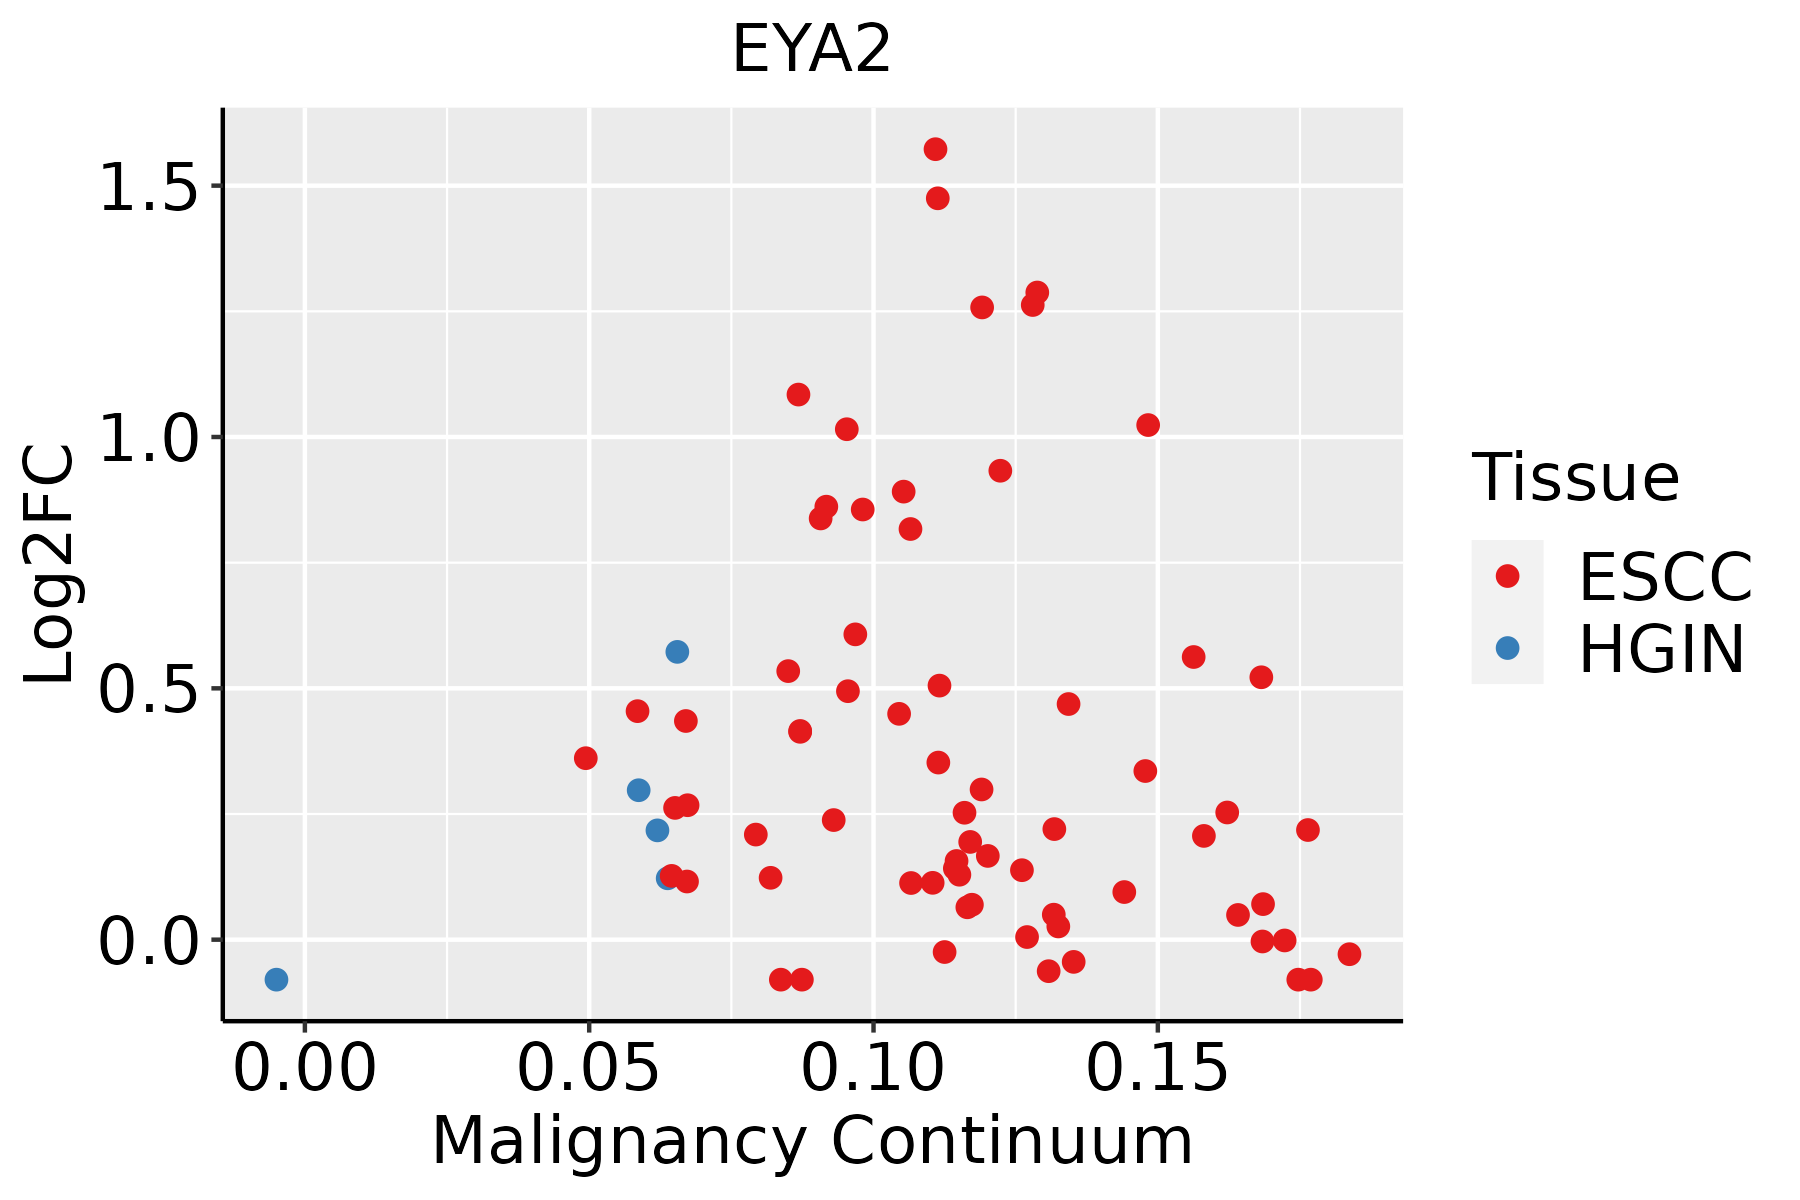 | ESCC: Esophageal squamous cell carcinoma |
| HGIN: High-grade intraepithelial neoplasias | ||
| LGIN: Low-grade intraepithelial neoplasias | ||
| Oral Cavity | 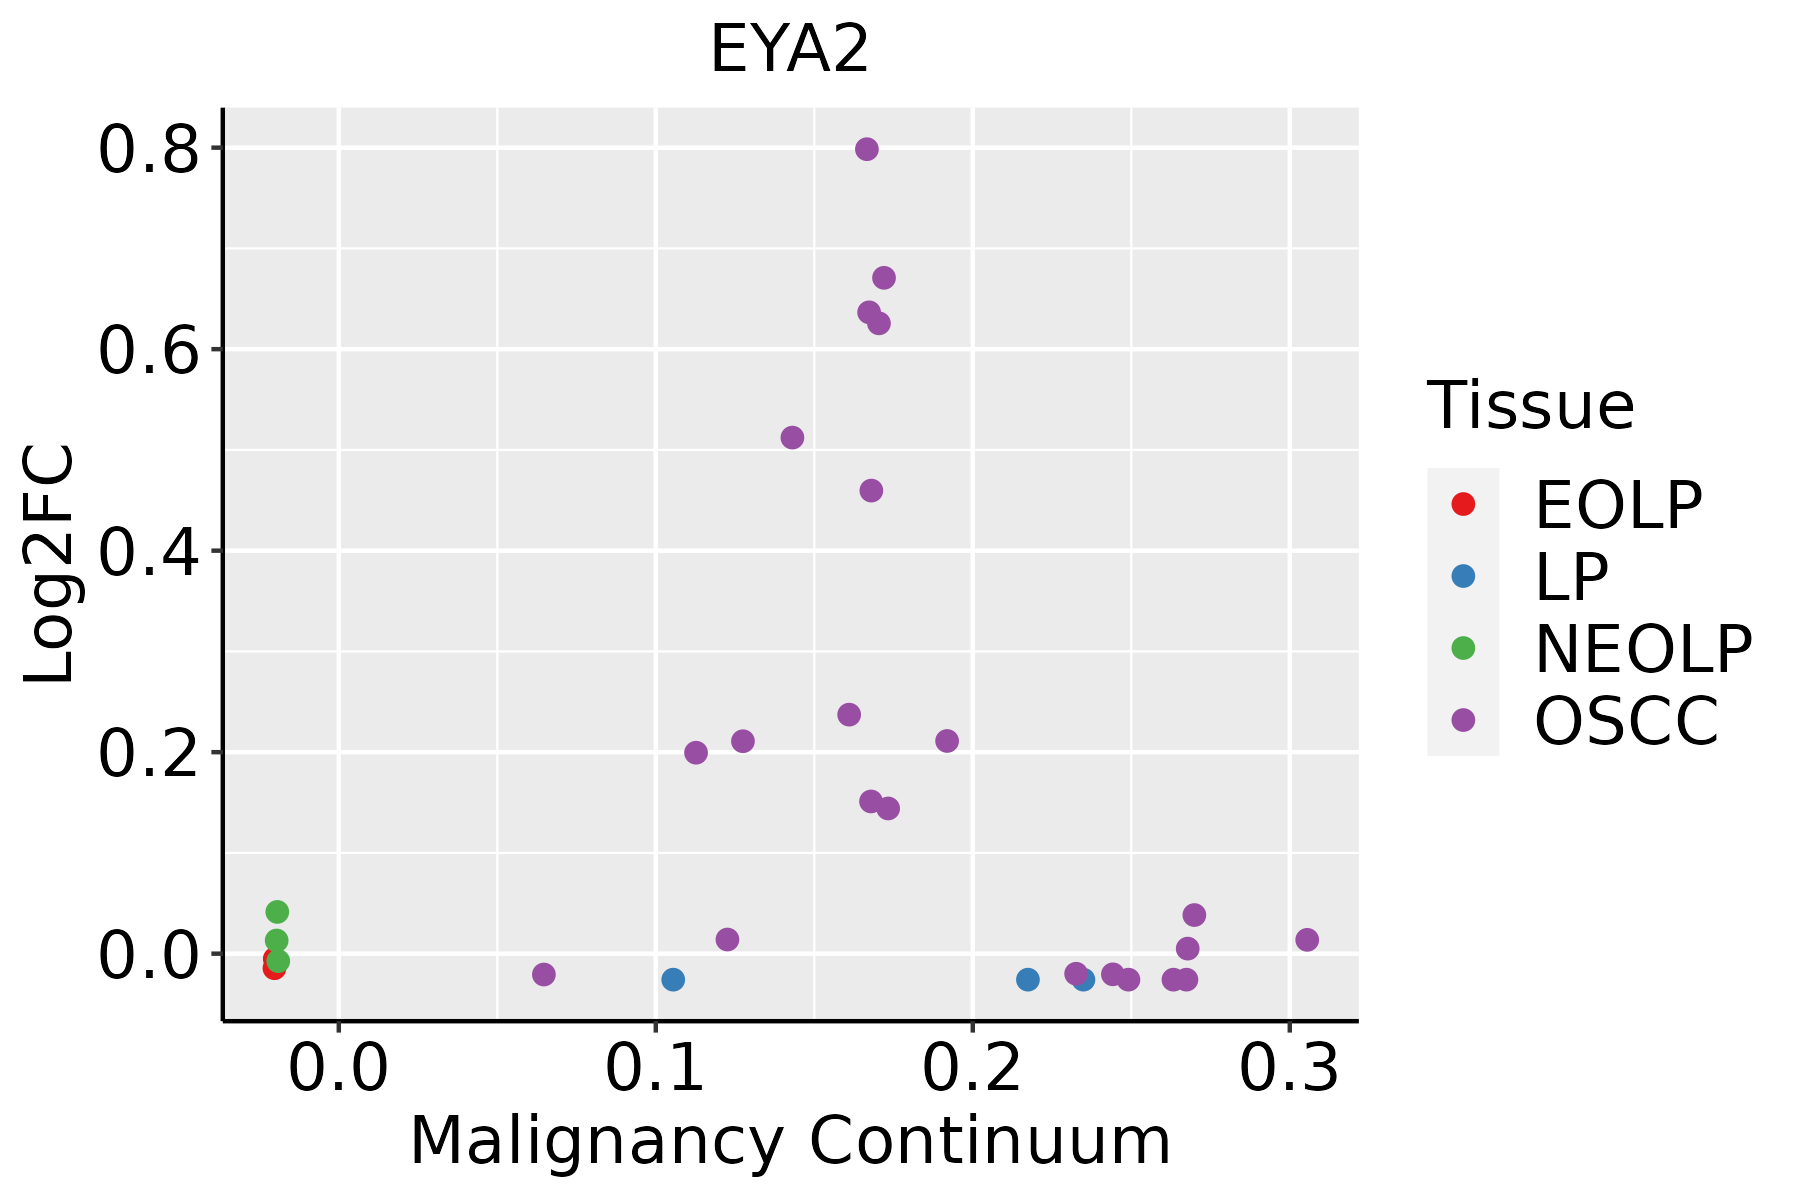 | EOLP: Erosive Oral lichen planus |
| LP: leukoplakia | ||
| NEOLP: Non-erosive oral lichen planus | ||
| OSCC: Oral squamous cell carcinoma | ||
| Prostate |  | BPH: Benign Prostatic Hyperplasia |
| ∗log2FC in expression of this searched gene in stem-like cells from each diseased tissue sample relative to stem-like cells in normal samples in each tissue plotted against the malignancy continuum. Samples are colored based on if they are from different disease stage. |
Top |
Malignant transformation related pathway analysis |
| Find out the enriched GO biological processes and KEGG pathways involved in transition from healthy to precancer to cancer |
| Tissue | Disease Stage | Enriched GO biological Processes |
| Colorectum | AD |  |
| Colorectum | SER |  |
| Colorectum | MSS |  |
| Colorectum | MSI-H |  |
| Colorectum | FAP |  |
| ∗Top 15 enriched GO BP terms are showed in the bar plot of each disease state in each tissue. Each row represents a significant GO biological process which is colored according to the -log10(p.adjust). |
| Page: 1 2 3 4 5 6 7 8 9 |
| GO ID | Tissue | Disease Stage | Description | Gene Ratio | Bg Ratio | pvalue | p.adjust | Count |
| GO:200123310 | Cervix | CC | regulation of apoptotic signaling pathway | 96/2311 | 356/18723 | 4.08e-14 | 3.05e-11 | 96 |
| GO:200123410 | Cervix | CC | negative regulation of apoptotic signaling pathway | 56/2311 | 224/18723 | 1.39e-07 | 6.70e-06 | 56 |
| GO:00068399 | Cervix | CC | mitochondrial transport | 60/2311 | 254/18723 | 4.21e-07 | 1.67e-05 | 60 |
| GO:009719110 | Cervix | CC | extrinsic apoptotic signaling pathway | 52/2311 | 219/18723 | 2.06e-06 | 6.34e-05 | 52 |
| GO:00064708 | Cervix | CC | protein dephosphorylation | 60/2311 | 281/18723 | 1.33e-05 | 2.68e-04 | 60 |
| GO:200123610 | Cervix | CC | regulation of extrinsic apoptotic signaling pathway | 37/2311 | 151/18723 | 2.80e-05 | 4.65e-04 | 37 |
| GO:00073695 | Cervix | CC | gastrulation | 42/2311 | 185/18723 | 5.83e-05 | 8.46e-04 | 42 |
| GO:00605375 | Cervix | CC | muscle tissue development | 76/2311 | 403/18723 | 9.76e-05 | 1.27e-03 | 76 |
| GO:00165705 | Cervix | CC | histone modification | 84/2311 | 463/18723 | 1.70e-04 | 2.01e-03 | 84 |
| GO:00147064 | Cervix | CC | striated muscle tissue development | 72/2311 | 384/18723 | 1.76e-04 | 2.07e-03 | 72 |
| GO:20010209 | Cervix | CC | regulation of response to DNA damage stimulus | 46/2311 | 219/18723 | 1.92e-04 | 2.23e-03 | 46 |
| GO:00070067 | Cervix | CC | mitochondrial membrane organization | 28/2311 | 116/18723 | 3.28e-04 | 3.47e-03 | 28 |
| GO:00510528 | Cervix | CC | regulation of DNA metabolic process | 65/2311 | 359/18723 | 9.25e-04 | 7.84e-03 | 65 |
| GO:00086379 | Cervix | CC | apoptotic mitochondrial changes | 25/2311 | 107/18723 | 1.11e-03 | 9.14e-03 | 25 |
| GO:00163117 | Cervix | CC | dephosphorylation | 73/2311 | 417/18723 | 1.23e-03 | 9.87e-03 | 73 |
| GO:200123710 | Cervix | CC | negative regulation of extrinsic apoptotic signaling pathway | 23/2311 | 97/18723 | 1.39e-03 | 1.10e-02 | 23 |
| GO:0001704 | Cervix | CC | formation of primary germ layer | 27/2311 | 121/18723 | 1.49e-03 | 1.16e-02 | 27 |
| GO:200123315 | Cervix | HSIL_HPV | regulation of apoptotic signaling pathway | 46/737 | 356/18723 | 1.23e-12 | 1.49e-09 | 46 |
| GO:200123415 | Cervix | HSIL_HPV | negative regulation of apoptotic signaling pathway | 27/737 | 224/18723 | 2.44e-07 | 1.45e-05 | 27 |
| GO:200123615 | Cervix | HSIL_HPV | regulation of extrinsic apoptotic signaling pathway | 16/737 | 151/18723 | 3.08e-04 | 5.01e-03 | 16 |
| Page: 1 2 3 4 5 6 7 8 9 10 11 12 13 14 15 |
| Pathway ID | Tissue | Disease Stage | Description | Gene Ratio | Bg Ratio | pvalue | p.adjust | qvalue | Count |
| Page: 1 |
Top |
Cell-cell communication analysis |
| Identification of potential cell-cell interactions between two cell types and their ligand-receptor pairs for different disease states |
| Ligand | Receptor | LRpair | Pathway | Tissue | Disease Stage |
| Page: 1 |
Top |
Single-cell gene regulatory network inference analysis |
| Find out the significant the regulons (TFs) and the target genes of each regulon across cell types for different disease states |
| TF | Cell Type | Tissue | Disease Stage | Target Gene | RSS | Regulon Activity |
| ∗The dot plots of a searched regulon are shown for all cell subpopulations in each disease state of each tissue based on the regulon specific score inferred using pySCENIC and by calculating the average expression. |
| Page: 1 |
Top |
Somatic mutation of malignant transformation related genes |
| Annotation of somatic variants for genes involved in malignant transformation |
| Hugo Symbol | Variant Class | Variant Classification | dbSNP RS | HGVSc | HGVSp | HGVSp Short | SWISSPROT | BIOTYPE | SIFT | PolyPhen | Tumor Sample Barcode | Tissue | Histology | Sex | Age | Stage | Therapy Types | Drugs | Outcome |
| EYA2 | SNV | Missense_Mutation | c.710N>T | p.Asp237Val | p.D237V | O00167 | protein_coding | deleterious(0.01) | possibly_damaging(0.843) | TCGA-A1-A0SO-01 | Breast | breast invasive carcinoma | Female | >=65 | I/II | Chemotherapy | SD | ||
| EYA2 | SNV | Missense_Mutation | rs202115929 | c.559G>A | p.Val187Ile | p.V187I | O00167 | protein_coding | tolerated(0.11) | benign(0.022) | TCGA-AN-A0XN-01 | Breast | breast invasive carcinoma | Female | >=65 | III/IV | Unknown | Unknown | SD |
| EYA2 | SNV | Missense_Mutation | c.925N>A | p.Glu309Lys | p.E309K | O00167 | protein_coding | deleterious(0) | probably_damaging(0.994) | TCGA-BH-A1F0-01 | Breast | breast invasive carcinoma | Female | >=65 | I/II | Unknown | Unknown | PD | |
| EYA2 | insertion | Nonsense_Mutation | novel | c.107_108insCCCTTGTGCCCGATGAGCTTTAGAAAAACATAAAACAATC | p.Gln36HisfsTer6 | p.Q36Hfs*6 | O00167 | protein_coding | TCGA-A7-A0CJ-01 | Breast | breast invasive carcinoma | Female | <65 | I/II | Chemotherapy | cytoxan | SD | ||
| EYA2 | SNV | Missense_Mutation | c.844N>G | p.Phe282Val | p.F282V | O00167 | protein_coding | deleterious(0) | probably_damaging(0.999) | TCGA-2W-A8YY-01 | Cervix | cervical & endocervical cancer | Female | <65 | I/II | Chemotherapy | cisplatin | CR | |
| EYA2 | SNV | Missense_Mutation | c.150N>G | p.Phe50Leu | p.F50L | O00167 | protein_coding | tolerated(0.16) | benign(0) | TCGA-EK-A3GK-01 | Cervix | cervical & endocervical cancer | Female | <65 | I/II | Unknown | Unknown | SD | |
| EYA2 | SNV | Missense_Mutation | rs142696386 | c.631N>A | p.Val211Ile | p.V211I | O00167 | protein_coding | tolerated(0.48) | benign(0) | TCGA-A6-2686-01 | Colorectum | colon adenocarcinoma | Female | >=65 | I/II | Unknown | Unknown | SD |
| EYA2 | SNV | Missense_Mutation | novel | c.230N>C | p.Gly77Ala | p.G77A | O00167 | protein_coding | tolerated(0.08) | benign(0.094) | TCGA-AA-3684-01 | Colorectum | colon adenocarcinoma | Female | >=65 | III/IV | Unknown | Unknown | SD |
| EYA2 | SNV | Missense_Mutation | novel | c.230N>C | p.Gly77Ala | p.G77A | O00167 | protein_coding | tolerated(0.08) | benign(0.094) | TCGA-AA-3831-01 | Colorectum | colon adenocarcinoma | Male | >=65 | I/II | Unknown | Unknown | SD |
| EYA2 | SNV | Missense_Mutation | c.844T>G | p.Phe282Val | p.F282V | O00167 | protein_coding | deleterious(0) | probably_damaging(0.999) | TCGA-AA-A00N-01 | Colorectum | colon adenocarcinoma | Male | >=65 | I/II | Unknown | Unknown | PD |
| Page: 1 2 3 4 5 6 7 8 |
Top |
Related drugs of malignant transformation related genes |
| Identification of chemicals and drugs interact with genes involved in malignant transfromation |
| (DGIdb 4.0) |
| Entrez ID | Symbol | Category | Interaction Types | Drug Claim Name | Drug Name | PMIDs |
| 2139 | EYA2 | DNA REPAIR | NSC-127133 | CHEMBL1172911 | ||
| 2139 | EYA2 | DNA REPAIR | SJ000018309 | CHEMBL591363 | ||
| 2139 | EYA2 | DNA REPAIR | FLUAZINAM | FLUAZINAM | ||
| 2139 | EYA2 | DNA REPAIR | (R)-EDELFOSINE | (R)-EDELFOSINE | ||
| 2139 | EYA2 | DNA REPAIR | GNF-PF-3418 | CHEMBL582099 | ||
| 2139 | EYA2 | DNA REPAIR | DNDI1417099 | CHEMBL1565444 | ||
| 2139 | EYA2 | DNA REPAIR | IMATINIB | IMATINIB | ||
| 2139 | EYA2 | DNA REPAIR | SJ000114740 | CHEMBL592068 | ||
| 2139 | EYA2 | DNA REPAIR | DIACEREIN | DIACEREIN | ||
| 2139 | EYA2 | DNA REPAIR | CLOFAZIMINE | CLOFAZIMINE |
| Page: 1 2 3 |

Copyright 2023-Present -The University of Texas Health Science Center at Houston |