
|
|||||
|
 | |
| |
| |
| |
| |
| |
|
Gene: EXTL3 |
Gene summary for EXTL3 |
| Gene information | Species | Human | Gene symbol | EXTL3 | Gene ID | 2137 |
| Gene name | exostosin like glycosyltransferase 3 | |
| Gene Alias | BOTV | |
| Cytomap | 8p21.1 | |
| Gene Type | protein-coding | GO ID | GO:0001558 | UniProtAcc | O43909 |
Top |
Malignant transformation analysis |
| Identification of the aberrant gene expression in precancerous and cancerous lesions by comparing the gene expression of stem-like cells in diseased tissues with normal stem cells |
| Entrez ID | Symbol | Replicates | Species | Organ | Tissue | Adj P-value | Log2FC | Malignancy |
| 2137 | EXTL3 | LZE4T | Human | Esophagus | ESCC | 2.05e-02 | 1.83e-02 | 0.0811 |
| 2137 | EXTL3 | LZE7T | Human | Esophagus | ESCC | 1.62e-02 | 1.43e-01 | 0.0667 |
| 2137 | EXTL3 | LZE20T | Human | Esophagus | ESCC | 2.14e-02 | 2.57e-02 | 0.0662 |
| 2137 | EXTL3 | LZE24T | Human | Esophagus | ESCC | 8.91e-03 | -8.82e-03 | 0.0596 |
| 2137 | EXTL3 | P1T-E | Human | Esophagus | ESCC | 1.29e-04 | 1.52e-01 | 0.0875 |
| 2137 | EXTL3 | P2T-E | Human | Esophagus | ESCC | 5.41e-13 | 1.66e-01 | 0.1177 |
| 2137 | EXTL3 | P4T-E | Human | Esophagus | ESCC | 9.21e-07 | 1.45e-01 | 0.1323 |
| 2137 | EXTL3 | P5T-E | Human | Esophagus | ESCC | 3.12e-03 | -7.51e-03 | 0.1327 |
| 2137 | EXTL3 | P8T-E | Human | Esophagus | ESCC | 3.89e-10 | 2.87e-02 | 0.0889 |
| 2137 | EXTL3 | P9T-E | Human | Esophagus | ESCC | 3.73e-06 | 8.52e-02 | 0.1131 |
| 2137 | EXTL3 | P10T-E | Human | Esophagus | ESCC | 5.48e-11 | 1.58e-01 | 0.116 |
| 2137 | EXTL3 | P11T-E | Human | Esophagus | ESCC | 5.95e-05 | 1.22e-01 | 0.1426 |
| 2137 | EXTL3 | P12T-E | Human | Esophagus | ESCC | 1.44e-10 | 4.42e-02 | 0.1122 |
| 2137 | EXTL3 | P15T-E | Human | Esophagus | ESCC | 1.15e-03 | -1.40e-02 | 0.1149 |
| 2137 | EXTL3 | P16T-E | Human | Esophagus | ESCC | 7.53e-04 | 5.38e-02 | 0.1153 |
| 2137 | EXTL3 | P17T-E | Human | Esophagus | ESCC | 1.61e-07 | 1.36e-01 | 0.1278 |
| 2137 | EXTL3 | P20T-E | Human | Esophagus | ESCC | 9.03e-26 | 1.56e-01 | 0.1124 |
| 2137 | EXTL3 | P21T-E | Human | Esophagus | ESCC | 6.41e-11 | 2.04e-01 | 0.1617 |
| 2137 | EXTL3 | P22T-E | Human | Esophagus | ESCC | 5.12e-05 | 5.73e-02 | 0.1236 |
| 2137 | EXTL3 | P23T-E | Human | Esophagus | ESCC | 3.82e-08 | 4.05e-02 | 0.108 |
| Page: 1 2 3 4 |
| Tissue | Expression Dynamics | Abbreviation |
| Esophagus | 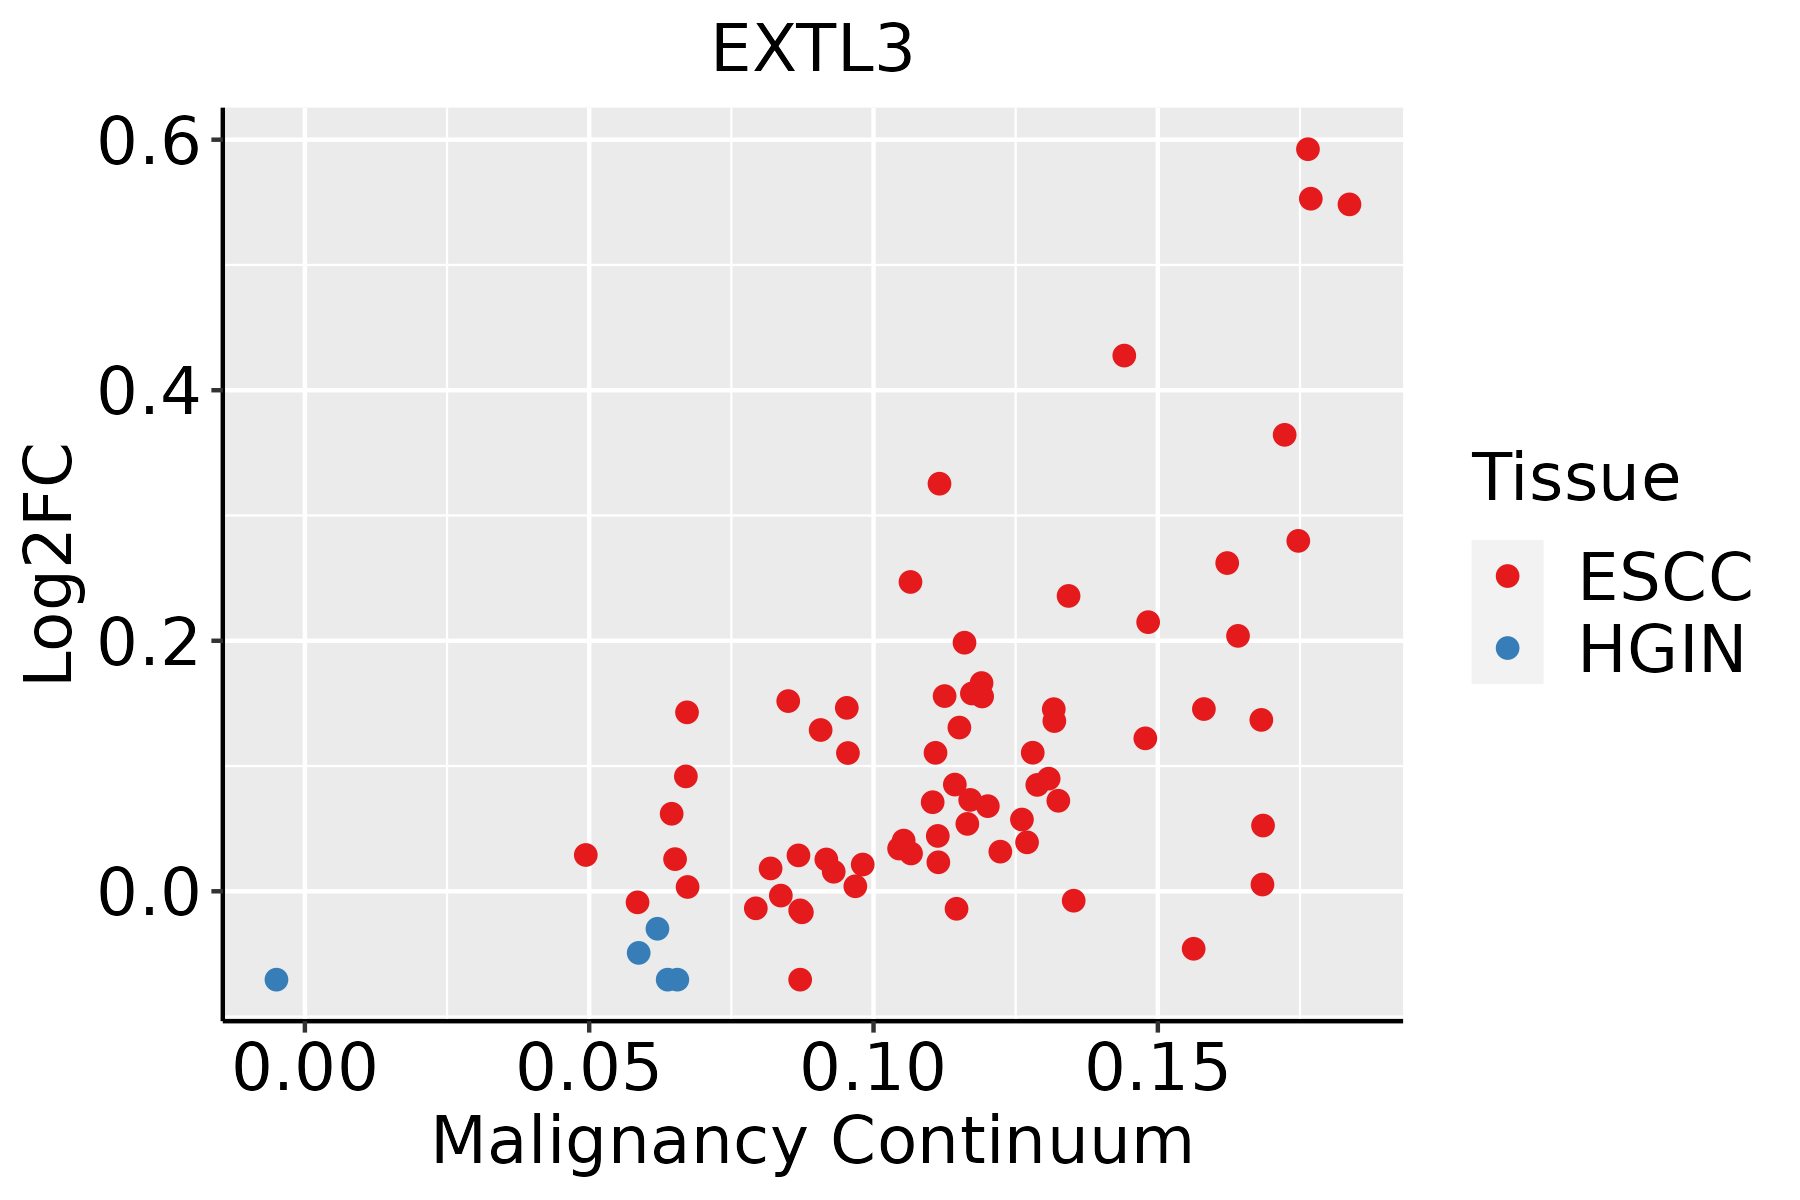 | ESCC: Esophageal squamous cell carcinoma |
| HGIN: High-grade intraepithelial neoplasias | ||
| LGIN: Low-grade intraepithelial neoplasias | ||
| Liver | 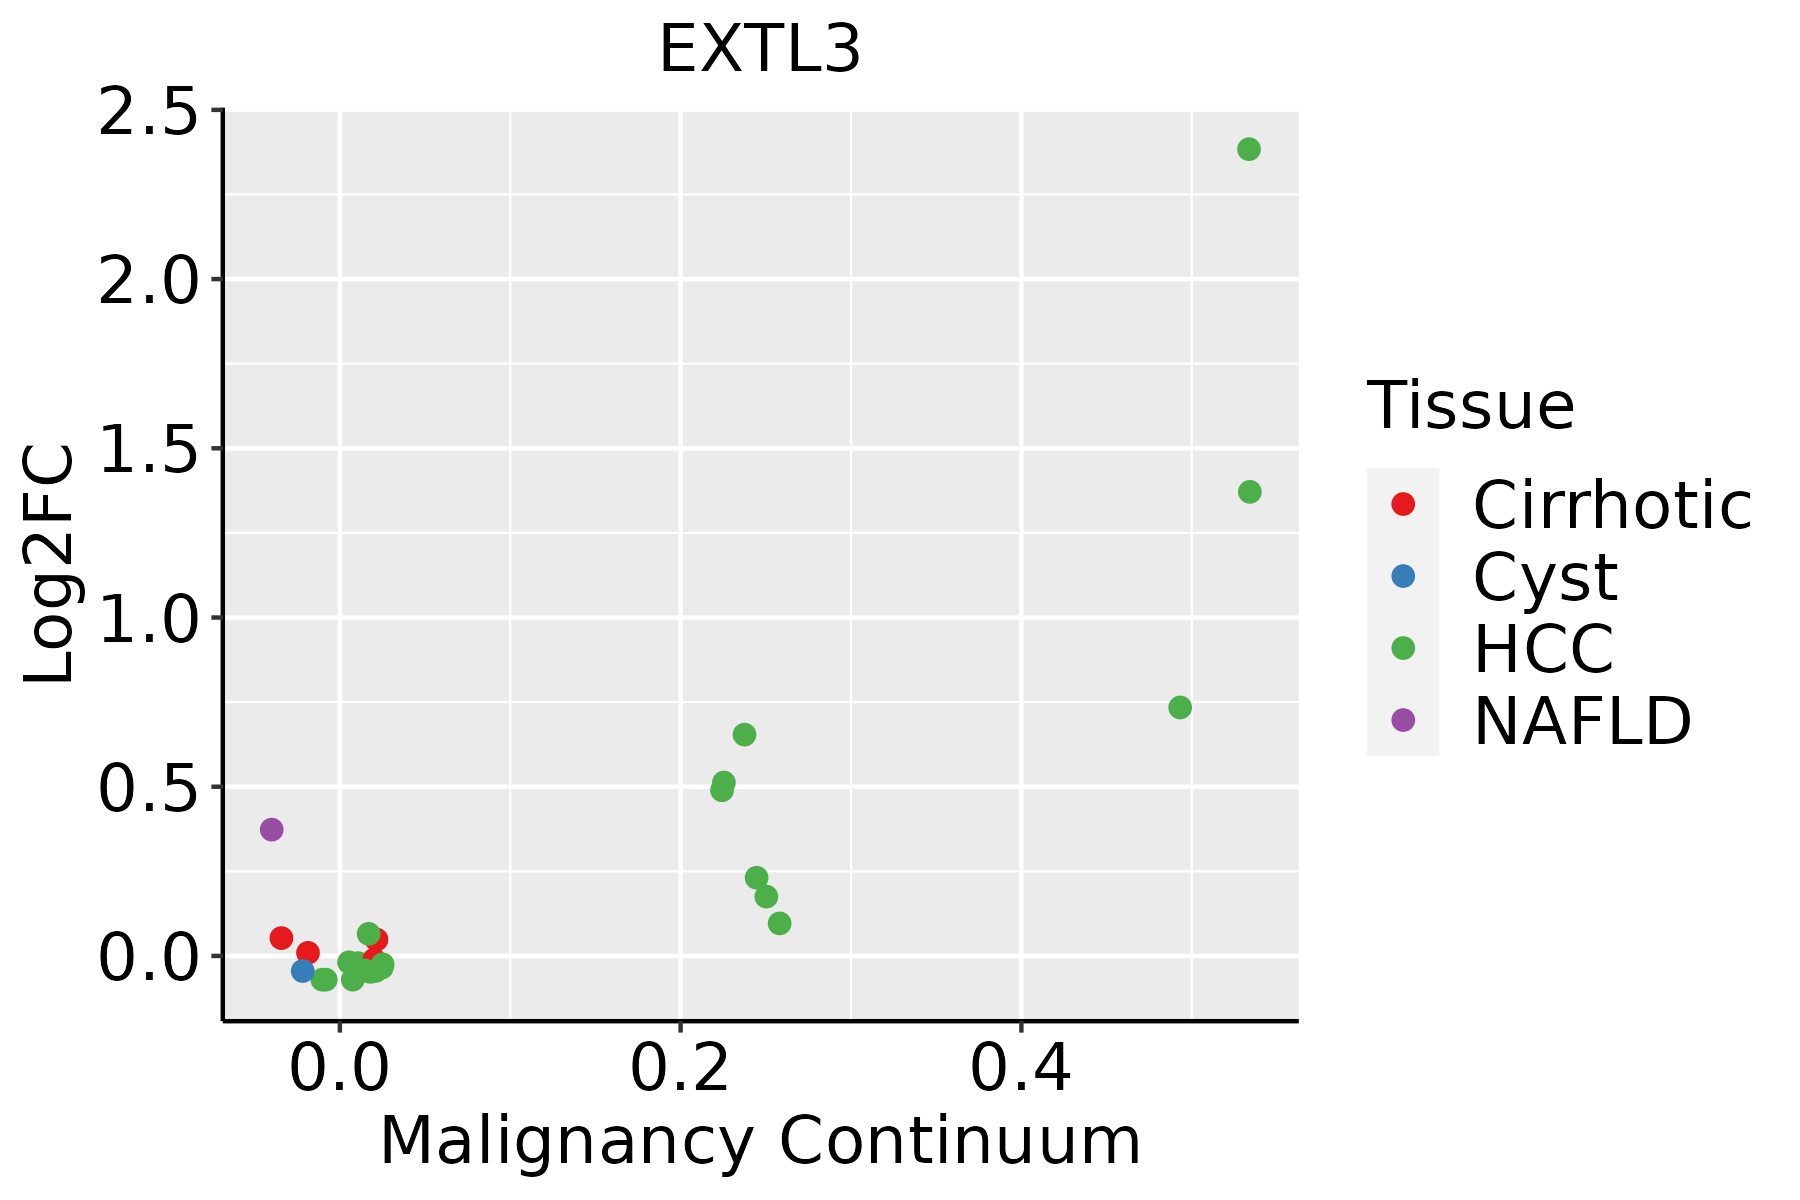 | HCC: Hepatocellular carcinoma |
| NAFLD: Non-alcoholic fatty liver disease | ||
| Oral Cavity |  | EOLP: Erosive Oral lichen planus |
| LP: leukoplakia | ||
| NEOLP: Non-erosive oral lichen planus | ||
| OSCC: Oral squamous cell carcinoma |
| ∗log2FC in expression of this searched gene in stem-like cells from each diseased tissue sample relative to stem-like cells in normal samples in each tissue plotted against the malignancy continuum. Samples are colored based on if they are from different disease stage. |
Top |
Malignant transformation related pathway analysis |
| Find out the enriched GO biological processes and KEGG pathways involved in transition from healthy to precancer to cancer |
| Tissue | Disease Stage | Enriched GO biological Processes |
| Colorectum | AD |  |
| Colorectum | SER |  |
| Colorectum | MSS |  |
| Colorectum | MSI-H |  |
| Colorectum | FAP |  |
| ∗Top 15 enriched GO BP terms are showed in the bar plot of each disease state in each tissue. Each row represents a significant GO biological process which is colored according to the -log10(p.adjust). |
| Page: 1 2 3 4 5 6 7 8 9 |
| GO ID | Tissue | Disease Stage | Description | Gene Ratio | Bg Ratio | pvalue | p.adjust | Count |
| GO:0016049110 | Esophagus | ESCC | cell growth | 289/8552 | 482/18723 | 1.29e-10 | 3.77e-09 | 289 |
| GO:000155819 | Esophagus | ESCC | regulation of cell growth | 248/8552 | 414/18723 | 2.97e-09 | 6.45e-08 | 248 |
| GO:00091002 | Esophagus | ESCC | glycoprotein metabolic process | 226/8552 | 387/18723 | 2.64e-07 | 3.94e-06 | 226 |
| GO:00700854 | Esophagus | ESCC | glycosylation | 144/8552 | 240/18723 | 5.12e-06 | 5.38e-05 | 144 |
| GO:00064865 | Esophagus | ESCC | protein glycosylation | 135/8552 | 226/18723 | 1.36e-05 | 1.24e-04 | 135 |
| GO:00434135 | Esophagus | ESCC | macromolecule glycosylation | 135/8552 | 226/18723 | 1.36e-05 | 1.24e-04 | 135 |
| GO:00091012 | Esophagus | ESCC | glycoprotein biosynthetic process | 181/8552 | 317/18723 | 2.54e-05 | 2.15e-04 | 181 |
| GO:003030710 | Esophagus | ESCC | positive regulation of cell growth | 100/8552 | 166/18723 | 1.07e-04 | 7.55e-04 | 100 |
| GO:0006029 | Esophagus | ESCC | proteoglycan metabolic process | 48/8552 | 79/18723 | 4.93e-03 | 1.89e-02 | 48 |
| GO:0030166 | Esophagus | ESCC | proteoglycan biosynthetic process | 35/8552 | 56/18723 | 8.30e-03 | 2.94e-02 | 35 |
| GO:0030201 | Esophagus | ESCC | heparan sulfate proteoglycan metabolic process | 21/8552 | 31/18723 | 1.10e-02 | 3.70e-02 | 21 |
| GO:004592717 | Esophagus | ESCC | positive regulation of growth | 137/8552 | 259/18723 | 1.13e-02 | 3.80e-02 | 137 |
| GO:001604921 | Liver | HCC | cell growth | 269/7958 | 482/18723 | 1.84e-09 | 5.35e-08 | 269 |
| GO:000155821 | Liver | HCC | regulation of cell growth | 228/7958 | 414/18723 | 1.34e-07 | 2.55e-06 | 228 |
| GO:00064862 | Liver | HCC | protein glycosylation | 122/7958 | 226/18723 | 3.11e-04 | 2.21e-03 | 122 |
| GO:00434132 | Liver | HCC | macromolecule glycosylation | 122/7958 | 226/18723 | 3.11e-04 | 2.21e-03 | 122 |
| GO:00700852 | Liver | HCC | glycosylation | 128/7958 | 240/18723 | 4.35e-04 | 2.92e-03 | 128 |
| GO:0009100 | Liver | HCC | glycoprotein metabolic process | 193/7958 | 387/18723 | 1.89e-03 | 9.62e-03 | 193 |
| GO:003030711 | Liver | HCC | positive regulation of cell growth | 88/7958 | 166/18723 | 3.95e-03 | 1.74e-02 | 88 |
| GO:004592711 | Liver | HCC | positive regulation of growth | 128/7958 | 259/18723 | 1.41e-02 | 4.99e-02 | 128 |
| Page: 1 2 |
| Pathway ID | Tissue | Disease Stage | Description | Gene Ratio | Bg Ratio | pvalue | p.adjust | qvalue | Count |
| Page: 1 |
Top |
Cell-cell communication analysis |
| Identification of potential cell-cell interactions between two cell types and their ligand-receptor pairs for different disease states |
| Ligand | Receptor | LRpair | Pathway | Tissue | Disease Stage |
| Page: 1 |
Top |
Single-cell gene regulatory network inference analysis |
| Find out the significant the regulons (TFs) and the target genes of each regulon across cell types for different disease states |
| TF | Cell Type | Tissue | Disease Stage | Target Gene | RSS | Regulon Activity |
| ∗The dot plots of a searched regulon are shown for all cell subpopulations in each disease state of each tissue based on the regulon specific score inferred using pySCENIC and by calculating the average expression. |
| Page: 1 |
Top |
Somatic mutation of malignant transformation related genes |
| Annotation of somatic variants for genes involved in malignant transformation |
| Hugo Symbol | Variant Class | Variant Classification | dbSNP RS | HGVSc | HGVSp | HGVSp Short | SWISSPROT | BIOTYPE | SIFT | PolyPhen | Tumor Sample Barcode | Tissue | Histology | Sex | Age | Stage | Therapy Types | Drugs | Outcome |
| EXTL3 | SNV | Missense_Mutation | c.2146N>G | p.Met716Val | p.M716V | O43909 | protein_coding | tolerated(0.38) | benign(0) | TCGA-A8-A08L-01 | Breast | breast invasive carcinoma | Female | >=65 | III/IV | Unknown | Unknown | SD | |
| EXTL3 | SNV | Missense_Mutation | c.1054N>A | p.Ser352Thr | p.S352T | O43909 | protein_coding | tolerated(0.42) | benign(0.09) | TCGA-A8-A08P-01 | Breast | breast invasive carcinoma | Female | >=65 | III/IV | Chemotherapy | 5-fluorouracil | CR | |
| EXTL3 | SNV | Missense_Mutation | rs747658857 | c.82C>T | p.Arg28Cys | p.R28C | O43909 | protein_coding | deleterious(0.01) | probably_damaging(0.948) | TCGA-A8-A09A-01 | Breast | breast invasive carcinoma | Female | <65 | I/II | Hormone Therapy | tamoxiphen | SD |
| EXTL3 | SNV | Missense_Mutation | c.2362N>G | p.Asn788Asp | p.N788D | O43909 | protein_coding | deleterious(0.01) | possibly_damaging(0.566) | TCGA-A8-A09Z-01 | Breast | breast invasive carcinoma | Female | >=65 | I/II | Unknown | Unknown | SD | |
| EXTL3 | SNV | Missense_Mutation | rs777463050 | c.1090N>A | p.Glu364Lys | p.E364K | O43909 | protein_coding | tolerated(0.85) | possibly_damaging(0.771) | TCGA-AN-A046-01 | Breast | breast invasive carcinoma | Female | >=65 | I/II | Unknown | Unknown | SD |
| EXTL3 | SNV | Missense_Mutation | novel | c.2349G>C | p.Gln783His | p.Q783H | O43909 | protein_coding | tolerated(0.14) | benign(0.012) | TCGA-AN-A0AK-01 | Breast | breast invasive carcinoma | Female | >=65 | I/II | Unknown | Unknown | SD |
| EXTL3 | SNV | Missense_Mutation | c.2380N>C | p.Glu794Gln | p.E794Q | O43909 | protein_coding | deleterious(0) | possibly_damaging(0.649) | TCGA-E2-A15T-01 | Breast | breast invasive carcinoma | Female | >=65 | I/II | Hormone Therapy | arimidex | SD | |
| EXTL3 | SNV | Missense_Mutation | novel | c.1334N>A | p.Ser445Tyr | p.S445Y | O43909 | protein_coding | tolerated(0.3) | benign(0.116) | TCGA-2W-A8YY-01 | Cervix | cervical & endocervical cancer | Female | <65 | I/II | Chemotherapy | cisplatin | CR |
| EXTL3 | SNV | Missense_Mutation | c.1874N>T | p.Ser625Leu | p.S625L | O43909 | protein_coding | deleterious(0) | probably_damaging(0.962) | TCGA-C5-A3HE-01 | Cervix | cervical & endocervical cancer | Female | <65 | I/II | Unknown | Unknown | PD | |
| EXTL3 | SNV | Missense_Mutation | novel | c.703G>A | p.Ala235Thr | p.A235T | O43909 | protein_coding | deleterious(0) | probably_damaging(1) | TCGA-EA-A410-01 | Cervix | cervical & endocervical cancer | Female | <65 | I/II | Unknown | Unknown | SD |
| Page: 1 2 3 4 5 6 7 8 9 10 11 12 |
Top |
Related drugs of malignant transformation related genes |
| Identification of chemicals and drugs interact with genes involved in malignant transfromation |
| (DGIdb 4.0) |
| Entrez ID | Symbol | Category | Interaction Types | Drug Claim Name | Drug Name | PMIDs |
| Page: 1 |

Copyright 2023-Present -The University of Texas Health Science Center at Houston |