
|
|||||
|
 | |
| |
| |
| |
| |
| |
|
Gene: EXTL2 |
Gene summary for EXTL2 |
| Gene information | Species | Human | Gene symbol | EXTL2 | Gene ID | 2135 |
| Gene name | exostosin like glycosyltransferase 2 | |
| Gene Alias | EXTR2 | |
| Cytomap | 1p21.2 | |
| Gene Type | protein-coding | GO ID | GO:0006029 | UniProtAcc | Q9UBQ6 |
Top |
Malignant transformation analysis |
| Identification of the aberrant gene expression in precancerous and cancerous lesions by comparing the gene expression of stem-like cells in diseased tissues with normal stem cells |
| Entrez ID | Symbol | Replicates | Species | Organ | Tissue | Adj P-value | Log2FC | Malignancy |
| 2135 | EXTL2 | LZE7T | Human | Esophagus | ESCC | 1.47e-05 | 2.93e-01 | 0.0667 |
| 2135 | EXTL2 | P1T-E | Human | Esophagus | ESCC | 2.86e-04 | 1.99e-01 | 0.0875 |
| 2135 | EXTL2 | P2T-E | Human | Esophagus | ESCC | 7.37e-16 | 3.47e-01 | 0.1177 |
| 2135 | EXTL2 | P4T-E | Human | Esophagus | ESCC | 8.39e-09 | 2.50e-01 | 0.1323 |
| 2135 | EXTL2 | P5T-E | Human | Esophagus | ESCC | 1.77e-06 | 7.84e-02 | 0.1327 |
| 2135 | EXTL2 | P8T-E | Human | Esophagus | ESCC | 3.28e-16 | 2.56e-01 | 0.0889 |
| 2135 | EXTL2 | P9T-E | Human | Esophagus | ESCC | 2.32e-08 | 1.34e-01 | 0.1131 |
| 2135 | EXTL2 | P10T-E | Human | Esophagus | ESCC | 3.47e-36 | 6.14e-01 | 0.116 |
| 2135 | EXTL2 | P11T-E | Human | Esophagus | ESCC | 6.28e-08 | 3.21e-01 | 0.1426 |
| 2135 | EXTL2 | P12T-E | Human | Esophagus | ESCC | 2.44e-24 | 4.60e-01 | 0.1122 |
| 2135 | EXTL2 | P15T-E | Human | Esophagus | ESCC | 2.12e-03 | 1.22e-01 | 0.1149 |
| 2135 | EXTL2 | P16T-E | Human | Esophagus | ESCC | 1.99e-20 | 2.34e-01 | 0.1153 |
| 2135 | EXTL2 | P20T-E | Human | Esophagus | ESCC | 4.44e-13 | 2.43e-01 | 0.1124 |
| 2135 | EXTL2 | P21T-E | Human | Esophagus | ESCC | 7.43e-12 | 1.19e-01 | 0.1617 |
| 2135 | EXTL2 | P22T-E | Human | Esophagus | ESCC | 4.69e-09 | 1.07e-01 | 0.1236 |
| 2135 | EXTL2 | P23T-E | Human | Esophagus | ESCC | 3.21e-12 | 2.82e-01 | 0.108 |
| 2135 | EXTL2 | P24T-E | Human | Esophagus | ESCC | 3.33e-08 | 1.31e-01 | 0.1287 |
| 2135 | EXTL2 | P26T-E | Human | Esophagus | ESCC | 1.53e-23 | 2.57e-01 | 0.1276 |
| 2135 | EXTL2 | P27T-E | Human | Esophagus | ESCC | 3.34e-17 | 1.74e-01 | 0.1055 |
| 2135 | EXTL2 | P28T-E | Human | Esophagus | ESCC | 2.15e-07 | 1.29e-01 | 0.1149 |
| Page: 1 2 3 4 |
| Tissue | Expression Dynamics | Abbreviation |
| Esophagus |  | ESCC: Esophageal squamous cell carcinoma |
| HGIN: High-grade intraepithelial neoplasias | ||
| LGIN: Low-grade intraepithelial neoplasias | ||
| Oral Cavity | 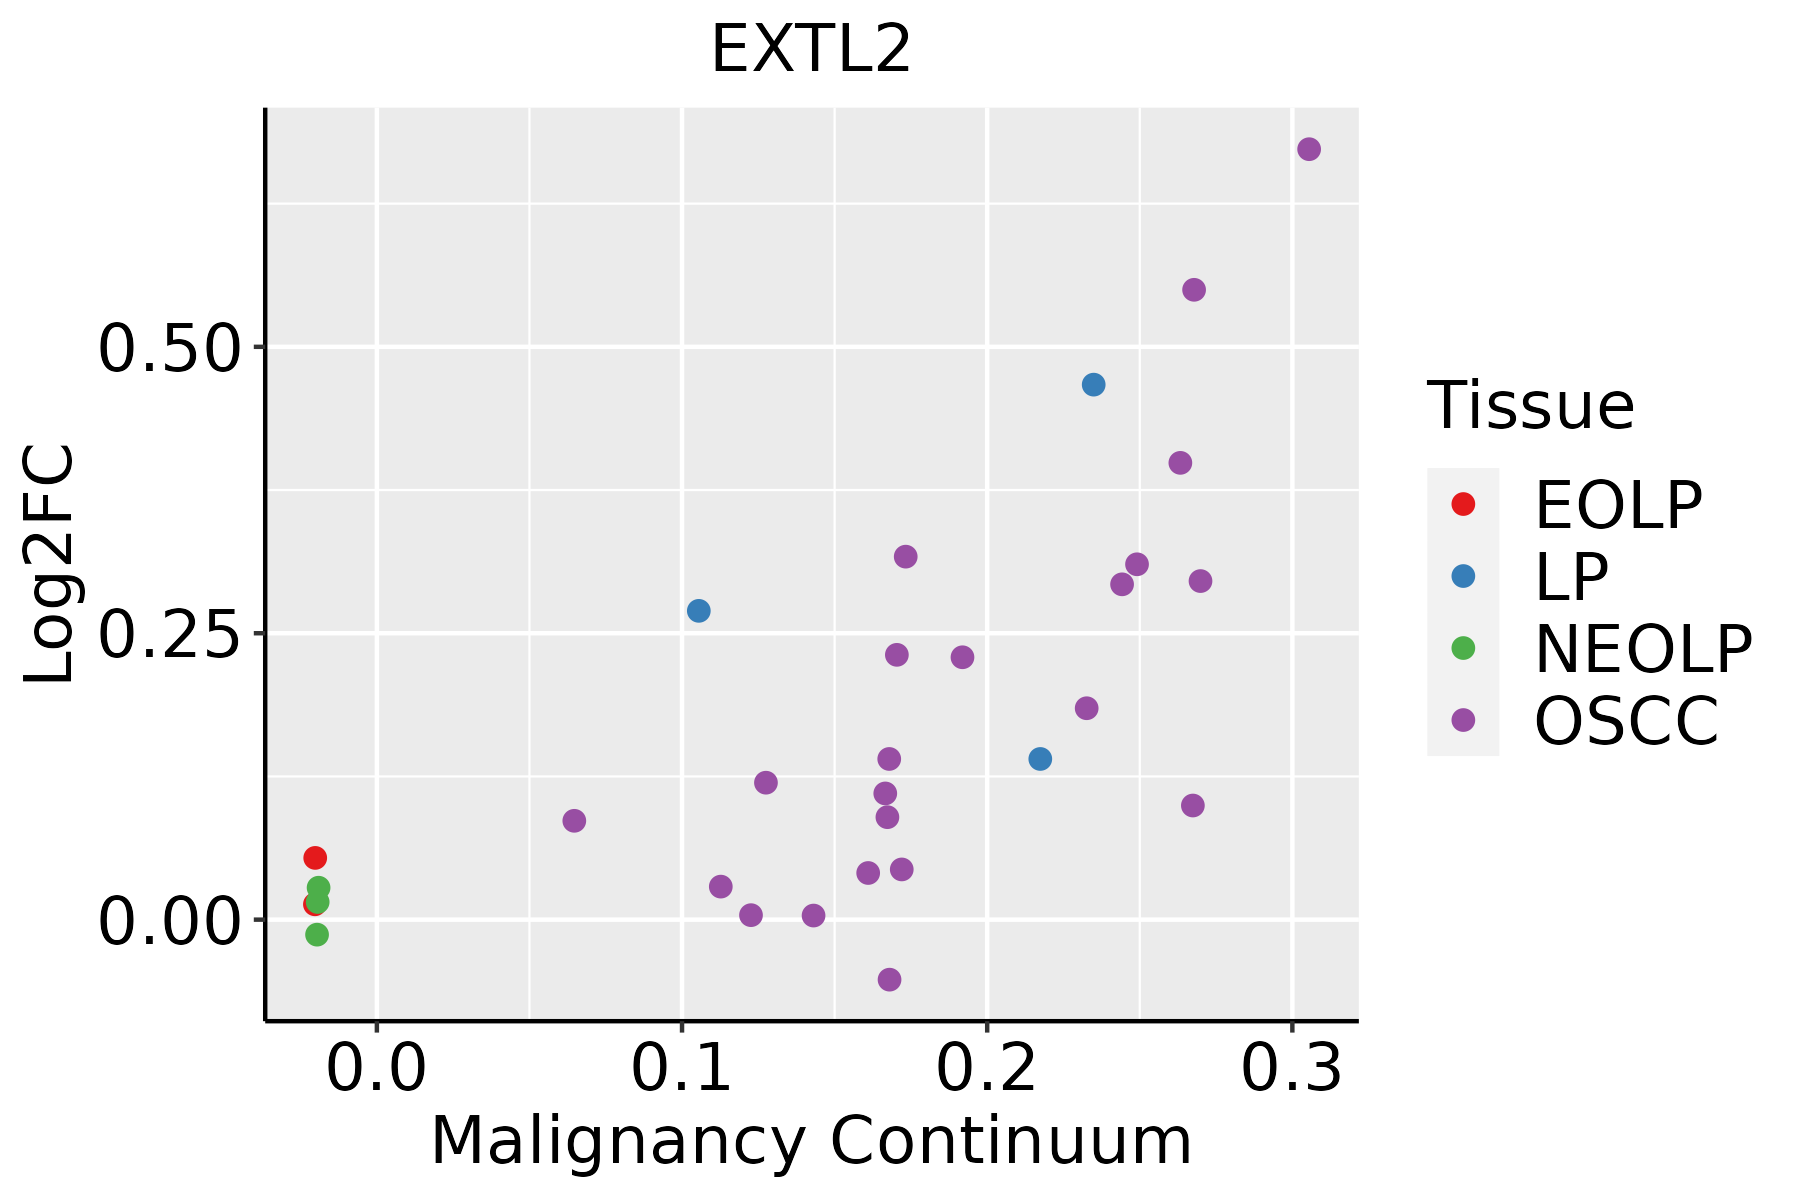 | EOLP: Erosive Oral lichen planus |
| LP: leukoplakia | ||
| NEOLP: Non-erosive oral lichen planus | ||
| OSCC: Oral squamous cell carcinoma | ||
| Thyroid | 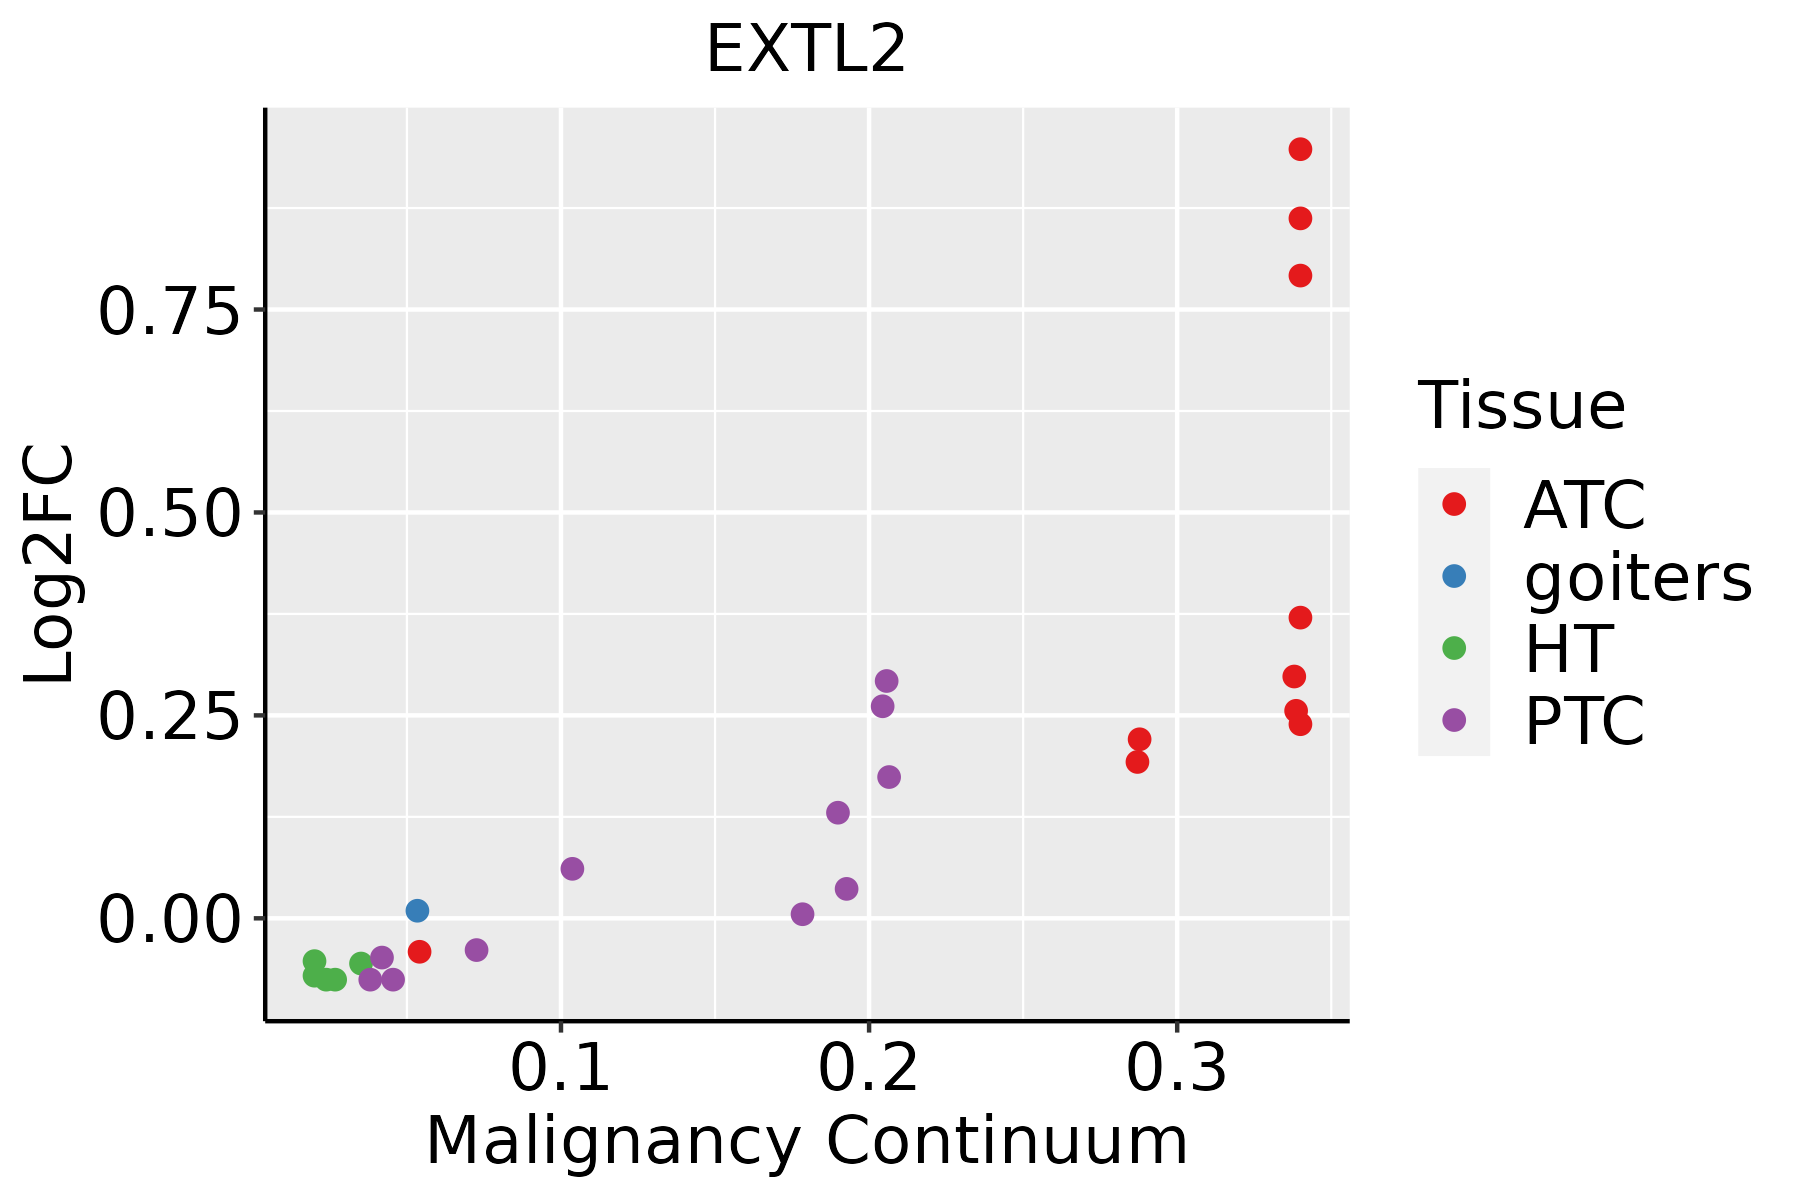 | ATC: Anaplastic thyroid cancer |
| HT: Hashimoto's thyroiditis | ||
| PTC: Papillary thyroid cancer |
| ∗log2FC in expression of this searched gene in stem-like cells from each diseased tissue sample relative to stem-like cells in normal samples in each tissue plotted against the malignancy continuum. Samples are colored based on if they are from different disease stage. |
Top |
Malignant transformation related pathway analysis |
| Find out the enriched GO biological processes and KEGG pathways involved in transition from healthy to precancer to cancer |
| Tissue | Disease Stage | Enriched GO biological Processes |
| Colorectum | AD |  |
| Colorectum | SER |  |
| Colorectum | MSS |  |
| Colorectum | MSI-H |  |
| Colorectum | FAP |  |
| ∗Top 15 enriched GO BP terms are showed in the bar plot of each disease state in each tissue. Each row represents a significant GO biological process which is colored according to the -log10(p.adjust). |
| Page: 1 2 3 4 5 6 7 8 9 |
| GO ID | Tissue | Disease Stage | Description | Gene Ratio | Bg Ratio | pvalue | p.adjust | Count |
| GO:00091002 | Esophagus | ESCC | glycoprotein metabolic process | 226/8552 | 387/18723 | 2.64e-07 | 3.94e-06 | 226 |
| GO:00700854 | Esophagus | ESCC | glycosylation | 144/8552 | 240/18723 | 5.12e-06 | 5.38e-05 | 144 |
| GO:00064865 | Esophagus | ESCC | protein glycosylation | 135/8552 | 226/18723 | 1.36e-05 | 1.24e-04 | 135 |
| GO:00434135 | Esophagus | ESCC | macromolecule glycosylation | 135/8552 | 226/18723 | 1.36e-05 | 1.24e-04 | 135 |
| GO:00092256 | Esophagus | ESCC | nucleotide-sugar metabolic process | 29/8552 | 36/18723 | 1.91e-05 | 1.67e-04 | 29 |
| GO:00091012 | Esophagus | ESCC | glycoprotein biosynthetic process | 181/8552 | 317/18723 | 2.54e-05 | 2.15e-04 | 181 |
| GO:0006029 | Esophagus | ESCC | proteoglycan metabolic process | 48/8552 | 79/18723 | 4.93e-03 | 1.89e-02 | 48 |
| GO:0030166 | Esophagus | ESCC | proteoglycan biosynthetic process | 35/8552 | 56/18723 | 8.30e-03 | 2.94e-02 | 35 |
| GO:0030201 | Esophagus | ESCC | heparan sulfate proteoglycan metabolic process | 21/8552 | 31/18723 | 1.10e-02 | 3.70e-02 | 21 |
| GO:00092255 | Oral cavity | OSCC | nucleotide-sugar metabolic process | 26/7305 | 36/18723 | 5.44e-05 | 4.51e-04 | 26 |
| GO:00091001 | Oral cavity | OSCC | glycoprotein metabolic process | 185/7305 | 387/18723 | 2.37e-04 | 1.54e-03 | 185 |
| GO:00091011 | Oral cavity | OSCC | glycoprotein biosynthetic process | 151/7305 | 317/18723 | 1.01e-03 | 5.26e-03 | 151 |
| GO:00064864 | Oral cavity | OSCC | protein glycosylation | 111/7305 | 226/18723 | 1.22e-03 | 6.10e-03 | 111 |
| GO:00434134 | Oral cavity | OSCC | macromolecule glycosylation | 111/7305 | 226/18723 | 1.22e-03 | 6.10e-03 | 111 |
| GO:00700853 | Oral cavity | OSCC | glycosylation | 117/7305 | 240/18723 | 1.29e-03 | 6.42e-03 | 117 |
| GO:0006040 | Oral cavity | OSCC | amino sugar metabolic process | 24/7305 | 42/18723 | 1.30e-02 | 4.34e-02 | 24 |
| GO:00092257 | Thyroid | PTC | nucleotide-sugar metabolic process | 23/5968 | 36/18723 | 7.78e-05 | 6.66e-04 | 23 |
| GO:00064866 | Thyroid | PTC | protein glycosylation | 94/5968 | 226/18723 | 1.25e-03 | 7.13e-03 | 94 |
| GO:00434136 | Thyroid | PTC | macromolecule glycosylation | 94/5968 | 226/18723 | 1.25e-03 | 7.13e-03 | 94 |
| GO:00700855 | Thyroid | PTC | glycosylation | 96/5968 | 240/18723 | 4.57e-03 | 2.15e-02 | 96 |
| Page: 1 2 |
| Pathway ID | Tissue | Disease Stage | Description | Gene Ratio | Bg Ratio | pvalue | p.adjust | qvalue | Count |
| Page: 1 |
Top |
Cell-cell communication analysis |
| Identification of potential cell-cell interactions between two cell types and their ligand-receptor pairs for different disease states |
| Ligand | Receptor | LRpair | Pathway | Tissue | Disease Stage |
| Page: 1 |
Top |
Single-cell gene regulatory network inference analysis |
| Find out the significant the regulons (TFs) and the target genes of each regulon across cell types for different disease states |
| TF | Cell Type | Tissue | Disease Stage | Target Gene | RSS | Regulon Activity |
| ∗The dot plots of a searched regulon are shown for all cell subpopulations in each disease state of each tissue based on the regulon specific score inferred using pySCENIC and by calculating the average expression. |
| Page: 1 |
Top |
Somatic mutation of malignant transformation related genes |
| Annotation of somatic variants for genes involved in malignant transformation |
| Hugo Symbol | Variant Class | Variant Classification | dbSNP RS | HGVSc | HGVSp | HGVSp Short | SWISSPROT | BIOTYPE | SIFT | PolyPhen | Tumor Sample Barcode | Tissue | Histology | Sex | Age | Stage | Therapy Types | Drugs | Outcome |
| EXTL2 | insertion | Frame_Shift_Ins | novel | c.56_57insGGAG | p.Arg20GlufsTer26 | p.R20Efs*26 | Q9UBQ6 | protein_coding | TCGA-AR-A0TU-01 | Breast | breast invasive carcinoma | Female | <65 | I/II | Unspecific | Doxorubicin | SD | ||
| EXTL2 | SNV | Missense_Mutation | novel | c.369N>G | p.Phe123Leu | p.F123L | Q9UBQ6 | protein_coding | tolerated(0.11) | benign(0.217) | TCGA-C5-A8XJ-01 | Cervix | cervical & endocervical cancer | Female | >=65 | I/II | Chemotherapy | cisplatin | SD |
| EXTL2 | SNV | Missense_Mutation | c.166A>C | p.Lys56Gln | p.K56Q | Q9UBQ6 | protein_coding | tolerated(0.38) | benign(0.198) | TCGA-AA-3977-01 | Colorectum | colon adenocarcinoma | Male | >=65 | I/II | Unknown | Unknown | SD | |
| EXTL2 | SNV | Missense_Mutation | novel | c.338N>A | p.Ser113Tyr | p.S113Y | Q9UBQ6 | protein_coding | deleterious(0.04) | possibly_damaging(0.681) | TCGA-AA-3984-01 | Colorectum | colon adenocarcinoma | Female | <65 | I/II | Unknown | Unknown | SD |
| EXTL2 | SNV | Missense_Mutation | c.350N>G | p.His117Arg | p.H117R | Q9UBQ6 | protein_coding | tolerated(0.21) | probably_damaging(0.966) | TCGA-AA-A01R-01 | Colorectum | colon adenocarcinoma | Male | <65 | III/IV | Chemotherapy | 5-fluorouracil | PD | |
| EXTL2 | SNV | Missense_Mutation | c.749N>G | p.Phe250Cys | p.F250C | Q9UBQ6 | protein_coding | deleterious(0) | probably_damaging(0.997) | TCGA-CA-6717-01 | Colorectum | colon adenocarcinoma | Male | <65 | I/II | Chemotherapy | oxaliplatin | CR | |
| EXTL2 | SNV | Missense_Mutation | c.224G>C | p.Arg75Thr | p.R75T | Q9UBQ6 | protein_coding | deleterious(0) | probably_damaging(0.998) | TCGA-AF-3913-01 | Colorectum | rectum adenocarcinoma | Male | <65 | III/IV | Chemotherapy | xeloda | PD | |
| EXTL2 | SNV | Missense_Mutation | novel | c.232C>A | p.Leu78Ile | p.L78I | Q9UBQ6 | protein_coding | tolerated(0.64) | benign(0.201) | TCGA-AG-A002-01 | Colorectum | rectum adenocarcinoma | Male | <65 | I/II | Unknown | Unknown | SD |
| EXTL2 | SNV | Missense_Mutation | novel | c.88T>G | p.Leu30Val | p.L30V | Q9UBQ6 | protein_coding | deleterious_low_confidence(0.05) | probably_damaging(0.991) | TCGA-AG-A002-01 | Colorectum | rectum adenocarcinoma | Male | <65 | I/II | Unknown | Unknown | SD |
| EXTL2 | deletion | Frame_Shift_Del | c.486delN | p.Phe162LeufsTer14 | p.F162Lfs*14 | Q9UBQ6 | protein_coding | TCGA-CK-6746-01 | Colorectum | colon adenocarcinoma | Female | >=65 | I/II | Unknown | Unknown | SD |
| Page: 1 2 3 4 5 |
Top |
Related drugs of malignant transformation related genes |
| Identification of chemicals and drugs interact with genes involved in malignant transfromation |
| (DGIdb 4.0) |
| Entrez ID | Symbol | Category | Interaction Types | Drug Claim Name | Drug Name | PMIDs |
| Page: 1 |

Copyright 2023-Present -The University of Texas Health Science Center at Houston |