Schematic overview of the cellular and molecular mechanisms involved in the cancer progression, including the proposed cellular and molecular mechanisms in cancer cells trajectory. AT1: alveolar type 1 cells; AT2: alveolar type 2 cells; AAH: atypical adenomatous hyperplasia; AIS: adenocarcinoma in situ; MIA: minimally invasive adenocarcinoma; IA: invasive adenocarcinoma; EMT: epithelial-mesenchymal transition

Home

Download

Statistics

Help

Contact

Center for Computational Systems Medicine
leaf

Gene summary

leaf

Malignant transformation analysis

leaf

Malignant transformation related pathway analysis

leaf

Cell-cell communication analysis

leaf

Single-cell gene regulatory network inference analysis

leaf

Somatic mutation of malignant transformation related genes

leaf

Related drugs of malignant transformation related genes

Gene: EXPH5

Gene summary for EXPH5

check button Gene summary.

Gene informationSpeciesHuman
Gene symbol

EXPH5

Gene ID

23086

Gene nameexophilin 5
Gene AliasSLAC2-B
Cytomap11q22.3
Gene Typeprotein-coding
GO ID

GO:0002064

UniProtAcc

Q149M6


Top

Malignant transformation analysis

check button Identification of the aberrant gene expression in precancerous and cancerous lesions by comparing the gene expression of stem-like cells in diseased tissues with normal stem cells
check button Malignant transformation involving gene list.
Entrez IDSymbolReplicatesSpeciesOrganTissueAdj P-valueLog2FCMalignancy
23086EXPH5HTA11_347_2000001011HumanColorectumAD4.08e-291.10e+00-0.1954
23086EXPH5HTA11_411_2000001011HumanColorectumSER5.94e-071.15e+00-0.2602
23086EXPH5HTA11_866_2000001011HumanColorectumAD7.01e-034.24e-01-0.1001
23086EXPH5HTA11_99999974143_84620HumanColorectumMSS8.62e-15-4.93e-010.3005
23086EXPH5A015-C-203HumanColorectumFAP1.73e-162.39e-02-0.1294
23086EXPH5A002-C-201HumanColorectumFAP2.35e-05-1.05e-010.0324
23086EXPH5A001-C-119HumanColorectumFAP1.52e-031.24e-01-0.1557
23086EXPH5A001-C-108HumanColorectumFAP2.04e-113.03e-01-0.0272
23086EXPH5A002-C-205HumanColorectumFAP3.85e-148.96e-02-0.1236
23086EXPH5A015-C-006HumanColorectumFAP5.49e-07-2.35e-01-0.0994
23086EXPH5A015-C-106HumanColorectumFAP2.37e-064.44e-02-0.0511
23086EXPH5A002-C-114HumanColorectumFAP8.54e-09-1.08e-01-0.1561
23086EXPH5A015-C-104HumanColorectumFAP2.53e-172.14e-02-0.1899
23086EXPH5A001-C-014HumanColorectumFAP5.17e-091.24e-010.0135
23086EXPH5A002-C-016HumanColorectumFAP1.21e-11-1.10e-010.0521
23086EXPH5A015-C-002HumanColorectumFAP9.82e-05-7.77e-02-0.0763
23086EXPH5A001-C-203HumanColorectumFAP8.10e-037.38e-02-0.0481
23086EXPH5A002-C-116HumanColorectumFAP4.91e-22-1.52e-01-0.0452
23086EXPH5A014-C-008HumanColorectumFAP1.95e-102.33e-01-0.191
23086EXPH5A018-E-020HumanColorectumFAP1.14e-102.93e-02-0.2034
Page: 1 2 3 4 5 

check button Transcriptomic changes along malignancy continuum.
TissueExpression DynamicsAbbreviation
Colorectum (GSE201348)The image shows the transcriptomic changes along malignancy continuum.log2FC in expression of this searched gene in stem-like cells from each diseased tissue sample relative to stem-like cells in normal samples in each tissue plotted against the malignancy continuum. Samples are colored based on if they are from different disease stage.FAP: Familial adenomatous polyposis
CRC: Colorectal cancer
Colorectum (HTA11)The image shows the transcriptomic changes along malignancy continuum.log2FC in expression of this searched gene in stem-like cells from each diseased tissue sample relative to stem-like cells in normal samples in each tissue plotted against the malignancy continuum. Samples are colored based on if they are from different disease stage.AD: Adenomas
SER: Sessile serrated lesions
MSI-H: Microsatellite-high colorectal cancer
MSS: Microsatellite stable colorectal cancer
EsophagusThe image shows the transcriptomic changes along malignancy continuum.log2FC in expression of this searched gene in stem-like cells from each diseased tissue sample relative to stem-like cells in normal samples in each tissue plotted against the malignancy continuum. Samples are colored based on if they are from different disease stage.ESCC: Esophageal squamous cell carcinoma
HGIN: High-grade intraepithelial neoplasias
LGIN: Low-grade intraepithelial neoplasias
LungThe image shows the transcriptomic changes along malignancy continuum.log2FC in expression of this searched gene in stem-like cells from each diseased tissue sample relative to stem-like cells in normal samples in each tissue plotted against the malignancy continuum. Samples are colored based on if they are from different disease stage.
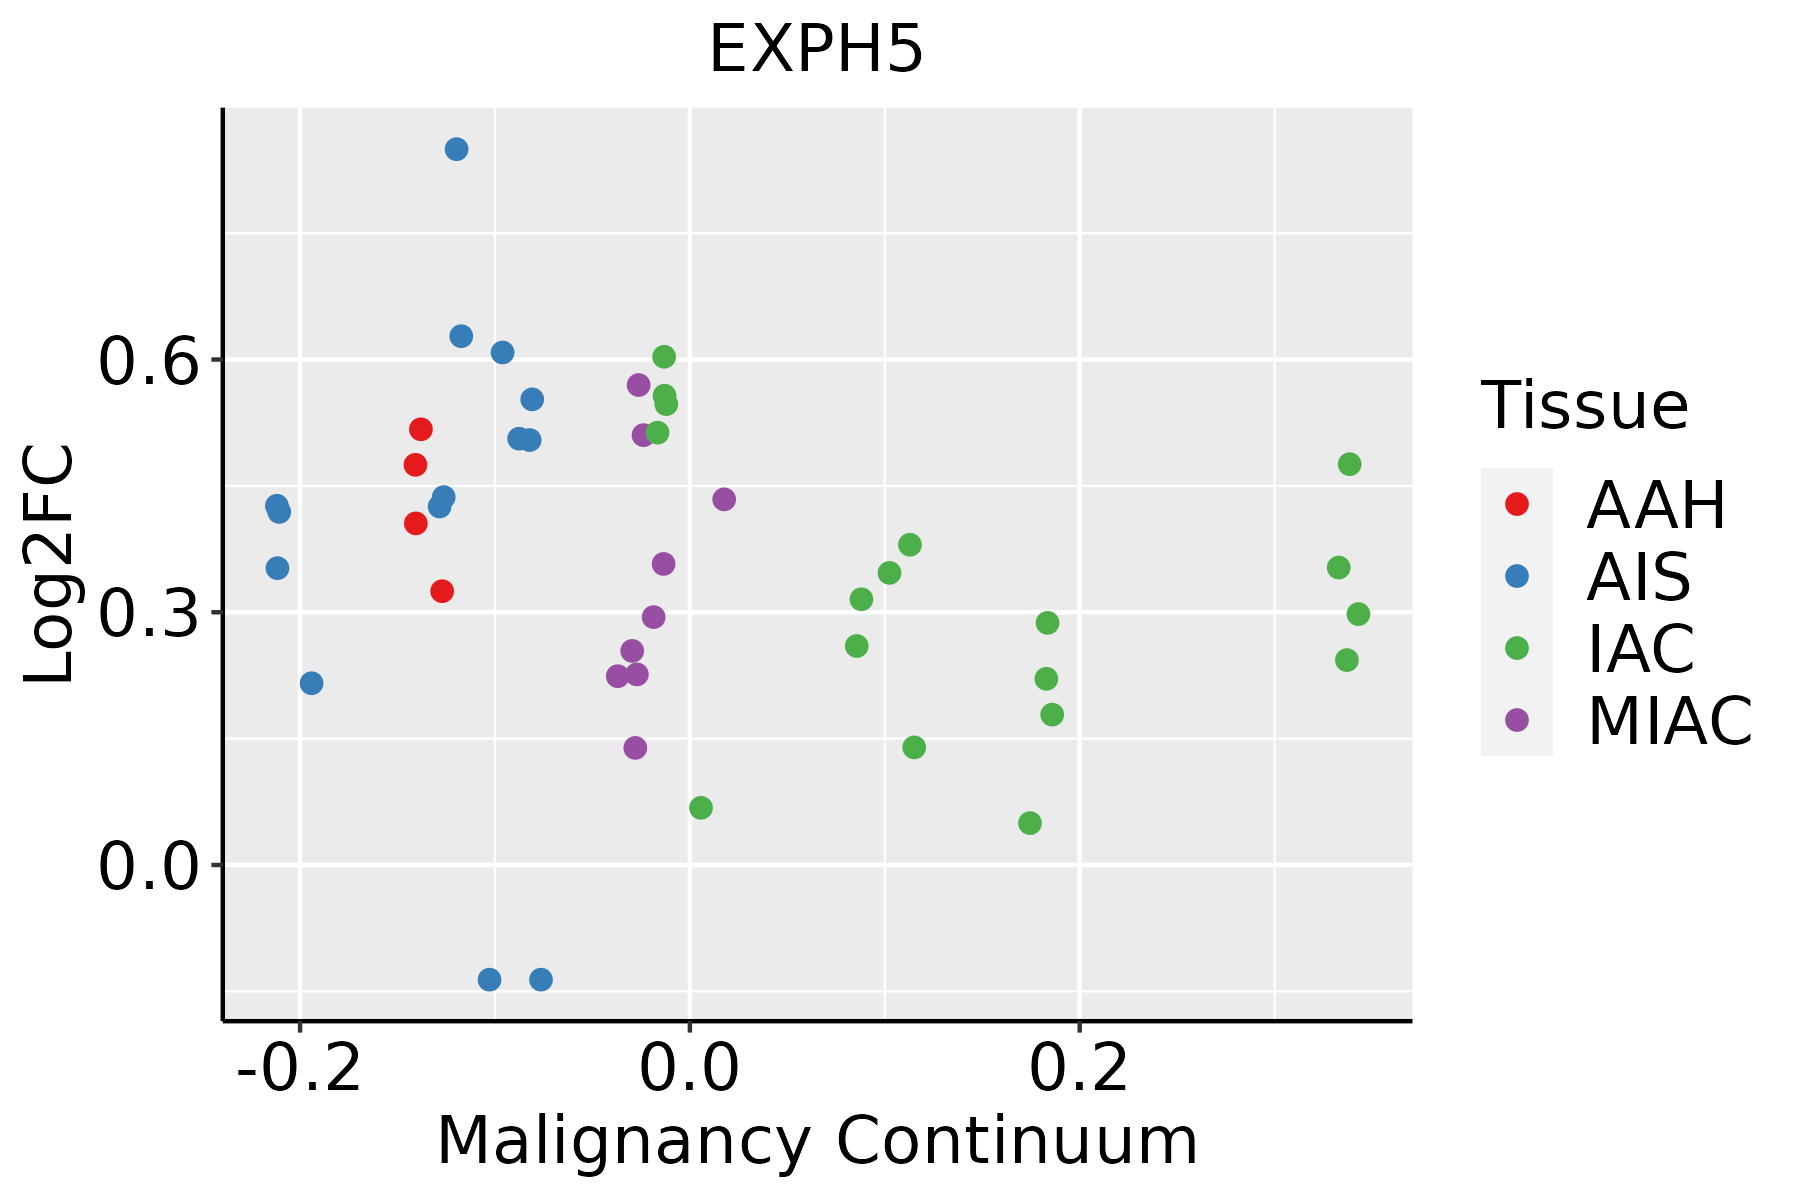
AAH: Atypical adenomatous hyperplasia
AIS: Adenocarcinoma in situ
IAC: Invasive lung adenocarcinoma
MIA: Minimally invasive adenocarcinoma
ProstateThe image shows the transcriptomic changes along malignancy continuum.log2FC in expression of this searched gene in stem-like cells from each diseased tissue sample relative to stem-like cells in normal samples in each tissue plotted against the malignancy continuum. Samples are colored based on if they are from different disease stage.
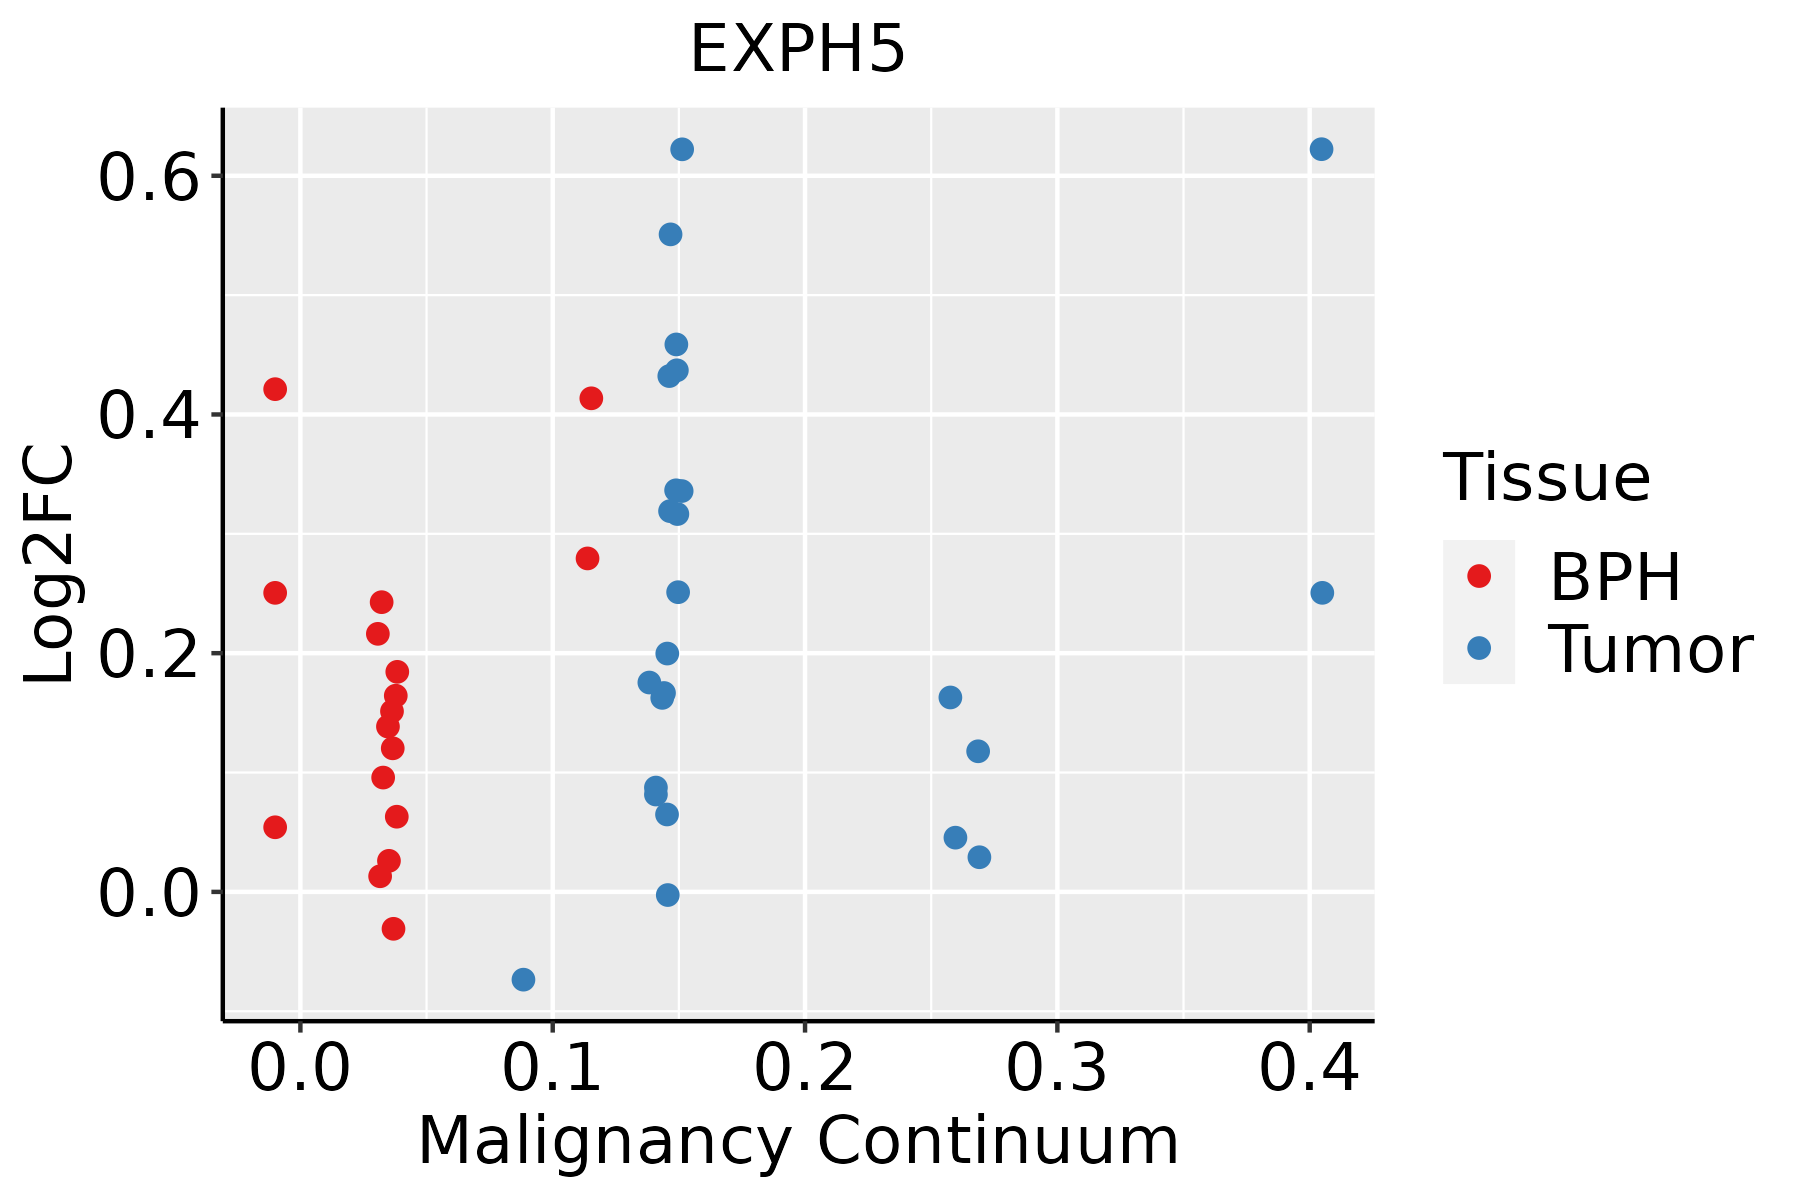
BPH: Benign Prostatic Hyperplasia
SkinThe image shows the transcriptomic changes along malignancy continuum.log2FC in expression of this searched gene in stem-like cells from each diseased tissue sample relative to stem-like cells in normal samples in each tissue plotted against the malignancy continuum. Samples are colored based on if they are from different disease stage.
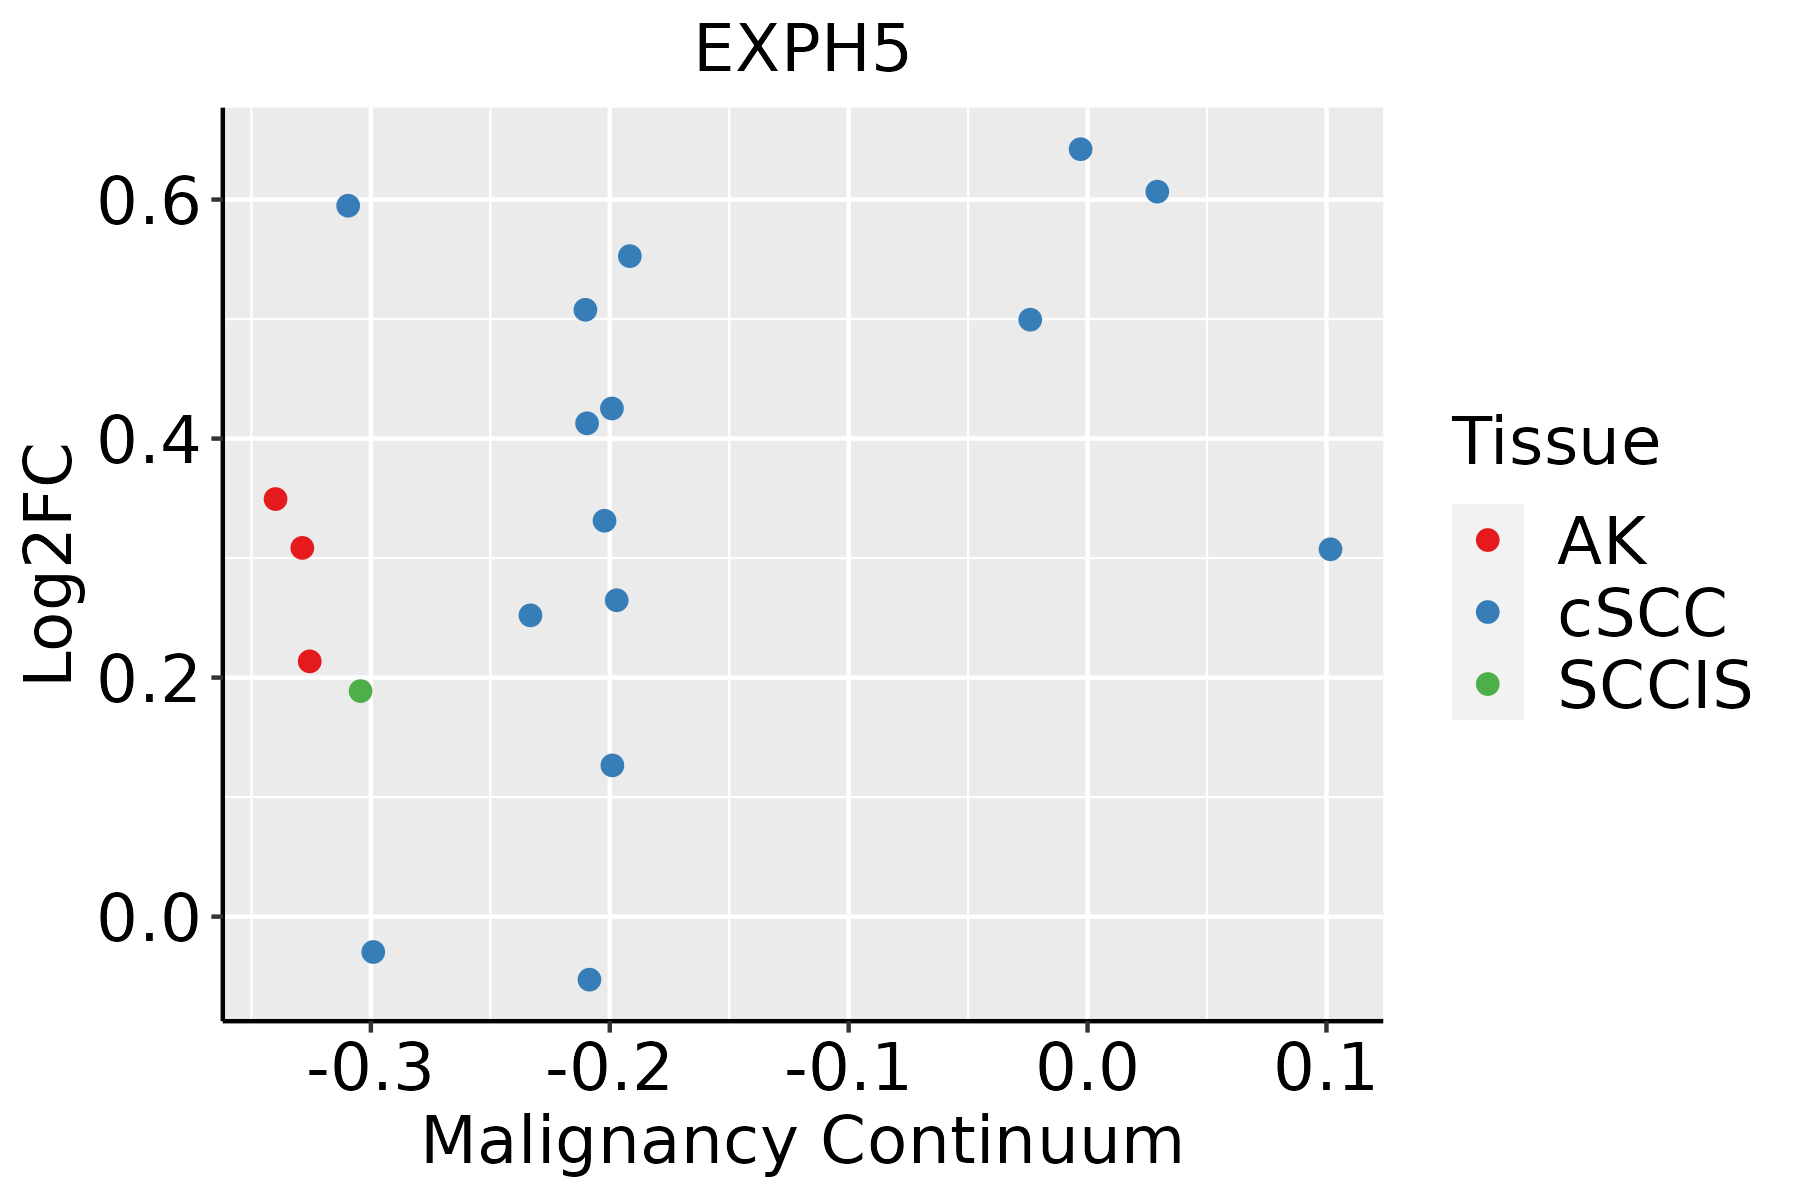
AK: Actinic keratosis
cSCC: Cutaneous squamous cell carcinoma
SCCIS:squamous cell carcinoma in situ
∗log2FC in expression of this searched gene in stem-like cells from each diseased tissue sample relative to stem-like cells in normal samples in each tissue plotted against the malignancy continuum. Samples are colored based on if they are from different disease stage.

Top

Malignant transformation related pathway analysis

check buttonFind out the enriched GO biological processes and KEGG pathways involved in transition from healthy to precancer to cancer
check button Figure of enriched GO biological processes.
TissueDisease StageEnriched GO biological Processes
ColorectumADGO analysis - Figure of enriched GO biological processes: Top 15 enriched GO BP terms are showed in the bar plot of each disease state in each tissue. Each row represents a significant GO biological process which is colored according to the -log10(p.adjust).
ColorectumSERGO analysis - Figure of enriched GO biological processes: Top 15 enriched GO BP terms are showed in the bar plot of each disease state in each tissue. Each row represents a significant GO biological process which is colored according to the -log10(p.adjust).
ColorectumMSSGO analysis - Figure of enriched GO biological processes: Top 15 enriched GO BP terms are showed in the bar plot of each disease state in each tissue. Each row represents a significant GO biological process which is colored according to the -log10(p.adjust).
ColorectumMSI-HGO analysis - Figure of enriched GO biological processes: Top 15 enriched GO BP terms are showed in the bar plot of each disease state in each tissue. Each row represents a significant GO biological process which is colored according to the -log10(p.adjust).
ColorectumFAPGO analysis - Figure of enriched GO biological processes: Top 15 enriched GO BP terms are showed in the bar plot of each disease state in each tissue. Each row represents a significant GO biological process which is colored according to the -log10(p.adjust).
∗Top 15 enriched GO BP terms are showed in the bar plot of each disease state in each tissue. Each row represents a significant GO biological process which is colored according to the -log10(p.adjust).
Page: 1 2 3 4 5 6 7 8 9 

check button Enriched GO biological processes.
GO IDTissueDisease StageDescriptionGene RatioBg Ratiopvaluep.adjustCount
GO:0002064ColorectumADepithelial cell development89/3918220/187232.98e-113.52e-0989
GO:1904951ColorectumADpositive regulation of establishment of protein localization112/3918319/187232.55e-091.80e-07112
GO:0051222ColorectumADpositive regulation of protein transport106/3918303/187238.45e-095.08e-07106
GO:0071985ColorectumADmultivesicular body sorting pathway19/391837/187234.08e-057.26e-0419
GO:0050708ColorectumADregulation of protein secretion83/3918268/187236.59e-051.07e-0383
GO:0009306ColorectumADprotein secretion105/3918359/187231.05e-041.57e-03105
GO:0035592ColorectumADestablishment of protein localization to extracellular region105/3918360/187231.18e-041.73e-03105
GO:0045921ColorectumADpositive regulation of exocytosis33/391886/187231.58e-042.20e-0333
GO:0071692ColorectumADprotein localization to extracellular region106/3918368/187231.86e-042.49e-03106
GO:0051047ColorectumADpositive regulation of secretion90/3918310/187234.11e-044.66e-0390
GO:1903532ColorectumADpositive regulation of secretion by cell82/3918282/187236.85e-047.00e-0382
GO:0006887ColorectumADexocytosis96/3918352/187232.48e-031.90e-0296
GO:0017157ColorectumADregulation of exocytosis59/3918202/187233.20e-032.36e-0259
GO:0050714ColorectumADpositive regulation of protein secretion42/3918137/187234.64e-033.16e-0242
GO:0009913ColorectumADepidermal cell differentiation58/3918202/187235.16e-033.42e-0258
GO:0008544ColorectumADepidermis development87/3918324/187235.99e-033.76e-0287
GO:19049511ColorectumSERpositive regulation of establishment of protein localization91/2897319/187231.69e-091.68e-0791
GO:00512221ColorectumSERpositive regulation of protein transport85/2897303/187231.36e-081.05e-0685
GO:00020641ColorectumSERepithelial cell development64/2897220/187231.96e-071.10e-0564
GO:00719851ColorectumSERmultivesicular body sorting pathway17/289737/187231.12e-053.60e-0417
Page: 1 2 3 4 5 6 7 8 

check button Enriched KEGG pathways.
Pathway IDTissueDisease StageDescriptionGene RatioBg Ratiopvaluep.adjustqvalueCount
Page: 1 

Top

Cell-cell communication analysis

check buttonIdentification of potential cell-cell interactions between two cell types and their ligand-receptor pairs for different disease states
LigandReceptorLRpairPathwayTissueDisease Stage
Page: 1 

Top

Single-cell gene regulatory network inference analysis

check buttonFind out the significant the regulons (TFs) and the target genes of each regulon across cell types for different disease states
TFCell TypeTissueDisease StageTarget GeneRSSRegulon Activity
∗The dot plots of a searched regulon are shown for all cell subpopulations in each disease state of each tissue based on the regulon specific score inferred using pySCENIC and by calculating the average expression.
Page: 1 

Top

Somatic mutation of malignant transformation related genes

check buttonAnnotation of somatic variants for genes involved in malignant transformation
Hugo SymbolVariant ClassVariant ClassificationdbSNP RSHGVScHGVSpHGVSp ShortSWISSPROTBIOTYPESIFTPolyPhenTumor Sample BarcodeTissueHistologySexAgeStageTherapy TypesDrugsOutcome
EXPH5SNVMissense_Mutationc.2912N>Ap.Arg971Lysp.R971KQ8NEV8protein_codingtolerated(1)benign(0.007)TCGA-A1-A0SH-01Breastbreast invasive carcinomaFemale<65I/IIChemotherapytcSD
EXPH5SNVMissense_Mutationc.4975N>Ap.Leu1659Metp.L1659MQ8NEV8protein_codingdeleterious(0.04)possibly_damaging(0.692)TCGA-A2-A04R-01Breastbreast invasive carcinomaFemale<65I/IIChemotherapytaxolSD
EXPH5SNVMissense_Mutationnovelc.2131G>Cp.Asp711Hisp.D711HQ8NEV8protein_codingtolerated(0.18)possibly_damaging(0.892)TCGA-A8-A093-01Breastbreast invasive carcinomaFemale<65I/IIHormone TherapytamoxiphenSD
EXPH5SNVMissense_Mutationc.1628G>Tp.Arg543Ilep.R543IQ8NEV8protein_codingdeleterious(0)probably_damaging(0.962)TCGA-AC-A23H-01Breastbreast invasive carcinomaFemale>=65I/IIUnknownUnknownPD
EXPH5SNVMissense_Mutationnovelc.245N>Cp.Leu82Prop.L82PQ8NEV8protein_codingdeleterious(0)probably_damaging(0.986)TCGA-AC-A3TN-01Breastbreast invasive carcinomaFemale>=65I/IIHormone TherapyarimidexSD
EXPH5SNVMissense_Mutationc.2702N>Tp.Pro901Leup.P901LQ8NEV8protein_codingtolerated(0.06)benign(0.222)TCGA-AO-A0JA-01Breastbreast invasive carcinomaFemale<65III/IVHormone TherapyleuprolideSD
EXPH5SNVMissense_Mutationrs777355388c.5638N>Gp.Ile1880Valp.I1880VQ8NEV8protein_codingdeleterious(0.02)probably_damaging(0.911)TCGA-BH-A1EN-01Breastbreast invasive carcinomaFemale>=65I/IIUnknownUnknownSD
EXPH5SNVMissense_Mutationc.1311N>Cp.Met437Ilep.M437IQ8NEV8protein_codingtolerated(0.08)benign(0.073)TCGA-C8-A1HM-01Breastbreast invasive carcinomaFemale>=65I/IIChemotherapydoxorubicinCR
EXPH5SNVMissense_Mutationnovelc.2687N>Gp.Asp896Glyp.D896GQ8NEV8protein_codingtolerated(0.21)benign(0.036)TCGA-C8-A8HR-01Breastbreast invasive carcinomaFemale<65III/IVChemotherapy5-fluorouracilCR
EXPH5SNVMissense_Mutationc.5900N>Tp.Asp1967Valp.D1967VQ8NEV8protein_codingdeleterious(0)probably_damaging(0.97)TCGA-D8-A1XK-01Breastbreast invasive carcinomaFemale<65I/IIChemotherapydoxorubicine+cyclophosphamideSD
Page: 1 2 3 4 5 6 7 8 9 10 11 12 13 14 15 16 17 18 19 20 21 

Top

Related drugs of malignant transformation related genes

check buttonIdentification of chemicals and drugs interact with genes involved in malignant transfromation
(DGIdb 4.0)
Entrez IDSymbolCategoryInteraction TypesDrug Claim NameDrug NamePMIDs
Page: 1