
|
|||||
|
 | |
| |
| |
| |
| |
| |
|
Gene: EXOSC5 |
Gene summary for EXOSC5 |
| Gene information | Species | Human | Gene symbol | EXOSC5 | Gene ID | 56915 |
| Gene name | exosome component 5 | |
| Gene Alias | RRP41B | |
| Cytomap | 19q13.2 | |
| Gene Type | protein-coding | GO ID | GO:0000288 | UniProtAcc | Q9NQT4 |
Top |
Malignant transformation analysis |
| Identification of the aberrant gene expression in precancerous and cancerous lesions by comparing the gene expression of stem-like cells in diseased tissues with normal stem cells |
| Entrez ID | Symbol | Replicates | Species | Organ | Tissue | Adj P-value | Log2FC | Malignancy |
| 56915 | EXOSC5 | HTA11_866_3004761011 | Human | Colorectum | AD | 2.72e-07 | 2.80e-01 | 0.096 |
| 56915 | EXOSC5 | HTA11_8622_2000001021 | Human | Colorectum | SER | 8.16e-03 | 3.17e-01 | 0.0528 |
| 56915 | EXOSC5 | HTA11_7696_3000711011 | Human | Colorectum | AD | 1.47e-08 | 2.50e-01 | 0.0674 |
| 56915 | EXOSC5 | HTA11_99999970781_79442 | Human | Colorectum | MSS | 5.47e-03 | 1.60e-01 | 0.294 |
| 56915 | EXOSC5 | HTA11_99999965062_69753 | Human | Colorectum | MSI-H | 1.81e-02 | 5.07e-01 | 0.3487 |
| 56915 | EXOSC5 | HTA11_99999965104_69814 | Human | Colorectum | MSS | 4.61e-13 | 6.18e-01 | 0.281 |
| 56915 | EXOSC5 | HTA11_99999971662_82457 | Human | Colorectum | MSS | 8.25e-15 | 4.17e-01 | 0.3859 |
| 56915 | EXOSC5 | HTA11_99999974143_84620 | Human | Colorectum | MSS | 1.18e-07 | 2.45e-01 | 0.3005 |
| 56915 | EXOSC5 | LZE2T | Human | Esophagus | ESCC | 6.85e-04 | 7.97e-01 | 0.082 |
| 56915 | EXOSC5 | LZE4T | Human | Esophagus | ESCC | 1.55e-08 | 3.28e-01 | 0.0811 |
| 56915 | EXOSC5 | LZE7T | Human | Esophagus | ESCC | 2.09e-12 | 7.95e-01 | 0.0667 |
| 56915 | EXOSC5 | LZE8T | Human | Esophagus | ESCC | 5.33e-15 | 4.72e-01 | 0.067 |
| 56915 | EXOSC5 | LZE22T | Human | Esophagus | ESCC | 1.70e-03 | 4.42e-01 | 0.068 |
| 56915 | EXOSC5 | LZE24T | Human | Esophagus | ESCC | 3.63e-30 | 8.96e-01 | 0.0596 |
| 56915 | EXOSC5 | LZE21T | Human | Esophagus | ESCC | 1.22e-09 | 4.51e-01 | 0.0655 |
| 56915 | EXOSC5 | LZE6T | Human | Esophagus | ESCC | 8.40e-04 | 3.55e-01 | 0.0845 |
| 56915 | EXOSC5 | P1T-E | Human | Esophagus | ESCC | 1.06e-10 | 6.67e-01 | 0.0875 |
| 56915 | EXOSC5 | P2T-E | Human | Esophagus | ESCC | 2.97e-27 | 6.01e-01 | 0.1177 |
| 56915 | EXOSC5 | P4T-E | Human | Esophagus | ESCC | 1.34e-23 | 6.36e-01 | 0.1323 |
| 56915 | EXOSC5 | P5T-E | Human | Esophagus | ESCC | 1.31e-44 | 8.29e-01 | 0.1327 |
| Page: 1 2 3 4 5 6 |
| Tissue | Expression Dynamics | Abbreviation |
| Colorectum (GSE201348) |  | FAP: Familial adenomatous polyposis |
| CRC: Colorectal cancer | ||
| Colorectum (HTA11) |  | AD: Adenomas |
| SER: Sessile serrated lesions | ||
| MSI-H: Microsatellite-high colorectal cancer | ||
| MSS: Microsatellite stable colorectal cancer | ||
| Esophagus | 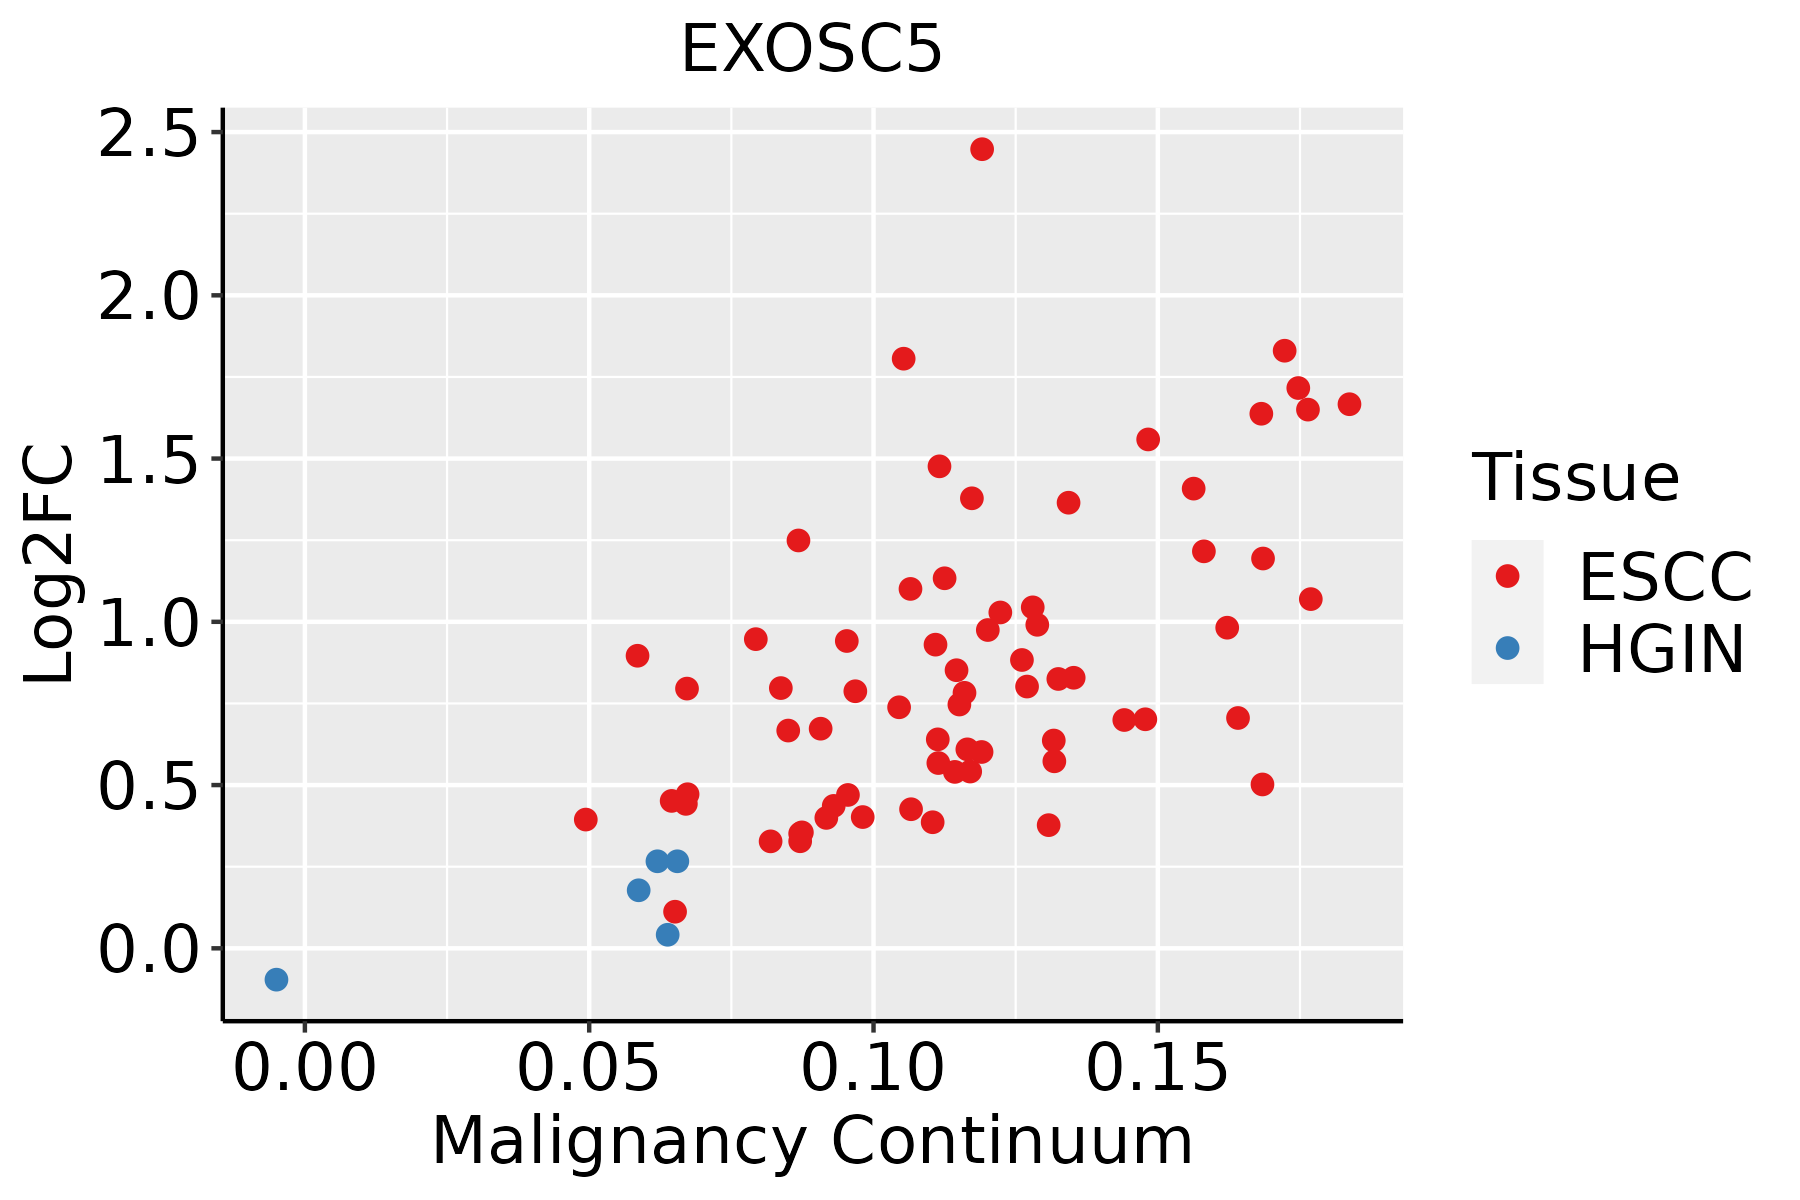 | ESCC: Esophageal squamous cell carcinoma |
| HGIN: High-grade intraepithelial neoplasias | ||
| LGIN: Low-grade intraepithelial neoplasias | ||
| Liver | 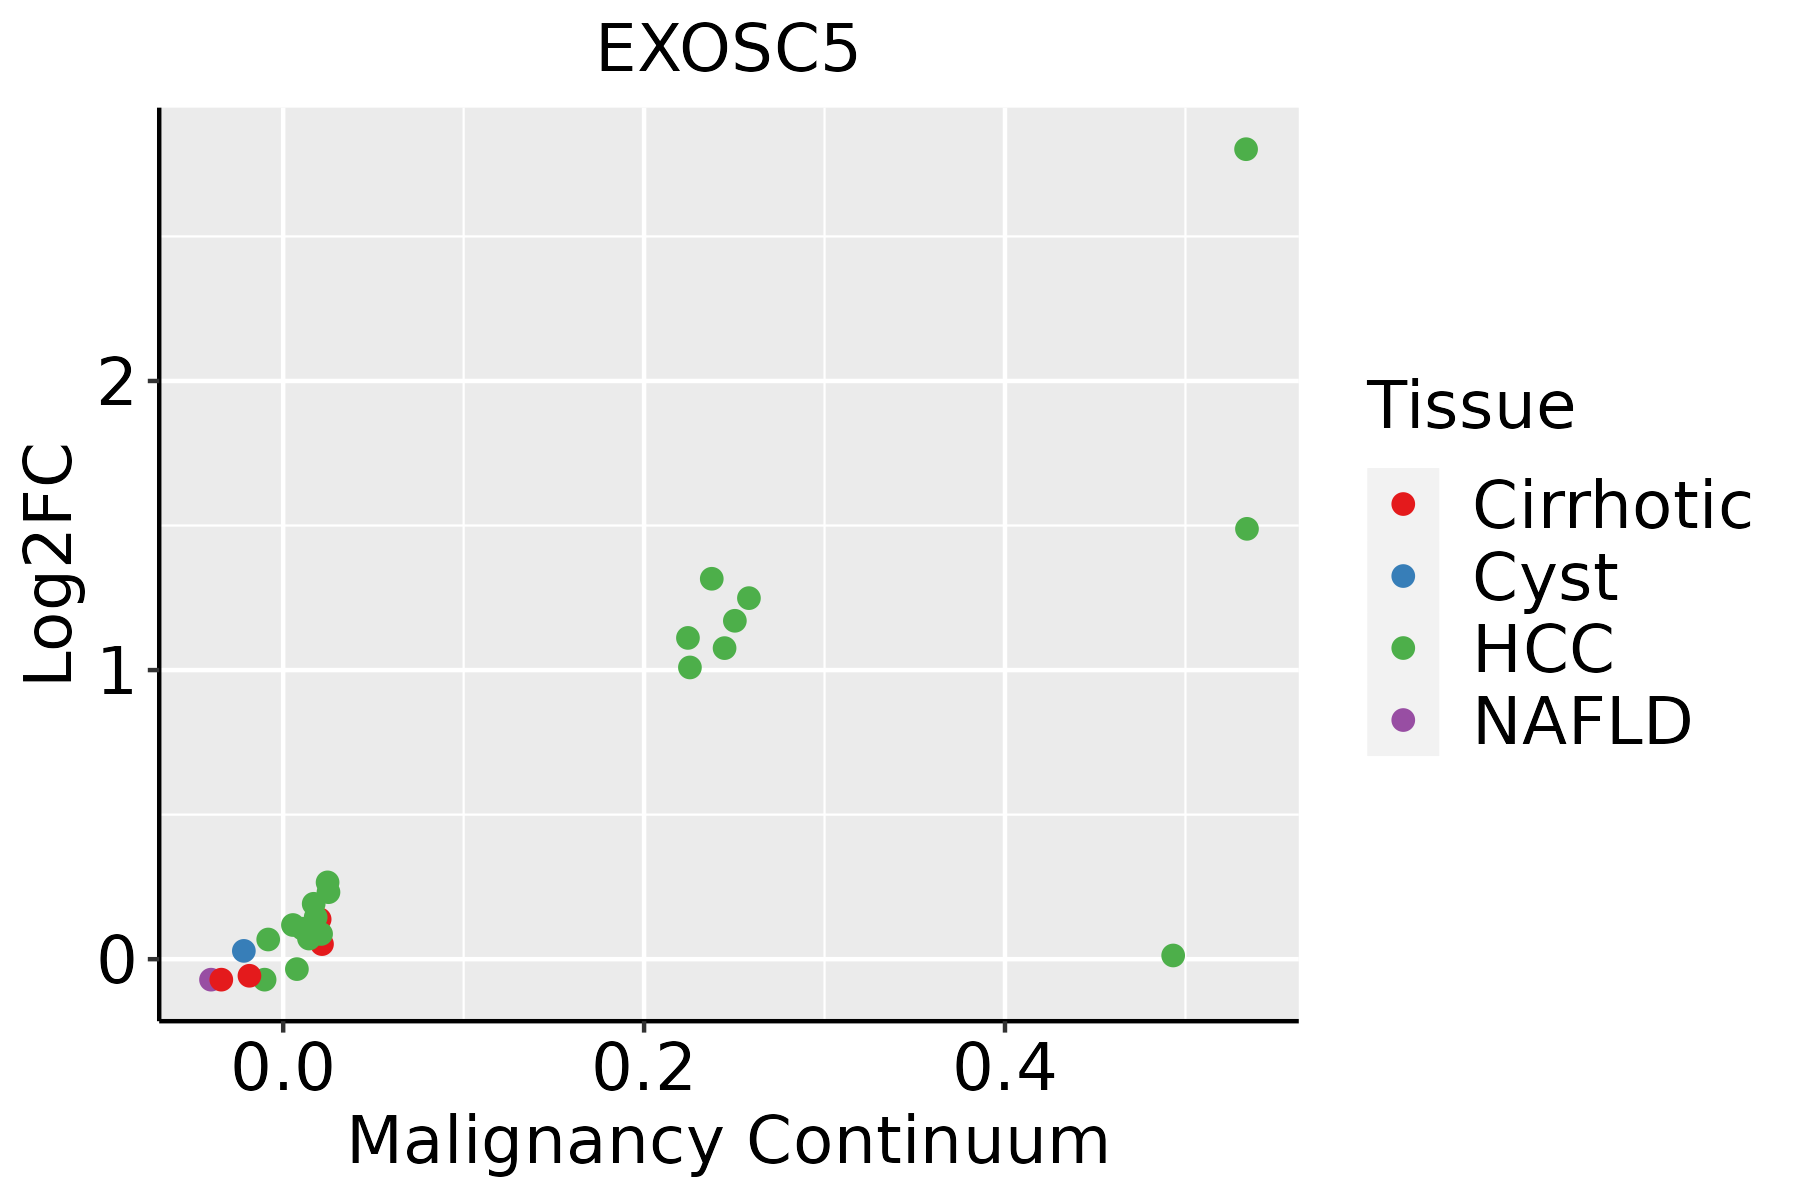 | HCC: Hepatocellular carcinoma |
| NAFLD: Non-alcoholic fatty liver disease | ||
| Oral Cavity | 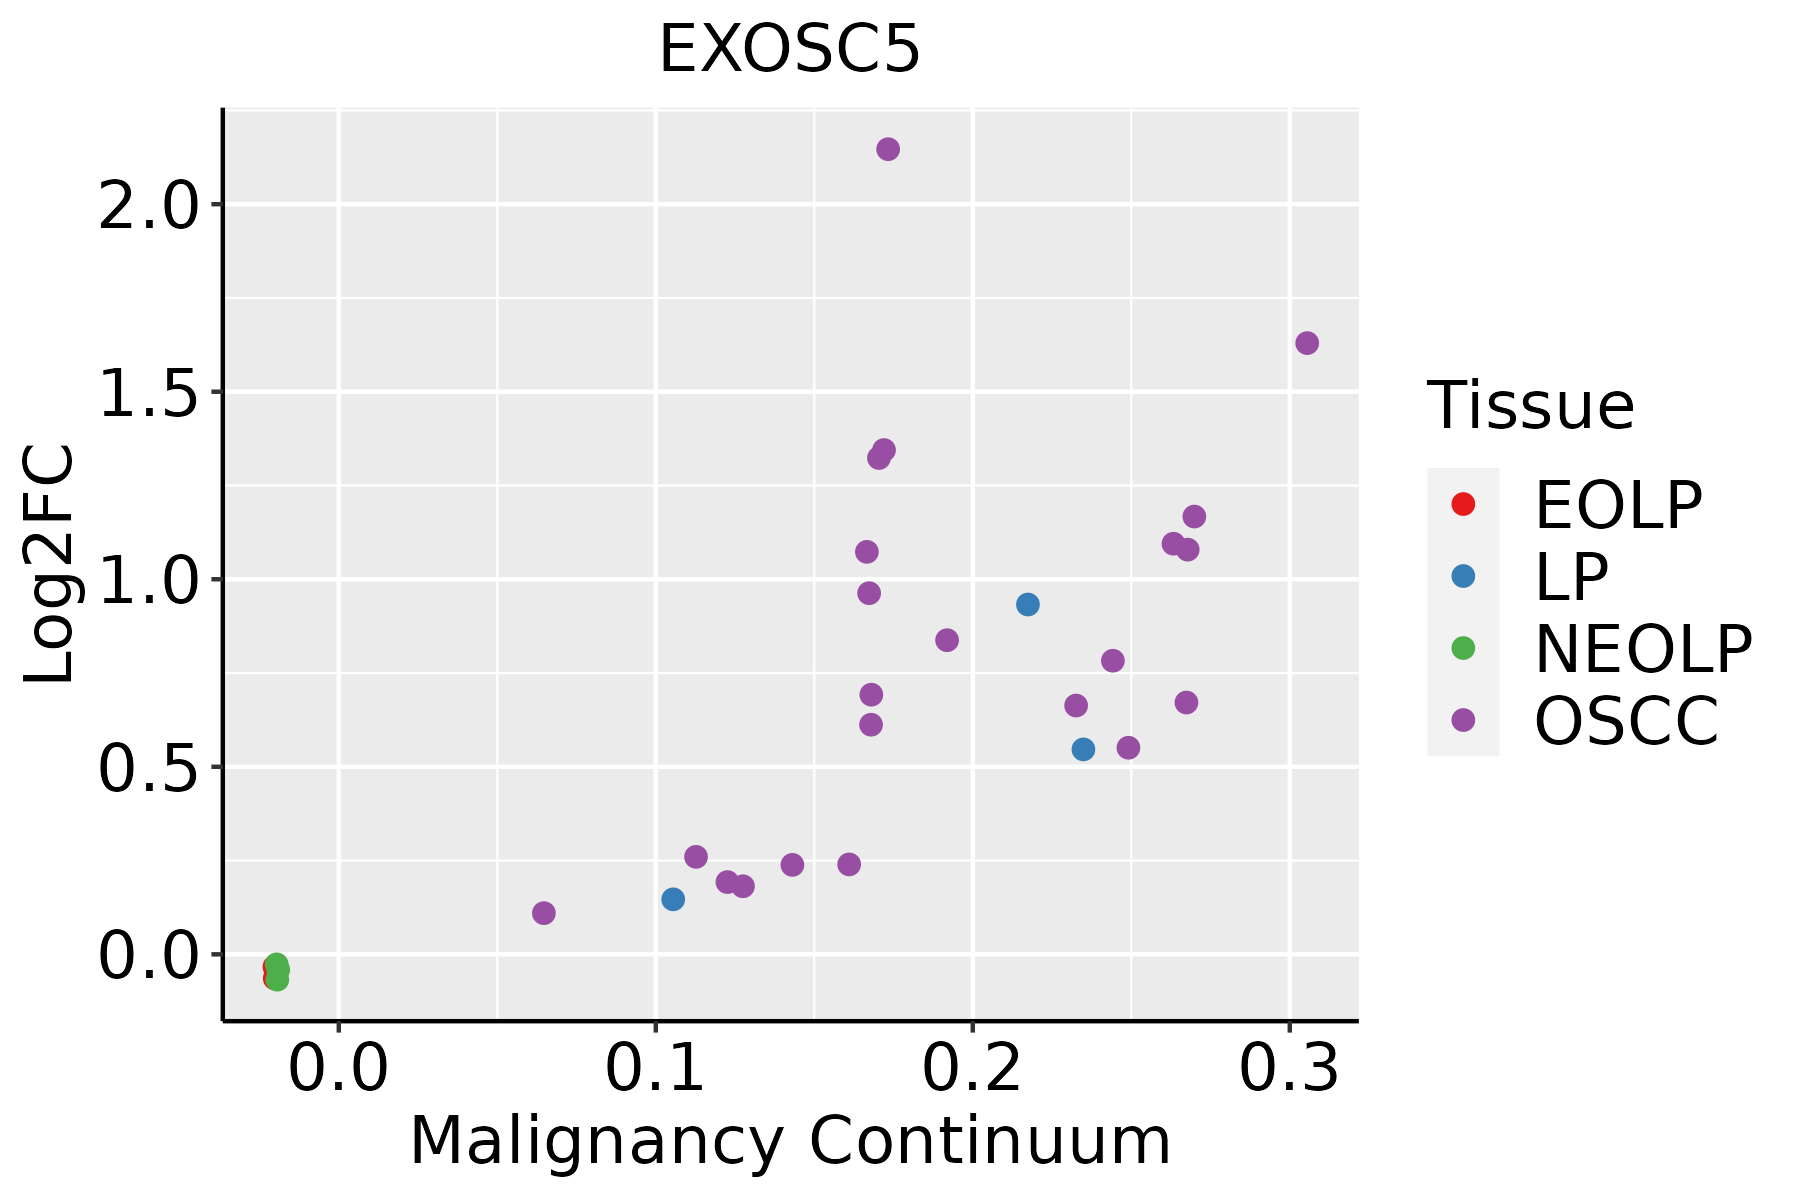 | EOLP: Erosive Oral lichen planus |
| LP: leukoplakia | ||
| NEOLP: Non-erosive oral lichen planus | ||
| OSCC: Oral squamous cell carcinoma | ||
| Skin | 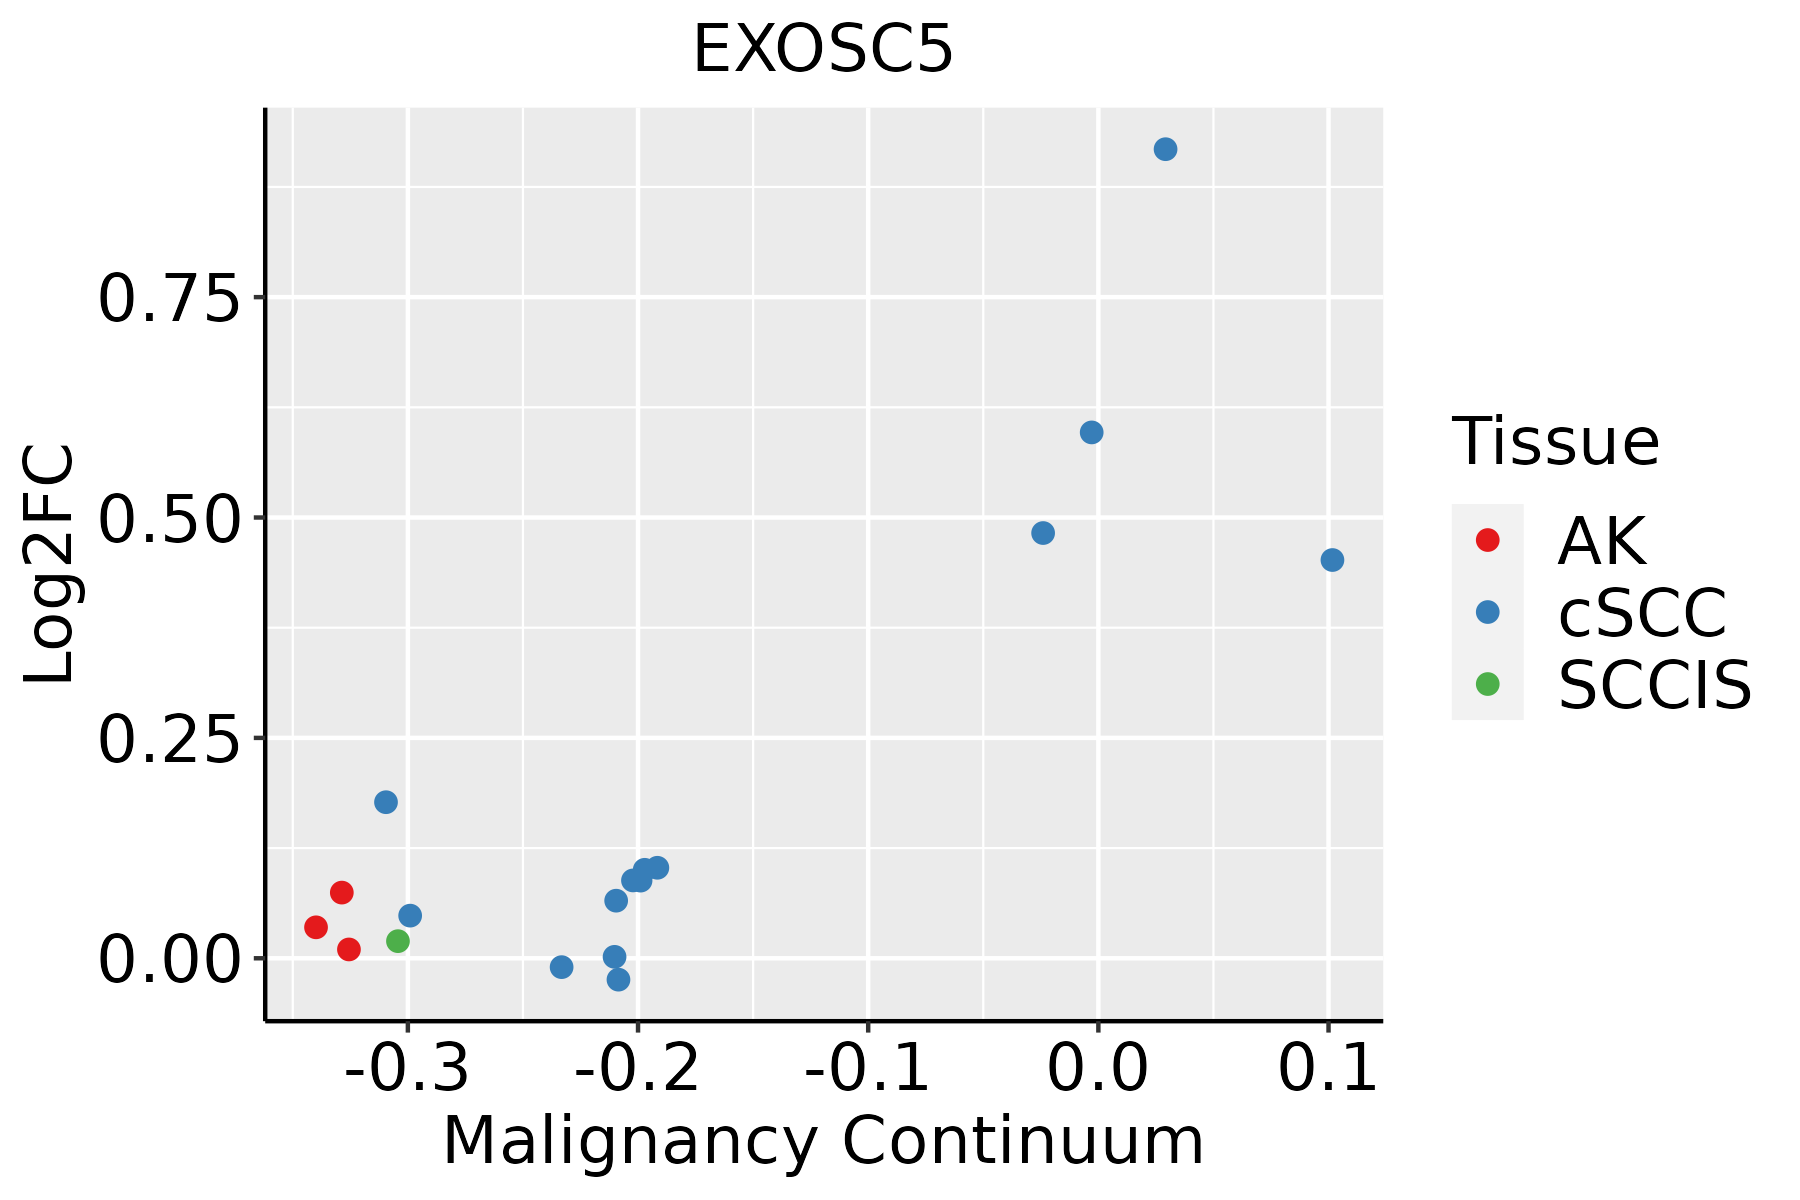 | AK: Actinic keratosis |
| cSCC: Cutaneous squamous cell carcinoma | ||
| SCCIS:squamous cell carcinoma in situ | ||
| Thyroid | 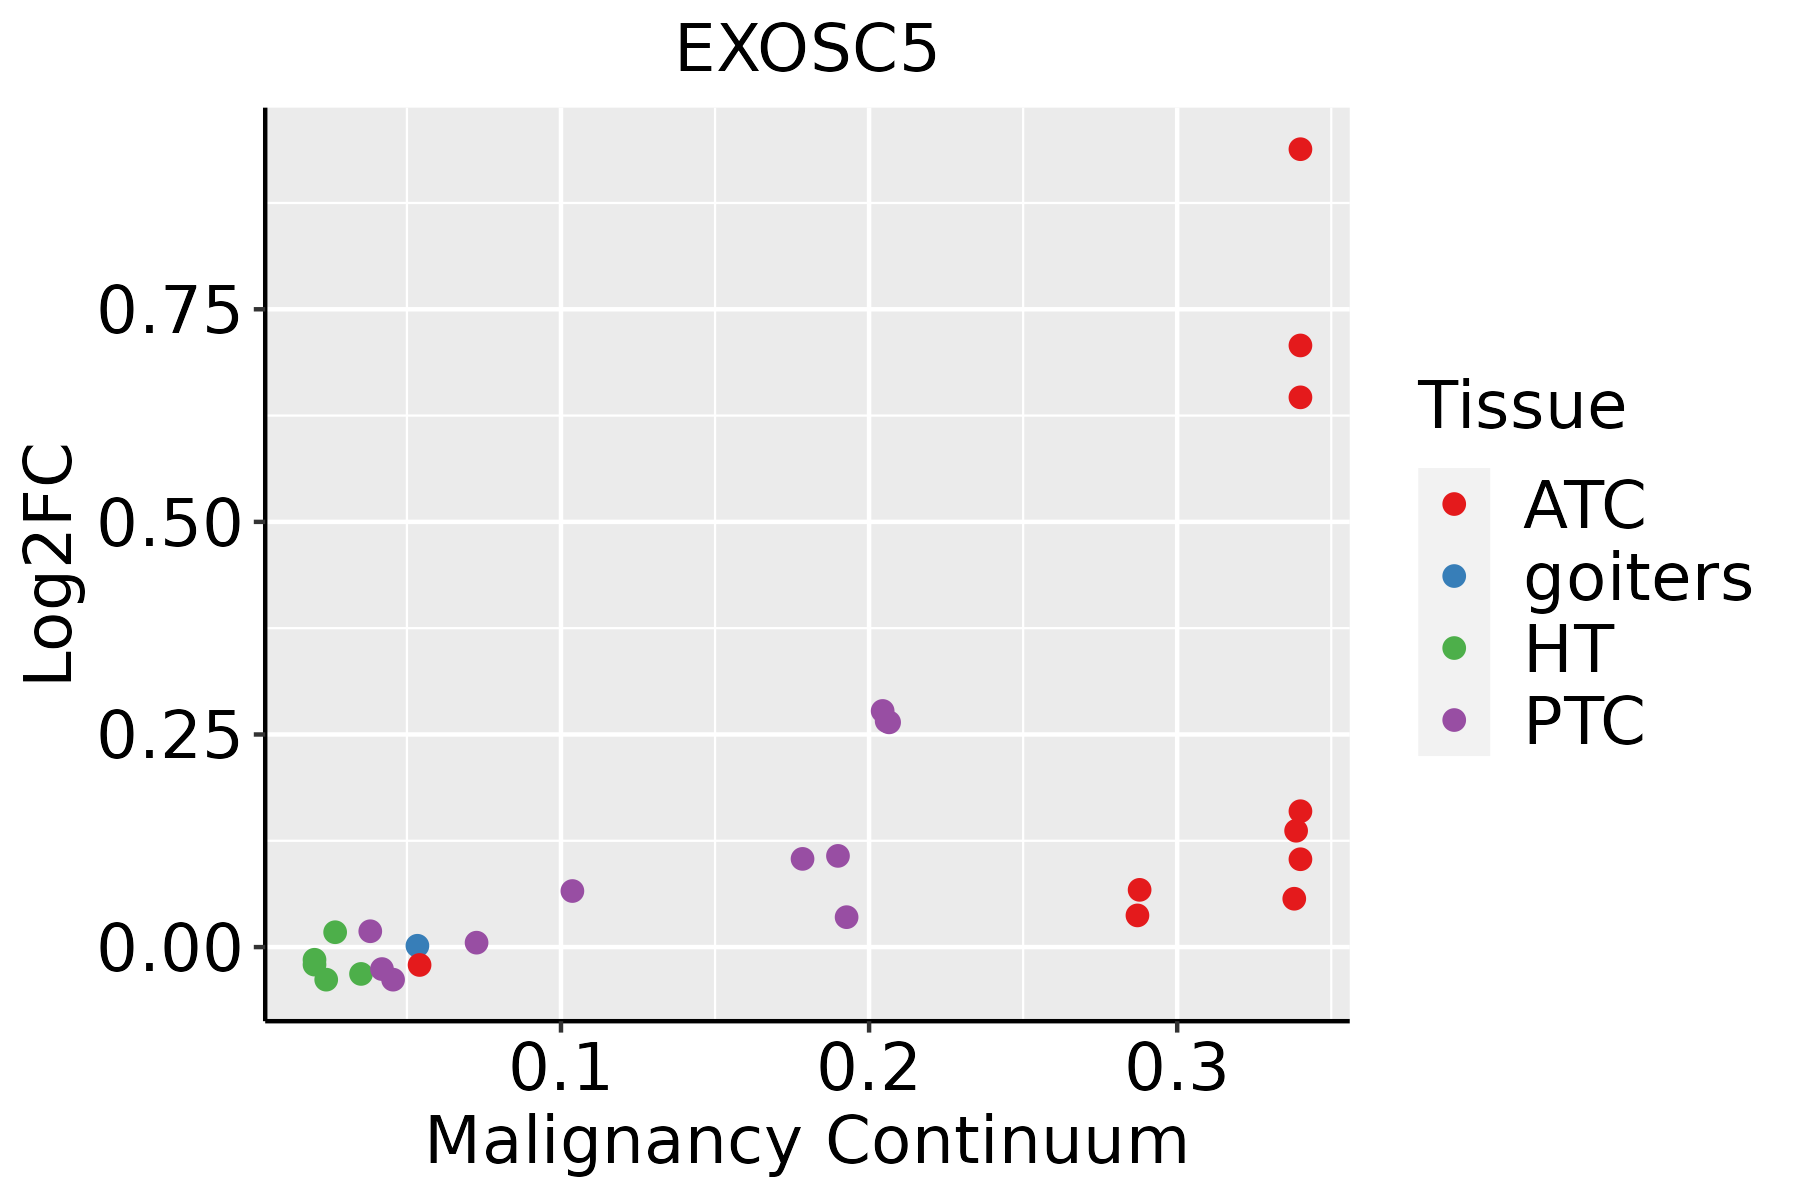 | ATC: Anaplastic thyroid cancer |
| HT: Hashimoto's thyroiditis | ||
| PTC: Papillary thyroid cancer |
| ∗log2FC in expression of this searched gene in stem-like cells from each diseased tissue sample relative to stem-like cells in normal samples in each tissue plotted against the malignancy continuum. Samples are colored based on if they are from different disease stage. |
Top |
Malignant transformation related pathway analysis |
| Find out the enriched GO biological processes and KEGG pathways involved in transition from healthy to precancer to cancer |
| Tissue | Disease Stage | Enriched GO biological Processes |
| Colorectum | AD |  |
| Colorectum | SER |  |
| Colorectum | MSS |  |
| Colorectum | MSI-H |  |
| Colorectum | FAP |  |
| ∗Top 15 enriched GO BP terms are showed in the bar plot of each disease state in each tissue. Each row represents a significant GO biological process which is colored according to the -log10(p.adjust). |
| Page: 1 2 3 4 5 6 7 8 9 |
| GO ID | Tissue | Disease Stage | Description | Gene Ratio | Bg Ratio | pvalue | p.adjust | Count |
| GO:0009896 | Colorectum | AD | positive regulation of catabolic process | 180/3918 | 492/18723 | 4.33e-16 | 1.94e-13 | 180 |
| GO:1903311 | Colorectum | AD | regulation of mRNA metabolic process | 117/3918 | 288/18723 | 1.69e-14 | 4.23e-12 | 117 |
| GO:0031331 | Colorectum | AD | positive regulation of cellular catabolic process | 156/3918 | 427/18723 | 4.68e-14 | 1.05e-11 | 156 |
| GO:0006401 | Colorectum | AD | RNA catabolic process | 102/3918 | 278/18723 | 8.64e-10 | 6.76e-08 | 102 |
| GO:0022613 | Colorectum | AD | ribonucleoprotein complex biogenesis | 151/3918 | 463/18723 | 1.96e-09 | 1.39e-07 | 151 |
| GO:0044270 | Colorectum | AD | cellular nitrogen compound catabolic process | 147/3918 | 451/18723 | 3.35e-09 | 2.23e-07 | 147 |
| GO:0046700 | Colorectum | AD | heterocycle catabolic process | 145/3918 | 445/18723 | 4.37e-09 | 2.84e-07 | 145 |
| GO:0006402 | Colorectum | AD | mRNA catabolic process | 87/3918 | 232/18723 | 4.40e-09 | 2.84e-07 | 87 |
| GO:0034655 | Colorectum | AD | nucleobase-containing compound catabolic process | 133/3918 | 407/18723 | 1.56e-08 | 9.12e-07 | 133 |
| GO:0019439 | Colorectum | AD | aromatic compound catabolic process | 146/3918 | 467/18723 | 7.48e-08 | 3.84e-06 | 146 |
| GO:1901361 | Colorectum | AD | organic cyclic compound catabolic process | 153/3918 | 495/18723 | 8.23e-08 | 4.18e-06 | 153 |
| GO:0061013 | Colorectum | AD | regulation of mRNA catabolic process | 64/3918 | 166/18723 | 1.44e-07 | 6.59e-06 | 64 |
| GO:0043487 | Colorectum | AD | regulation of RNA stability | 63/3918 | 170/18723 | 9.17e-07 | 3.12e-05 | 63 |
| GO:0006417 | Colorectum | AD | regulation of translation | 141/3918 | 468/18723 | 1.32e-06 | 4.22e-05 | 141 |
| GO:0043488 | Colorectum | AD | regulation of mRNA stability | 59/3918 | 158/18723 | 1.50e-06 | 4.66e-05 | 59 |
| GO:1903313 | Colorectum | AD | positive regulation of mRNA metabolic process | 44/3918 | 118/18723 | 3.20e-05 | 5.87e-04 | 44 |
| GO:0000956 | Colorectum | AD | nuclear-transcribed mRNA catabolic process | 40/3918 | 112/18723 | 2.11e-04 | 2.79e-03 | 40 |
| GO:0061014 | Colorectum | AD | positive regulation of mRNA catabolic process | 32/3918 | 87/18723 | 4.81e-04 | 5.27e-03 | 32 |
| GO:0061157 | Colorectum | AD | mRNA destabilization | 30/3918 | 84/18723 | 1.24e-03 | 1.09e-02 | 30 |
| GO:0042254 | Colorectum | AD | ribosome biogenesis | 84/3918 | 299/18723 | 1.82e-03 | 1.50e-02 | 84 |
| Page: 1 2 3 4 5 6 7 8 9 10 11 12 13 14 15 16 17 18 19 20 21 22 |
| Pathway ID | Tissue | Disease Stage | Description | Gene Ratio | Bg Ratio | pvalue | p.adjust | qvalue | Count |
| hsa0301824 | Esophagus | ESCC | RNA degradation | 62/4205 | 79/8465 | 1.18e-07 | 9.39e-07 | 4.81e-07 | 62 |
| hsa0301834 | Esophagus | ESCC | RNA degradation | 62/4205 | 79/8465 | 1.18e-07 | 9.39e-07 | 4.81e-07 | 62 |
| hsa03018 | Liver | Cirrhotic | RNA degradation | 44/2530 | 79/8465 | 1.43e-06 | 1.65e-05 | 1.02e-05 | 44 |
| hsa030181 | Liver | Cirrhotic | RNA degradation | 44/2530 | 79/8465 | 1.43e-06 | 1.65e-05 | 1.02e-05 | 44 |
| hsa030182 | Liver | HCC | RNA degradation | 58/4020 | 79/8465 | 2.29e-06 | 2.19e-05 | 1.22e-05 | 58 |
| hsa030183 | Liver | HCC | RNA degradation | 58/4020 | 79/8465 | 2.29e-06 | 2.19e-05 | 1.22e-05 | 58 |
| hsa030189 | Oral cavity | OSCC | RNA degradation | 59/3704 | 79/8465 | 2.05e-08 | 1.91e-07 | 9.70e-08 | 59 |
| hsa0301814 | Oral cavity | OSCC | RNA degradation | 59/3704 | 79/8465 | 2.05e-08 | 1.91e-07 | 9.70e-08 | 59 |
| hsa0301823 | Oral cavity | LP | RNA degradation | 39/2418 | 79/8465 | 6.98e-05 | 4.38e-04 | 2.83e-04 | 39 |
| hsa0301833 | Oral cavity | LP | RNA degradation | 39/2418 | 79/8465 | 6.98e-05 | 4.38e-04 | 2.83e-04 | 39 |
| Page: 1 |
Top |
Cell-cell communication analysis |
| Identification of potential cell-cell interactions between two cell types and their ligand-receptor pairs for different disease states |
| Ligand | Receptor | LRpair | Pathway | Tissue | Disease Stage |
| Page: 1 |
Top |
Single-cell gene regulatory network inference analysis |
| Find out the significant the regulons (TFs) and the target genes of each regulon across cell types for different disease states |
| TF | Cell Type | Tissue | Disease Stage | Target Gene | RSS | Regulon Activity |
| ∗The dot plots of a searched regulon are shown for all cell subpopulations in each disease state of each tissue based on the regulon specific score inferred using pySCENIC and by calculating the average expression. |
| Page: 1 |
Top |
Somatic mutation of malignant transformation related genes |
| Annotation of somatic variants for genes involved in malignant transformation |
| Hugo Symbol | Variant Class | Variant Classification | dbSNP RS | HGVSc | HGVSp | HGVSp Short | SWISSPROT | BIOTYPE | SIFT | PolyPhen | Tumor Sample Barcode | Tissue | Histology | Sex | Age | Stage | Therapy Types | Drugs | Outcome |
| EXOSC5 | SNV | Missense_Mutation | novel | c.283N>A | p.Glu95Lys | p.E95K | Q9NQT4 | protein_coding | deleterious(0) | probably_damaging(1) | TCGA-BH-A0B6-01 | Breast | breast invasive carcinoma | Female | <65 | I/II | Unknown | Unknown | SD |
| EXOSC5 | SNV | Missense_Mutation | novel | c.308A>T | p.Glu103Val | p.E103V | Q9NQT4 | protein_coding | deleterious(0) | possibly_damaging(0.9) | TCGA-EW-A1PC-01 | Breast | breast invasive carcinoma | Female | >=65 | I/II | Hormone Therapy | tamoxiphen | SD |
| EXOSC5 | SNV | Missense_Mutation | rs754247072 | c.650N>T | p.Ser217Leu | p.S217L | Q9NQT4 | protein_coding | deleterious(0.01) | possibly_damaging(0.484) | TCGA-DS-A1OB-01 | Cervix | cervical & endocervical cancer | Female | <65 | I/II | Chemotherapy | carboplatin | PD |
| EXOSC5 | SNV | Missense_Mutation | rs771048778 | c.116C>T | p.Ser39Leu | p.S39L | Q9NQT4 | protein_coding | deleterious(0) | probably_damaging(0.98) | TCGA-FU-A3HY-01 | Cervix | cervical & endocervical cancer | Female | <65 | I/II | Chemotherapy | cisplatin | CR |
| EXOSC5 | SNV | Missense_Mutation | rs772859389 | c.71N>T | p.Pro24Leu | p.P24L | Q9NQT4 | protein_coding | tolerated_low_confidence(0.08) | benign(0) | TCGA-AA-3939-01 | Colorectum | colon adenocarcinoma | Male | >=65 | I/II | Unknown | Unknown | SD |
| EXOSC5 | SNV | Missense_Mutation | c.433G>A | p.Gly145Ser | p.G145S | Q9NQT4 | protein_coding | tolerated(0.08) | probably_damaging(0.989) | TCGA-CA-6717-01 | Colorectum | colon adenocarcinoma | Male | <65 | I/II | Chemotherapy | oxaliplatin | CR | |
| EXOSC5 | SNV | Missense_Mutation | novel | c.334C>T | p.Pro112Ser | p.P112S | Q9NQT4 | protein_coding | deleterious(0.02) | probably_damaging(0.999) | TCGA-A5-A0G2-01 | Endometrium | uterine corpus endometrioid carcinoma | Female | <65 | III/IV | Unknown | Unknown | SD |
| EXOSC5 | SNV | Missense_Mutation | novel | c.249N>T | p.Lys83Asn | p.K83N | Q9NQT4 | protein_coding | deleterious(0.01) | probably_damaging(0.957) | TCGA-A5-A2K3-01 | Endometrium | uterine corpus endometrioid carcinoma | Female | >=65 | I/II | Chemotherapy | carboplatin | SD |
| EXOSC5 | SNV | Missense_Mutation | c.439C>T | p.Pro147Ser | p.P147S | Q9NQT4 | protein_coding | tolerated(0.08) | possibly_damaging(0.488) | TCGA-AP-A0LM-01 | Endometrium | uterine corpus endometrioid carcinoma | Female | <65 | III/IV | Chemotherapy | cisplatin | SD | |
| EXOSC5 | SNV | Missense_Mutation | c.359T>C | p.Leu120Pro | p.L120P | Q9NQT4 | protein_coding | deleterious(0) | probably_damaging(1) | TCGA-AX-A064-01 | Endometrium | uterine corpus endometrioid carcinoma | Female | >=65 | I/II | Unknown | Unknown | SD |
| Page: 1 2 3 |
Top |
Related drugs of malignant transformation related genes |
| Identification of chemicals and drugs interact with genes involved in malignant transfromation |
| (DGIdb 4.0) |
| Entrez ID | Symbol | Category | Interaction Types | Drug Claim Name | Drug Name | PMIDs |
| Page: 1 |

Copyright 2023-Present -The University of Texas Health Science Center at Houston |