
|
|||||
|
 | |
| |
| |
| |
| |
| |
|
Gene: EXOSC3 |
Gene summary for EXOSC3 |
| Gene information | Species | Human | Gene symbol | EXOSC3 | Gene ID | 51010 |
| Gene name | exosome component 3 | |
| Gene Alias | CGI-102 | |
| Cytomap | 9p13.2 | |
| Gene Type | protein-coding | GO ID | GO:0000018 | UniProtAcc | Q9NQT5 |
Top |
Malignant transformation analysis |
| Identification of the aberrant gene expression in precancerous and cancerous lesions by comparing the gene expression of stem-like cells in diseased tissues with normal stem cells |
| Entrez ID | Symbol | Replicates | Species | Organ | Tissue | Adj P-value | Log2FC | Malignancy |
| 51010 | EXOSC3 | LZE4T | Human | Esophagus | ESCC | 3.50e-12 | 2.86e-01 | 0.0811 |
| 51010 | EXOSC3 | LZE5T | Human | Esophagus | ESCC | 3.11e-02 | 2.42e-01 | 0.0514 |
| 51010 | EXOSC3 | LZE7T | Human | Esophagus | ESCC | 4.86e-09 | 7.13e-01 | 0.0667 |
| 51010 | EXOSC3 | LZE8T | Human | Esophagus | ESCC | 1.96e-02 | 1.12e-01 | 0.067 |
| 51010 | EXOSC3 | LZE24T | Human | Esophagus | ESCC | 5.55e-14 | 3.86e-01 | 0.0596 |
| 51010 | EXOSC3 | LZE21T | Human | Esophagus | ESCC | 1.16e-02 | 1.09e-01 | 0.0655 |
| 51010 | EXOSC3 | LZE6T | Human | Esophagus | ESCC | 5.63e-05 | 2.62e-01 | 0.0845 |
| 51010 | EXOSC3 | P1T-E | Human | Esophagus | ESCC | 5.81e-11 | 2.44e-01 | 0.0875 |
| 51010 | EXOSC3 | P2T-E | Human | Esophagus | ESCC | 5.27e-38 | 6.80e-01 | 0.1177 |
| 51010 | EXOSC3 | P4T-E | Human | Esophagus | ESCC | 2.08e-20 | 6.07e-01 | 0.1323 |
| 51010 | EXOSC3 | P5T-E | Human | Esophagus | ESCC | 4.84e-19 | 3.74e-01 | 0.1327 |
| 51010 | EXOSC3 | P8T-E | Human | Esophagus | ESCC | 2.82e-16 | 1.80e-01 | 0.0889 |
| 51010 | EXOSC3 | P9T-E | Human | Esophagus | ESCC | 9.95e-18 | 3.95e-01 | 0.1131 |
| 51010 | EXOSC3 | P10T-E | Human | Esophagus | ESCC | 1.99e-21 | 4.06e-01 | 0.116 |
| 51010 | EXOSC3 | P11T-E | Human | Esophagus | ESCC | 2.93e-10 | 4.53e-01 | 0.1426 |
| 51010 | EXOSC3 | P12T-E | Human | Esophagus | ESCC | 1.21e-24 | 2.95e-01 | 0.1122 |
| 51010 | EXOSC3 | P15T-E | Human | Esophagus | ESCC | 3.92e-20 | 4.75e-01 | 0.1149 |
| 51010 | EXOSC3 | P16T-E | Human | Esophagus | ESCC | 6.04e-26 | 3.36e-01 | 0.1153 |
| 51010 | EXOSC3 | P17T-E | Human | Esophagus | ESCC | 2.02e-10 | 5.94e-01 | 0.1278 |
| 51010 | EXOSC3 | P20T-E | Human | Esophagus | ESCC | 1.90e-20 | 3.97e-01 | 0.1124 |
| Page: 1 2 3 4 5 6 |
| Tissue | Expression Dynamics | Abbreviation |
| Esophagus |  | ESCC: Esophageal squamous cell carcinoma |
| HGIN: High-grade intraepithelial neoplasias | ||
| LGIN: Low-grade intraepithelial neoplasias | ||
| Liver | 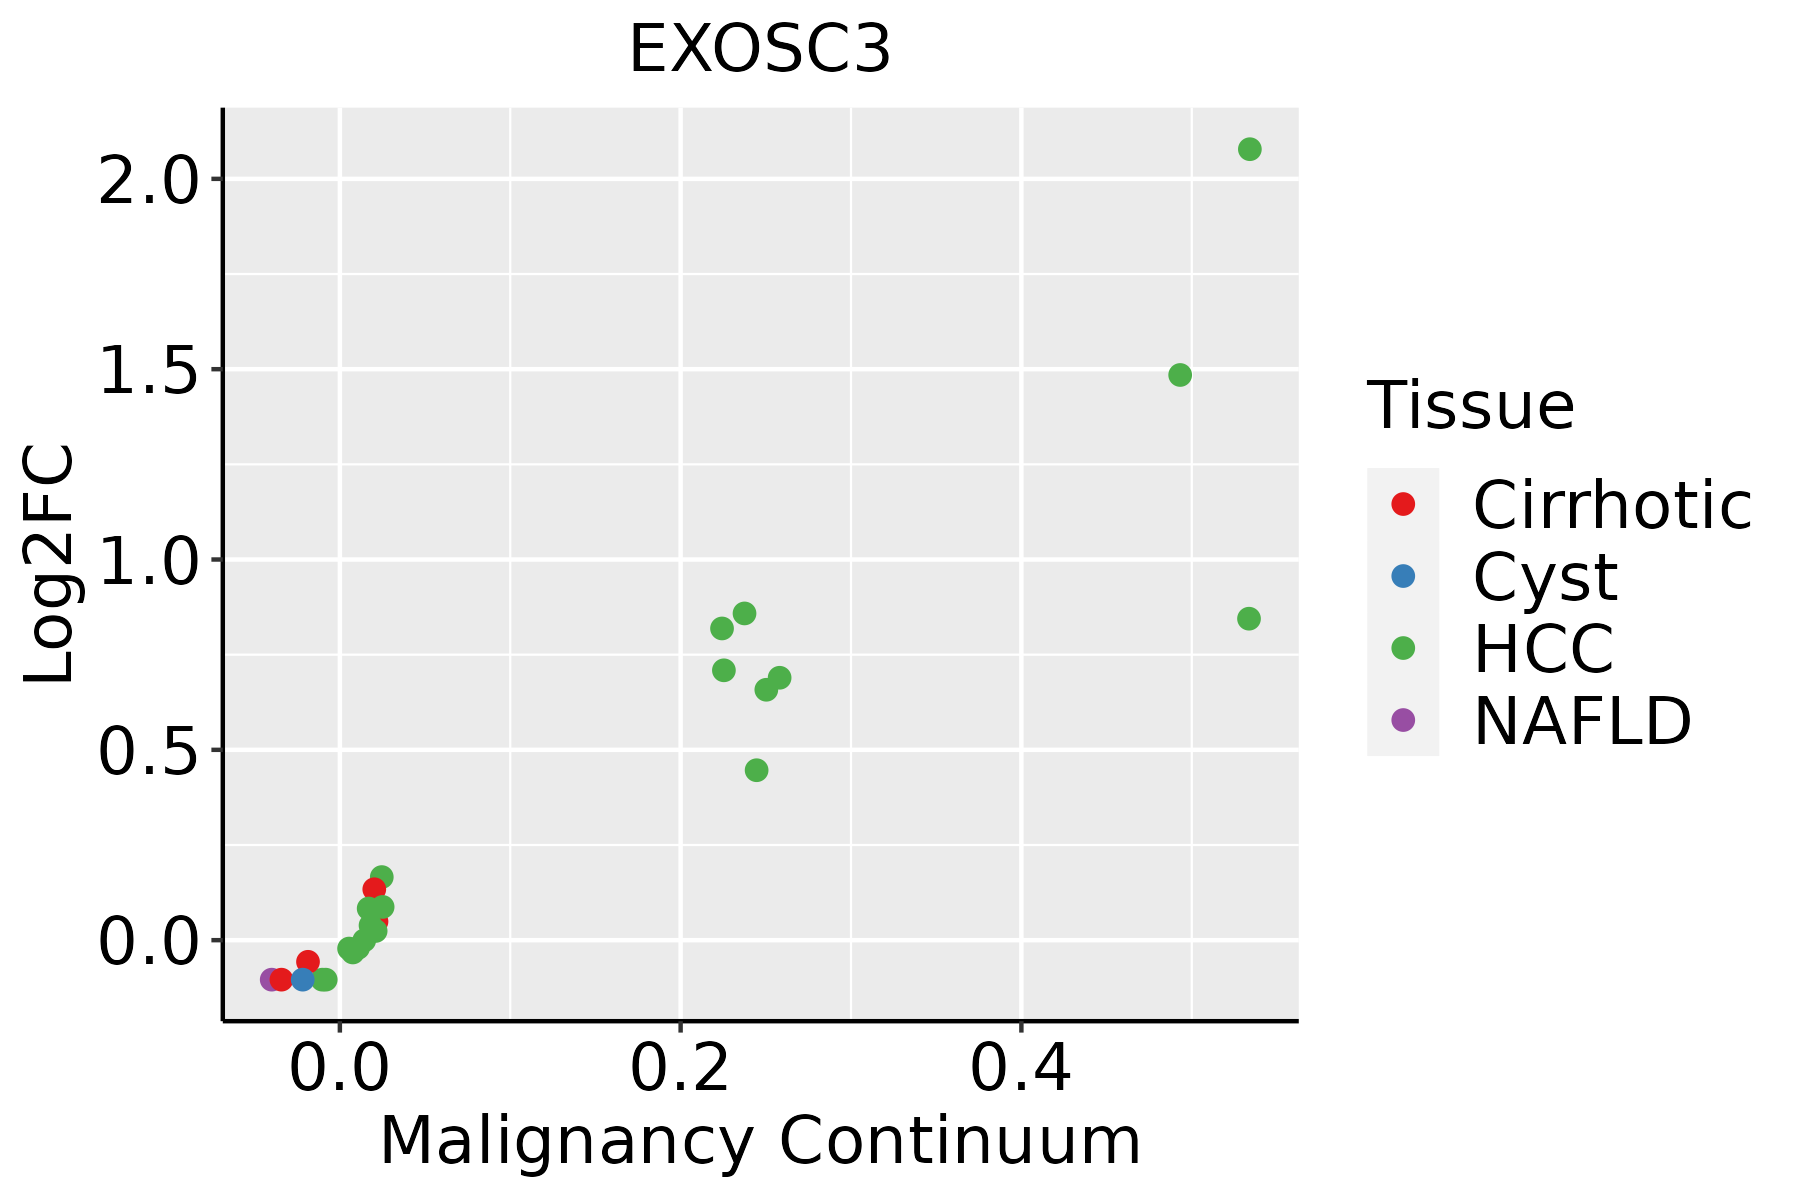 | HCC: Hepatocellular carcinoma |
| NAFLD: Non-alcoholic fatty liver disease | ||
| Oral Cavity |  | EOLP: Erosive Oral lichen planus |
| LP: leukoplakia | ||
| NEOLP: Non-erosive oral lichen planus | ||
| OSCC: Oral squamous cell carcinoma | ||
| Skin | 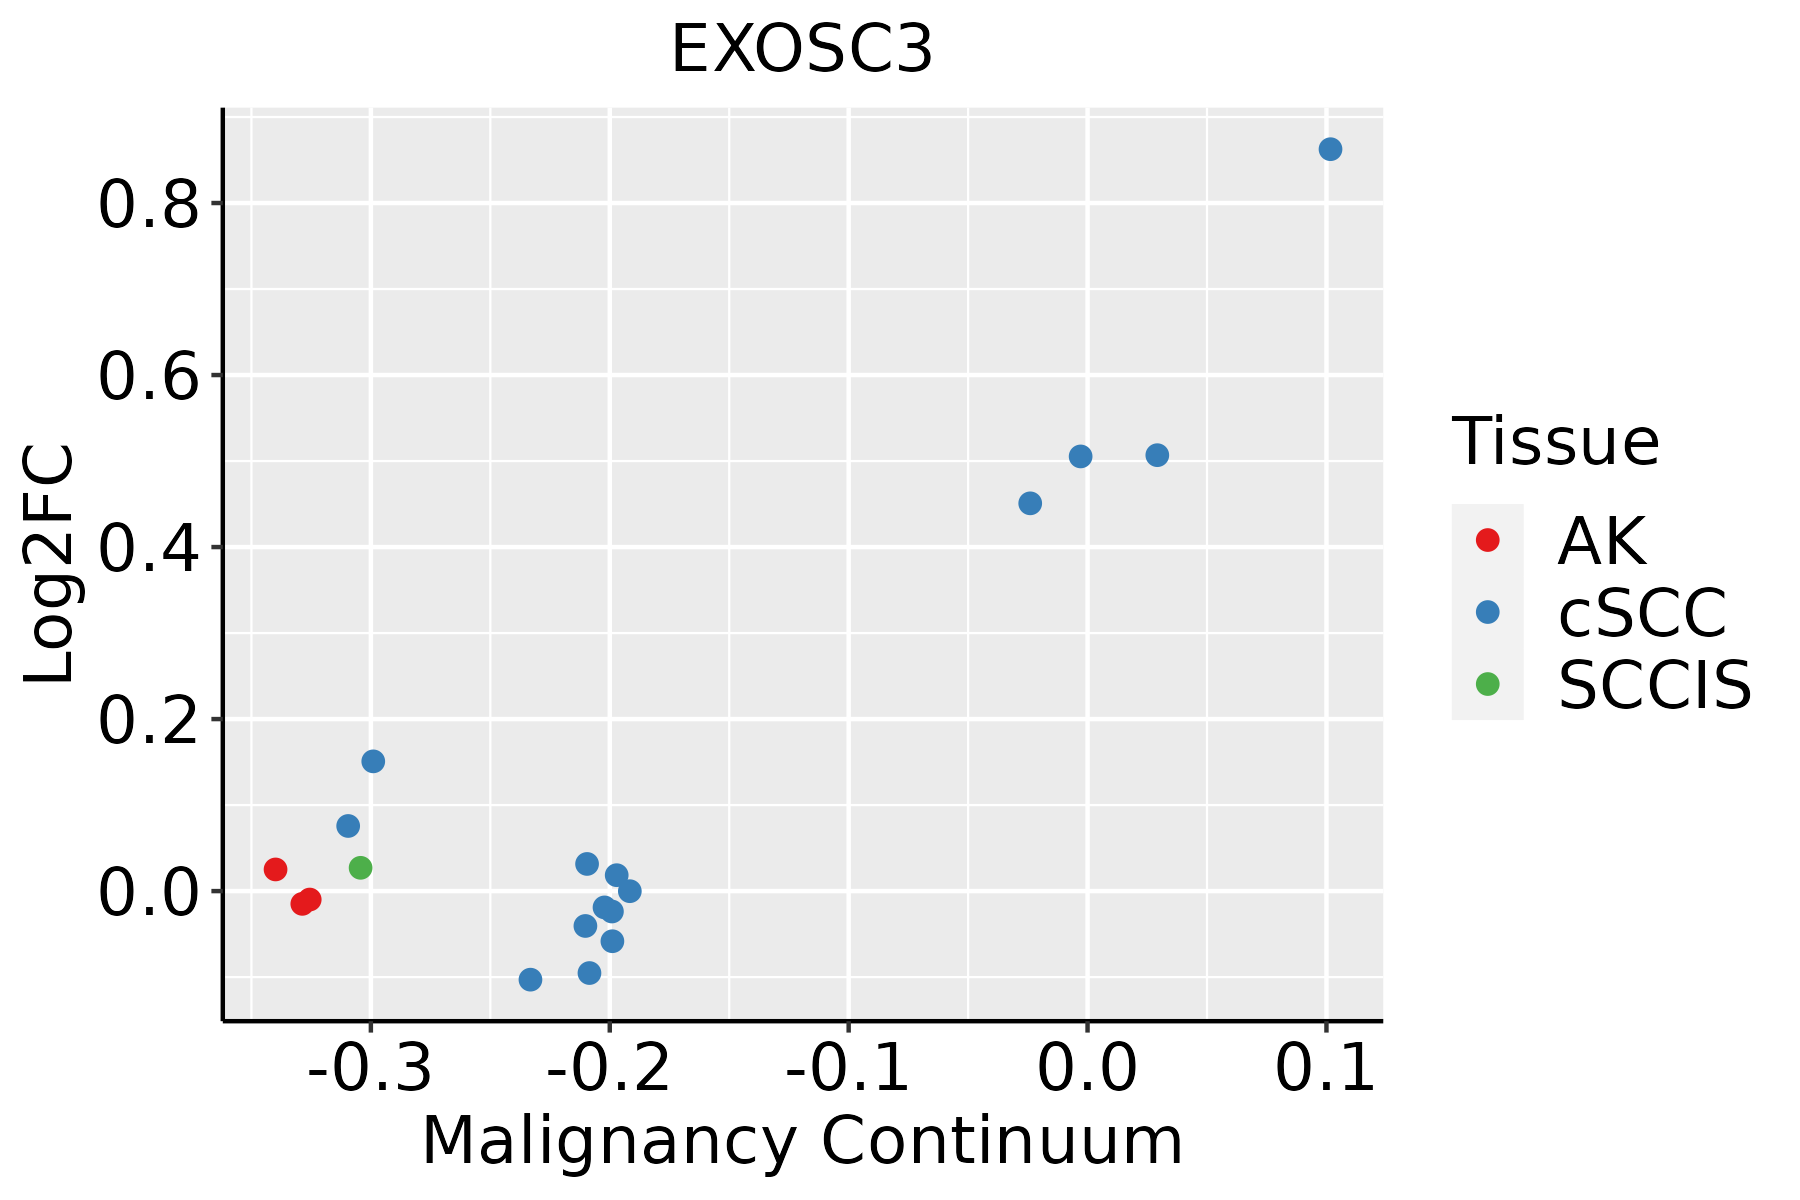 | AK: Actinic keratosis |
| cSCC: Cutaneous squamous cell carcinoma | ||
| SCCIS:squamous cell carcinoma in situ | ||
| Thyroid | 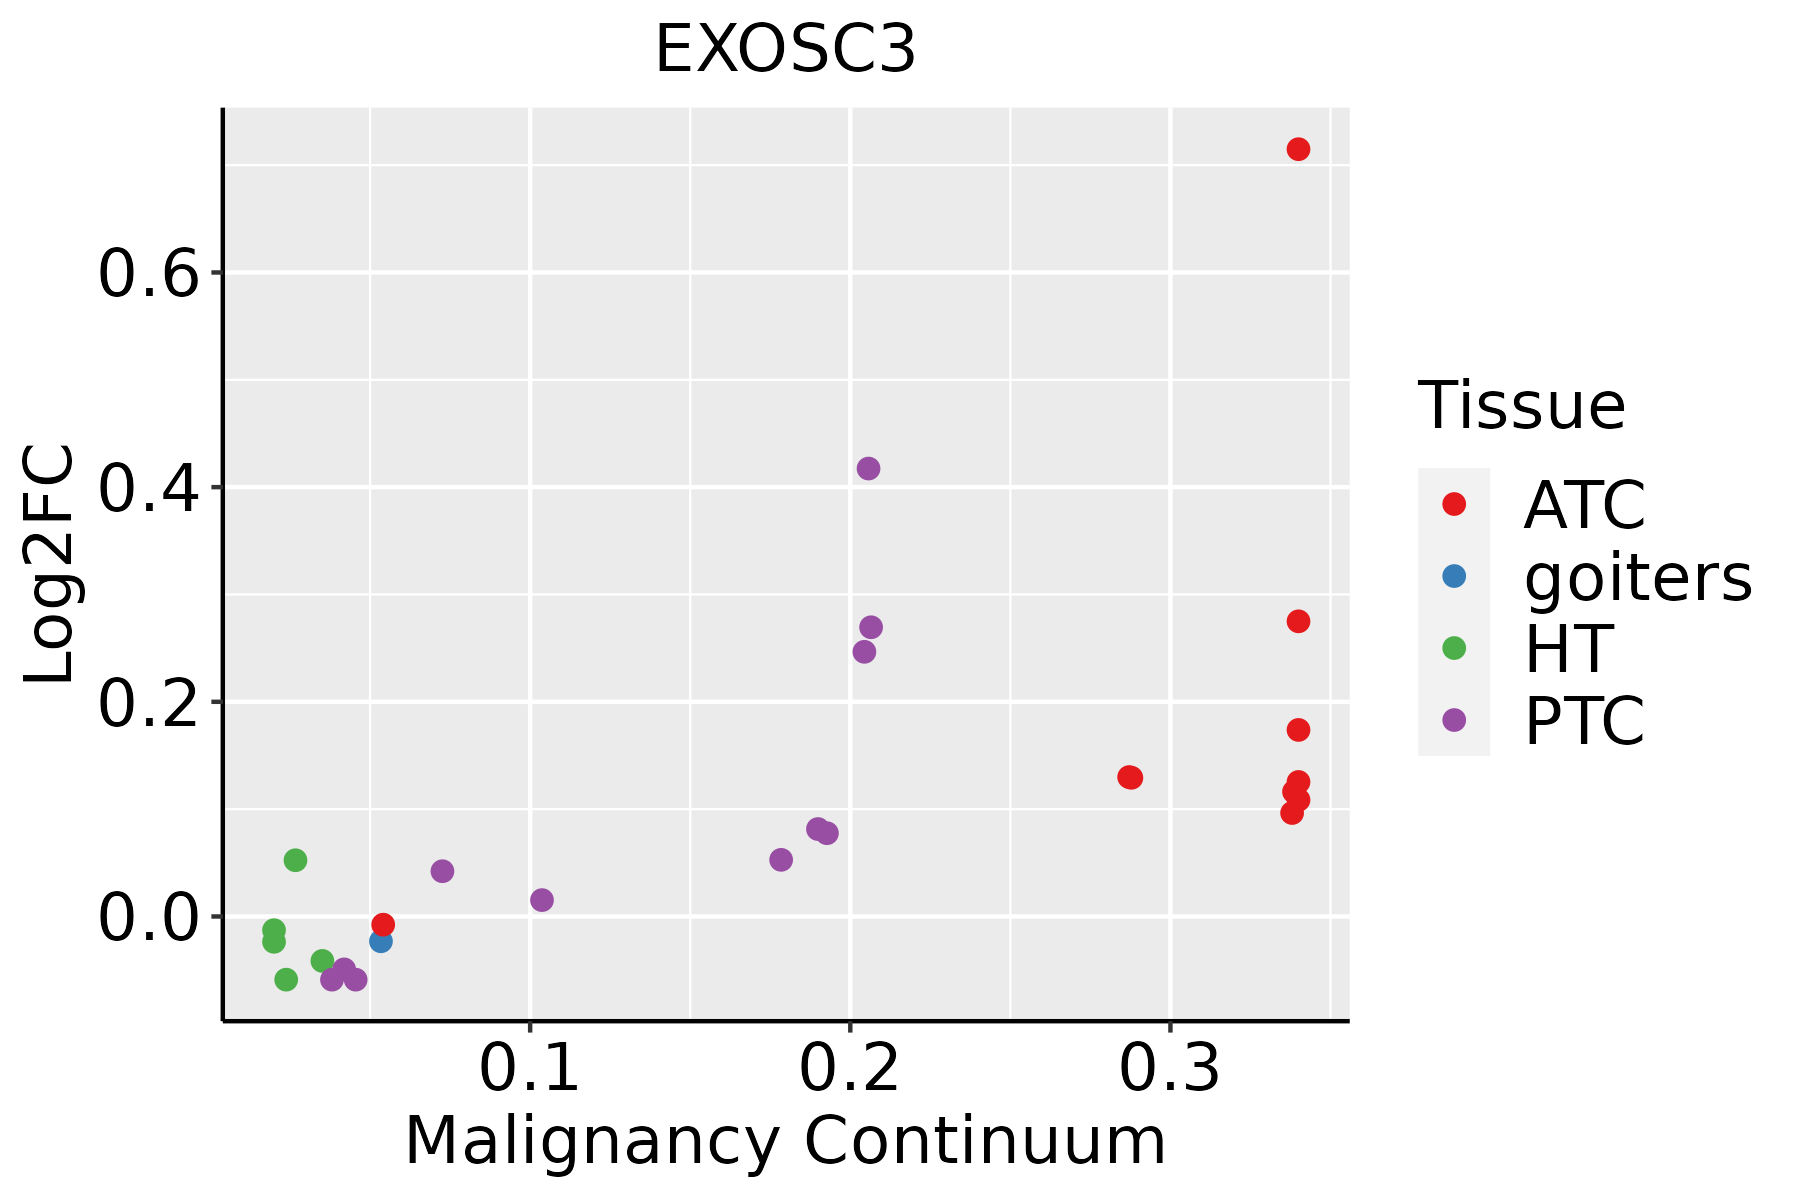 | ATC: Anaplastic thyroid cancer |
| HT: Hashimoto's thyroiditis | ||
| PTC: Papillary thyroid cancer |
| ∗log2FC in expression of this searched gene in stem-like cells from each diseased tissue sample relative to stem-like cells in normal samples in each tissue plotted against the malignancy continuum. Samples are colored based on if they are from different disease stage. |
Top |
Malignant transformation related pathway analysis |
| Find out the enriched GO biological processes and KEGG pathways involved in transition from healthy to precancer to cancer |
| Tissue | Disease Stage | Enriched GO biological Processes |
| Colorectum | AD |  |
| Colorectum | SER |  |
| Colorectum | MSS |  |
| Colorectum | MSI-H |  |
| Colorectum | FAP |  |
| ∗Top 15 enriched GO BP terms are showed in the bar plot of each disease state in each tissue. Each row represents a significant GO biological process which is colored according to the -log10(p.adjust). |
| Page: 1 2 3 4 5 6 7 8 9 |
| GO ID | Tissue | Disease Stage | Description | Gene Ratio | Bg Ratio | pvalue | p.adjust | Count |
| GO:0022613111 | Esophagus | ESCC | ribonucleoprotein complex biogenesis | 365/8552 | 463/18723 | 1.74e-49 | 1.11e-45 | 365 |
| GO:0042254111 | Esophagus | ESCC | ribosome biogenesis | 252/8552 | 299/18723 | 3.27e-44 | 1.04e-40 | 252 |
| GO:003447015 | Esophagus | ESCC | ncRNA processing | 300/8552 | 395/18723 | 3.09e-35 | 3.26e-32 | 300 |
| GO:0016072110 | Esophagus | ESCC | rRNA metabolic process | 197/8552 | 236/18723 | 1.31e-33 | 1.18e-30 | 197 |
| GO:0006364110 | Esophagus | ESCC | rRNA processing | 189/8552 | 225/18723 | 4.88e-33 | 3.87e-30 | 189 |
| GO:003466012 | Esophagus | ESCC | ncRNA metabolic process | 346/8552 | 485/18723 | 4.35e-31 | 2.51e-28 | 346 |
| GO:0006403110 | Esophagus | ESCC | RNA localization | 166/8552 | 201/18723 | 1.95e-27 | 6.18e-25 | 166 |
| GO:0009896111 | Esophagus | ESCC | positive regulation of catabolic process | 332/8552 | 492/18723 | 4.36e-23 | 9.22e-21 | 332 |
| GO:0031331111 | Esophagus | ESCC | positive regulation of cellular catabolic process | 292/8552 | 427/18723 | 8.67e-22 | 1.53e-19 | 292 |
| GO:1903311110 | Esophagus | ESCC | regulation of mRNA metabolic process | 210/8552 | 288/18723 | 3.25e-21 | 5.56e-19 | 210 |
| GO:0006401110 | Esophagus | ESCC | RNA catabolic process | 204/8552 | 278/18723 | 3.39e-21 | 5.66e-19 | 204 |
| GO:0034655110 | Esophagus | ESCC | nucleobase-containing compound catabolic process | 272/8552 | 407/18723 | 2.92e-18 | 2.90e-16 | 272 |
| GO:0006402110 | Esophagus | ESCC | mRNA catabolic process | 170/8552 | 232/18723 | 8.70e-18 | 8.00e-16 | 170 |
| GO:0006417111 | Esophagus | ESCC | regulation of translation | 304/8552 | 468/18723 | 1.53e-17 | 1.33e-15 | 304 |
| GO:004670018 | Esophagus | ESCC | heterocycle catabolic process | 286/8552 | 445/18723 | 1.12e-15 | 7.47e-14 | 286 |
| GO:004427019 | Esophagus | ESCC | cellular nitrogen compound catabolic process | 288/8552 | 451/18723 | 3.03e-15 | 1.79e-13 | 288 |
| GO:001943918 | Esophagus | ESCC | aromatic compound catabolic process | 295/8552 | 467/18723 | 1.09e-14 | 5.98e-13 | 295 |
| GO:190136118 | Esophagus | ESCC | organic cyclic compound catabolic process | 307/8552 | 495/18723 | 9.99e-14 | 4.80e-12 | 307 |
| GO:005105215 | Esophagus | ESCC | regulation of DNA metabolic process | 232/8552 | 359/18723 | 2.40e-13 | 1.13e-11 | 232 |
| GO:000095618 | Esophagus | ESCC | nuclear-transcribed mRNA catabolic process | 88/8552 | 112/18723 | 9.41e-13 | 4.14e-11 | 88 |
| Page: 1 2 3 4 5 6 7 8 9 10 11 12 13 14 15 16 17 18 19 20 21 |
| Pathway ID | Tissue | Disease Stage | Description | Gene Ratio | Bg Ratio | pvalue | p.adjust | qvalue | Count |
| hsa0301824 | Esophagus | ESCC | RNA degradation | 62/4205 | 79/8465 | 1.18e-07 | 9.39e-07 | 4.81e-07 | 62 |
| hsa0301834 | Esophagus | ESCC | RNA degradation | 62/4205 | 79/8465 | 1.18e-07 | 9.39e-07 | 4.81e-07 | 62 |
| hsa03018 | Liver | Cirrhotic | RNA degradation | 44/2530 | 79/8465 | 1.43e-06 | 1.65e-05 | 1.02e-05 | 44 |
| hsa030181 | Liver | Cirrhotic | RNA degradation | 44/2530 | 79/8465 | 1.43e-06 | 1.65e-05 | 1.02e-05 | 44 |
| hsa030182 | Liver | HCC | RNA degradation | 58/4020 | 79/8465 | 2.29e-06 | 2.19e-05 | 1.22e-05 | 58 |
| hsa030183 | Liver | HCC | RNA degradation | 58/4020 | 79/8465 | 2.29e-06 | 2.19e-05 | 1.22e-05 | 58 |
| hsa030189 | Oral cavity | OSCC | RNA degradation | 59/3704 | 79/8465 | 2.05e-08 | 1.91e-07 | 9.70e-08 | 59 |
| hsa0301814 | Oral cavity | OSCC | RNA degradation | 59/3704 | 79/8465 | 2.05e-08 | 1.91e-07 | 9.70e-08 | 59 |
| hsa0301823 | Oral cavity | LP | RNA degradation | 39/2418 | 79/8465 | 6.98e-05 | 4.38e-04 | 2.83e-04 | 39 |
| hsa0301833 | Oral cavity | LP | RNA degradation | 39/2418 | 79/8465 | 6.98e-05 | 4.38e-04 | 2.83e-04 | 39 |
| Page: 1 |
Top |
Cell-cell communication analysis |
| Identification of potential cell-cell interactions between two cell types and their ligand-receptor pairs for different disease states |
| Ligand | Receptor | LRpair | Pathway | Tissue | Disease Stage |
| Page: 1 |
Top |
Single-cell gene regulatory network inference analysis |
| Find out the significant the regulons (TFs) and the target genes of each regulon across cell types for different disease states |
| TF | Cell Type | Tissue | Disease Stage | Target Gene | RSS | Regulon Activity |
| EXOSC3 | MEGA | Lung | ADJ | LILRA2,GLT1D1,CCDC138, etc. | 4.40e-02 |  |
| EXOSC3 | LYMEND | Lung | ADJ | LILRA2,GLT1D1,CCDC138, etc. | 6.45e-02 | |
| EXOSC3 | LYMEND | Lung | AIS | LILRA2,GLT1D1,CCDC138, etc. | 3.10e-02 |  |
| EXOSC3 | MEGA | Lung | AIS | LILRA2,GLT1D1,CCDC138, etc. | 8.20e-03 | |
| EXOSC3 | ADIPO | Lung | Healthy | LILRA2,GLT1D1,CCDC138, etc. | 2.10e-02 |  |
| EXOSC3 | LYMEND | Lung | IAC | LILRA2,GLT1D1,CCDC138, etc. | 2.50e-02 |  |
| EXOSC3 | MEGA | Lung | IAC | LILRA2,GLT1D1,CCDC138, etc. | 6.48e-03 | |
| EXOSC3 | LYMEND | Lung | MIAC | LILRA2,GLT1D1,CCDC138, etc. | 2.89e-02 |  |
| EXOSC3 | MEGA | Lung | MIAC | LILRA2,GLT1D1,CCDC138, etc. | 0.00e+00 | |
| ∗The dot plots of a searched regulon are shown for all cell subpopulations in each disease state of each tissue based on the regulon specific score inferred using pySCENIC and by calculating the average expression. |
| Page: 1 |
Top |
Somatic mutation of malignant transformation related genes |
| Annotation of somatic variants for genes involved in malignant transformation |
| Hugo Symbol | Variant Class | Variant Classification | dbSNP RS | HGVSc | HGVSp | HGVSp Short | SWISSPROT | BIOTYPE | SIFT | PolyPhen | Tumor Sample Barcode | Tissue | Histology | Sex | Age | Stage | Therapy Types | Drugs | Outcome |
| EXOSC3 | SNV | Missense_Mutation | rs777930611 | c.19G>A | p.Val7Ile | p.V7I | Q9NQT5 | protein_coding | tolerated_low_confidence(0.13) | benign(0) | TCGA-LL-A8F5-01 | Breast | breast invasive carcinoma | Female | <65 | I/II | Chemotherapy | cyclophosphamide | SD |
| EXOSC3 | SNV | Missense_Mutation | c.807C>G | p.Phe269Leu | p.F269L | Q9NQT5 | protein_coding | tolerated(1) | benign(0.015) | TCGA-FU-A3HY-01 | Cervix | cervical & endocervical cancer | Female | <65 | I/II | Chemotherapy | cisplatin | CR | |
| EXOSC3 | SNV | Missense_Mutation | c.137N>A | p.Gly46Glu | p.G46E | Q9NQT5 | protein_coding | tolerated(0.06) | benign(0.003) | TCGA-G4-6302-01 | Colorectum | colon adenocarcinoma | Female | >=65 | I/II | Unknown | Unknown | SD | |
| EXOSC3 | SNV | Missense_Mutation | rs145622193 | c.361G>A | p.Val121Met | p.V121M | Q9NQT5 | protein_coding | deleterious(0) | probably_damaging(0.999) | TCGA-WS-AB45-01 | Colorectum | colon adenocarcinoma | Female | <65 | I/II | Unknown | Unknown | SD |
| EXOSC3 | SNV | Missense_Mutation | novel | c.374N>T | p.Ser125Phe | p.S125F | Q9NQT5 | protein_coding | deleterious(0) | possibly_damaging(0.773) | TCGA-A5-A0G2-01 | Endometrium | uterine corpus endometrioid carcinoma | Female | <65 | III/IV | Unknown | Unknown | SD |
| EXOSC3 | SNV | Missense_Mutation | novel | c.32N>A | p.Ser11Tyr | p.S11Y | Q9NQT5 | protein_coding | tolerated_low_confidence(1) | benign(0.034) | TCGA-AX-A1CE-01 | Endometrium | uterine corpus endometrioid carcinoma | Female | <65 | I/II | Unspecific | Paclitaxel | SD |
| EXOSC3 | SNV | Missense_Mutation | rs565950496 | c.7N>A | p.Glu3Lys | p.E3K | Q9NQT5 | protein_coding | deleterious_low_confidence(0) | benign(0.037) | TCGA-DI-A1BU-01 | Endometrium | uterine corpus endometrioid carcinoma | Female | <65 | I/II | Chemotherapy | paclitaxel | SD |
| EXOSC3 | SNV | Missense_Mutation | novel | c.455N>T | p.Arg152Ile | p.R152I | Q9NQT5 | protein_coding | deleterious(0) | probably_damaging(0.956) | TCGA-EY-A1GI-01 | Endometrium | uterine corpus endometrioid carcinoma | Female | <65 | I/II | Unknown | Unknown | SD |
| EXOSC3 | SNV | Missense_Mutation | novel | c.433N>G | p.Ser145Ala | p.S145A | Q9NQT5 | protein_coding | tolerated(1) | benign(0) | TCGA-FI-A2D0-01 | Endometrium | uterine corpus endometrioid carcinoma | Female | <65 | I/II | Unknown | Unknown | SD |
| EXOSC3 | SNV | Missense_Mutation | c.47G>A | p.Arg16Lys | p.R16K | Q9NQT5 | protein_coding | tolerated_low_confidence(0.49) | benign(0) | TCGA-FV-A3I1-01 | Liver | liver hepatocellular carcinoma | Female | >=65 | I/II | Unknown | Unknown | SD |
| Page: 1 2 |
Top |
Related drugs of malignant transformation related genes |
| Identification of chemicals and drugs interact with genes involved in malignant transfromation |
| (DGIdb 4.0) |
| Entrez ID | Symbol | Category | Interaction Types | Drug Claim Name | Drug Name | PMIDs |
| Page: 1 |

Copyright 2023-Present -The University of Texas Health Science Center at Houston |