
|
|||||
|
 | |
| |
| |
| |
| |
| |
|
Gene: EXOC7 |
Gene summary for EXOC7 |
| Gene information | Species | Human | Gene symbol | EXOC7 | Gene ID | 23265 |
| Gene name | exocyst complex component 7 | |
| Gene Alias | 2-5-3p | |
| Cytomap | 17q25.1 | |
| Gene Type | protein-coding | GO ID | GO:0006810 | UniProtAcc | Q63HP7 |
Top |
Malignant transformation analysis |
| Identification of the aberrant gene expression in precancerous and cancerous lesions by comparing the gene expression of stem-like cells in diseased tissues with normal stem cells |
| Entrez ID | Symbol | Replicates | Species | Organ | Tissue | Adj P-value | Log2FC | Malignancy |
| 23265 | EXOC7 | LZE4T | Human | Esophagus | ESCC | 4.05e-12 | 2.34e-01 | 0.0811 |
| 23265 | EXOC7 | LZE7T | Human | Esophagus | ESCC | 1.55e-09 | 4.73e-01 | 0.0667 |
| 23265 | EXOC7 | LZE8T | Human | Esophagus | ESCC | 4.99e-06 | 2.49e-01 | 0.067 |
| 23265 | EXOC7 | LZE20T | Human | Esophagus | ESCC | 1.45e-03 | 1.55e-01 | 0.0662 |
| 23265 | EXOC7 | LZE22D1 | Human | Esophagus | HGIN | 4.88e-02 | 7.26e-02 | 0.0595 |
| 23265 | EXOC7 | LZE22T | Human | Esophagus | ESCC | 1.72e-04 | 2.94e-01 | 0.068 |
| 23265 | EXOC7 | LZE24T | Human | Esophagus | ESCC | 1.33e-17 | 4.87e-01 | 0.0596 |
| 23265 | EXOC7 | LZE21T | Human | Esophagus | ESCC | 8.60e-10 | 4.20e-01 | 0.0655 |
| 23265 | EXOC7 | LZE6T | Human | Esophagus | ESCC | 9.90e-06 | 2.22e-01 | 0.0845 |
| 23265 | EXOC7 | P1T-E | Human | Esophagus | ESCC | 1.17e-08 | 3.94e-01 | 0.0875 |
| 23265 | EXOC7 | P2T-E | Human | Esophagus | ESCC | 8.91e-24 | 5.23e-01 | 0.1177 |
| 23265 | EXOC7 | P4T-E | Human | Esophagus | ESCC | 2.51e-12 | 8.85e-02 | 0.1323 |
| 23265 | EXOC7 | P5T-E | Human | Esophagus | ESCC | 4.74e-13 | 2.52e-02 | 0.1327 |
| 23265 | EXOC7 | P8T-E | Human | Esophagus | ESCC | 2.64e-27 | 5.08e-01 | 0.0889 |
| 23265 | EXOC7 | P9T-E | Human | Esophagus | ESCC | 7.31e-13 | 1.80e-01 | 0.1131 |
| 23265 | EXOC7 | P10T-E | Human | Esophagus | ESCC | 2.94e-19 | 3.75e-01 | 0.116 |
| 23265 | EXOC7 | P11T-E | Human | Esophagus | ESCC | 2.04e-14 | 7.83e-01 | 0.1426 |
| 23265 | EXOC7 | P12T-E | Human | Esophagus | ESCC | 2.76e-31 | 3.96e-01 | 0.1122 |
| 23265 | EXOC7 | P15T-E | Human | Esophagus | ESCC | 1.27e-19 | 5.35e-01 | 0.1149 |
| 23265 | EXOC7 | P16T-E | Human | Esophagus | ESCC | 9.47e-22 | 3.96e-01 | 0.1153 |
| Page: 1 2 3 4 5 6 7 |
| Tissue | Expression Dynamics | Abbreviation |
| Esophagus | 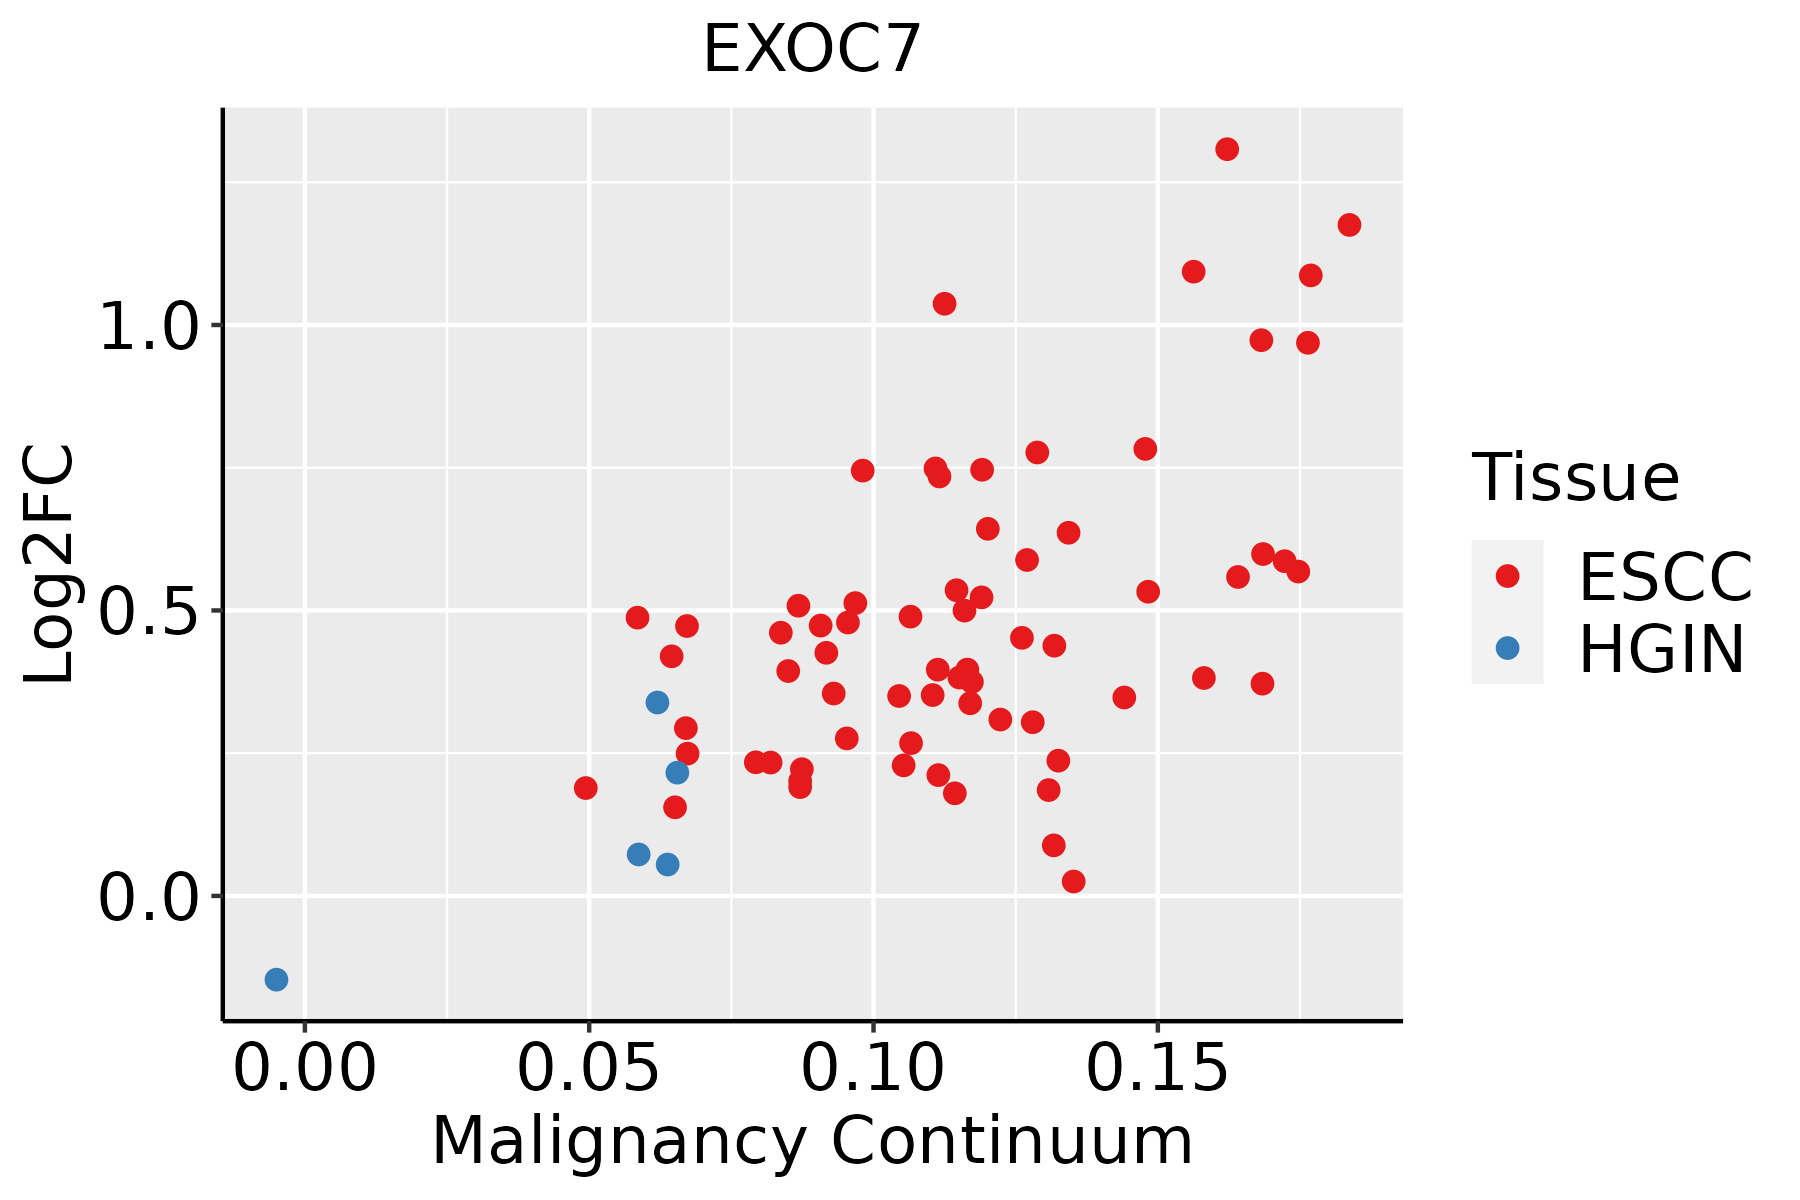 | ESCC: Esophageal squamous cell carcinoma |
| HGIN: High-grade intraepithelial neoplasias | ||
| LGIN: Low-grade intraepithelial neoplasias | ||
| Liver |  | HCC: Hepatocellular carcinoma |
| NAFLD: Non-alcoholic fatty liver disease | ||
| Oral Cavity | 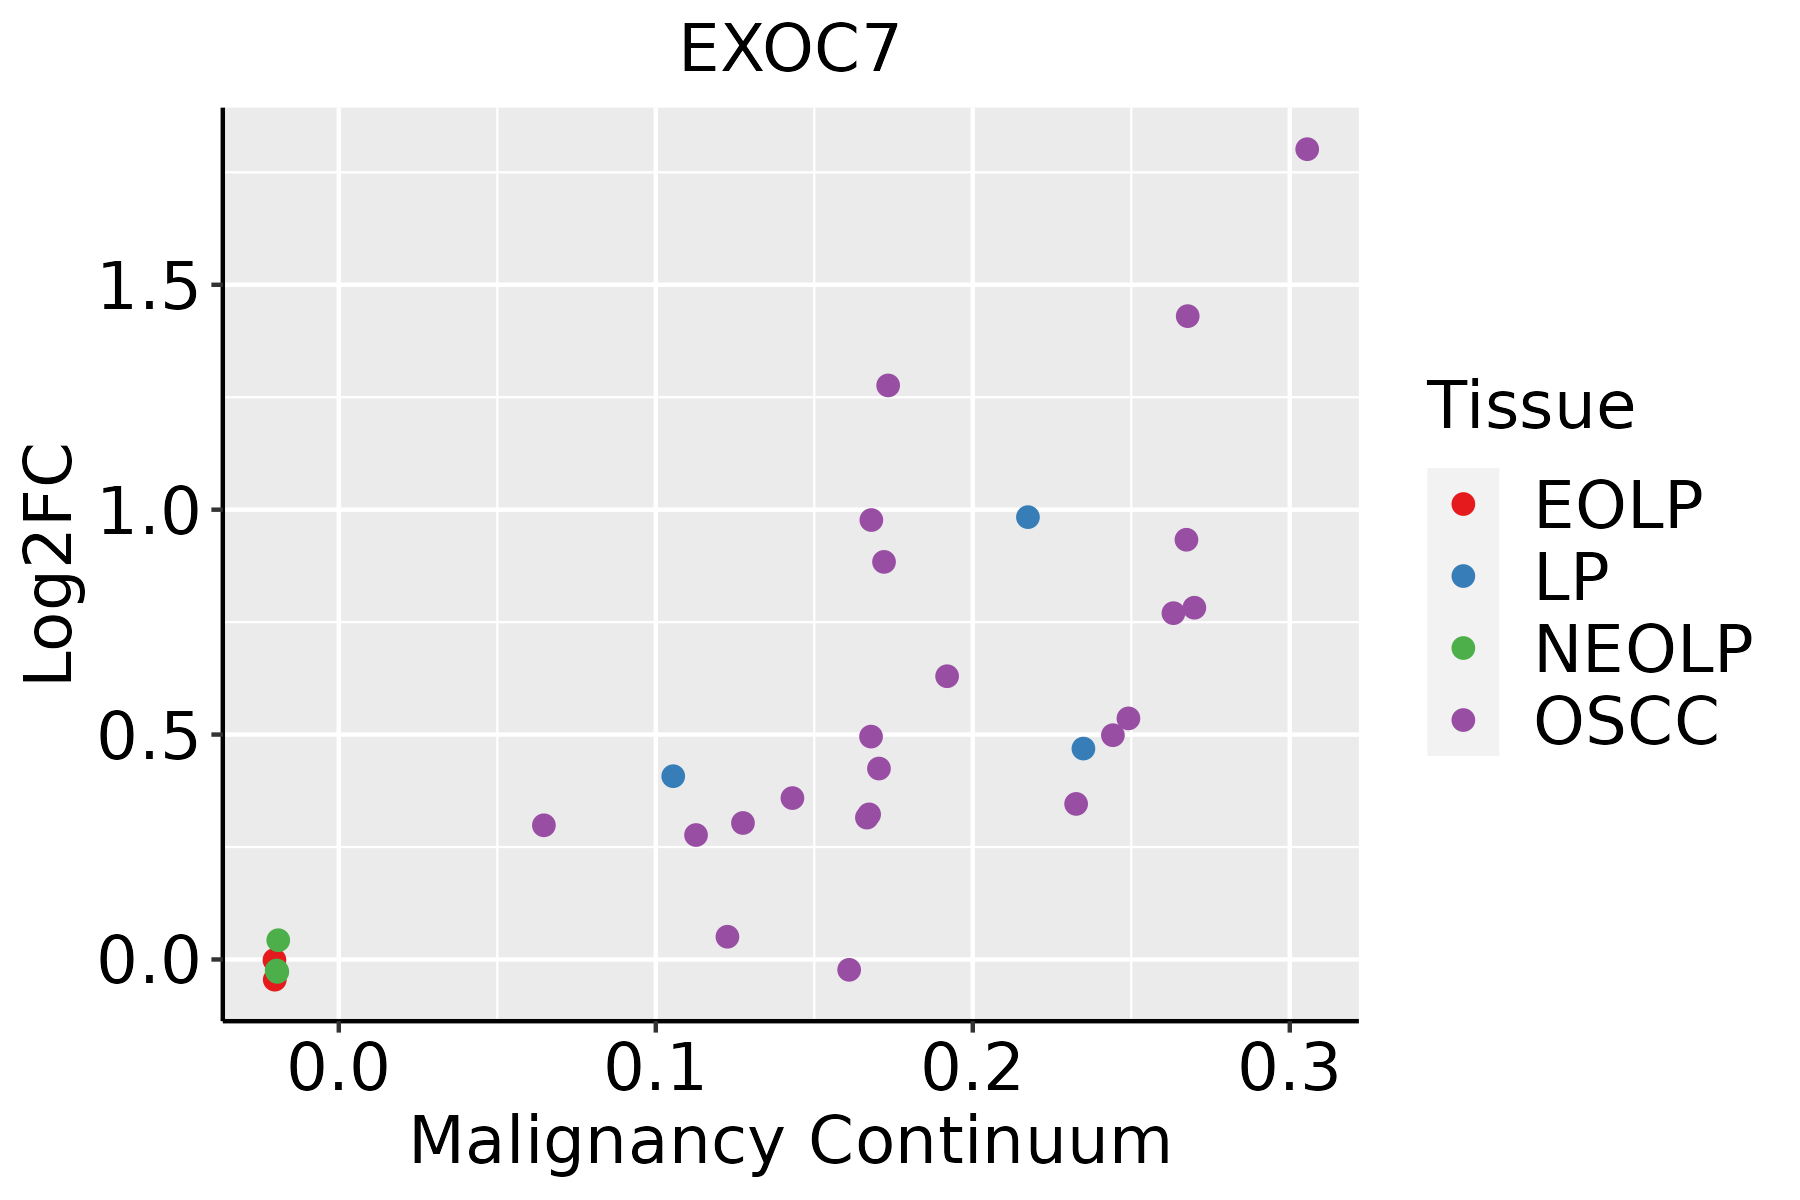 | EOLP: Erosive Oral lichen planus |
| LP: leukoplakia | ||
| NEOLP: Non-erosive oral lichen planus | ||
| OSCC: Oral squamous cell carcinoma | ||
| Prostate | 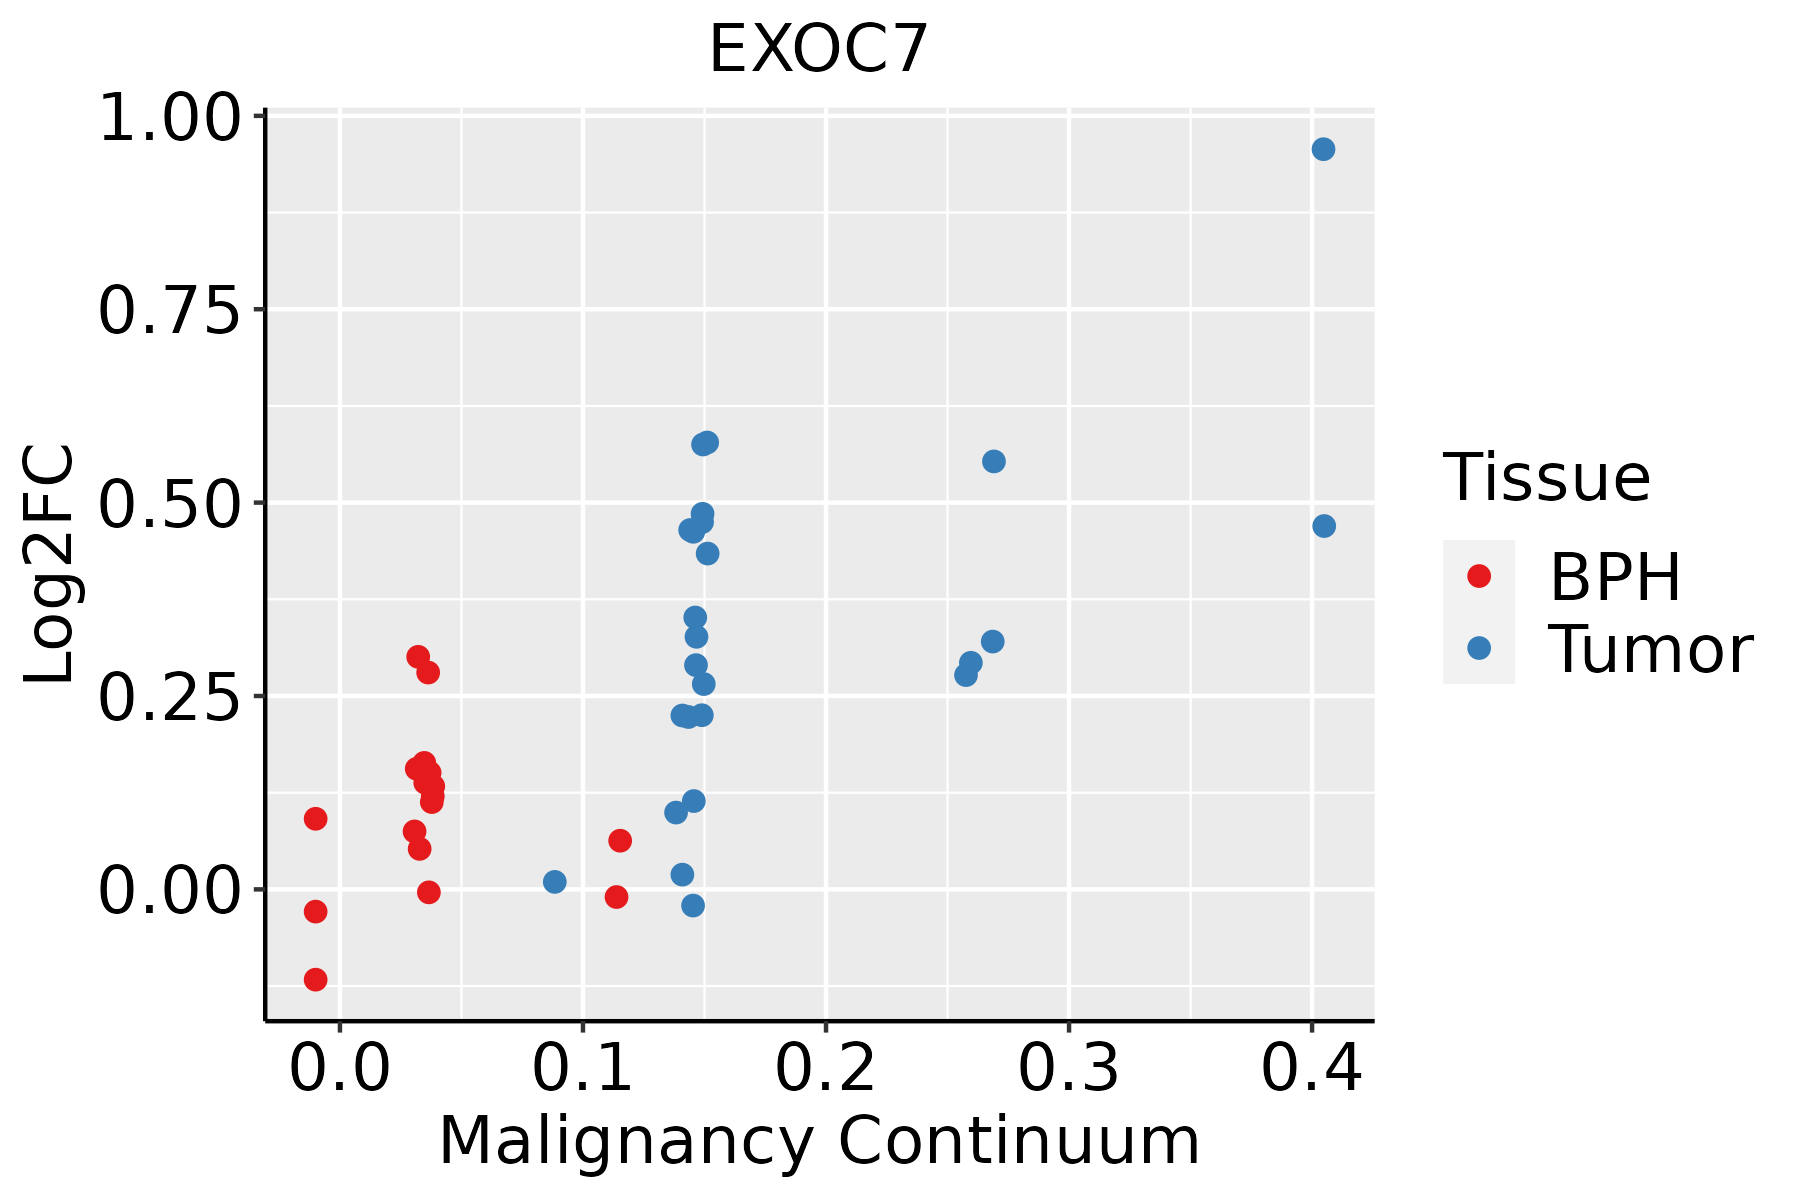 | BPH: Benign Prostatic Hyperplasia |
| Skin | 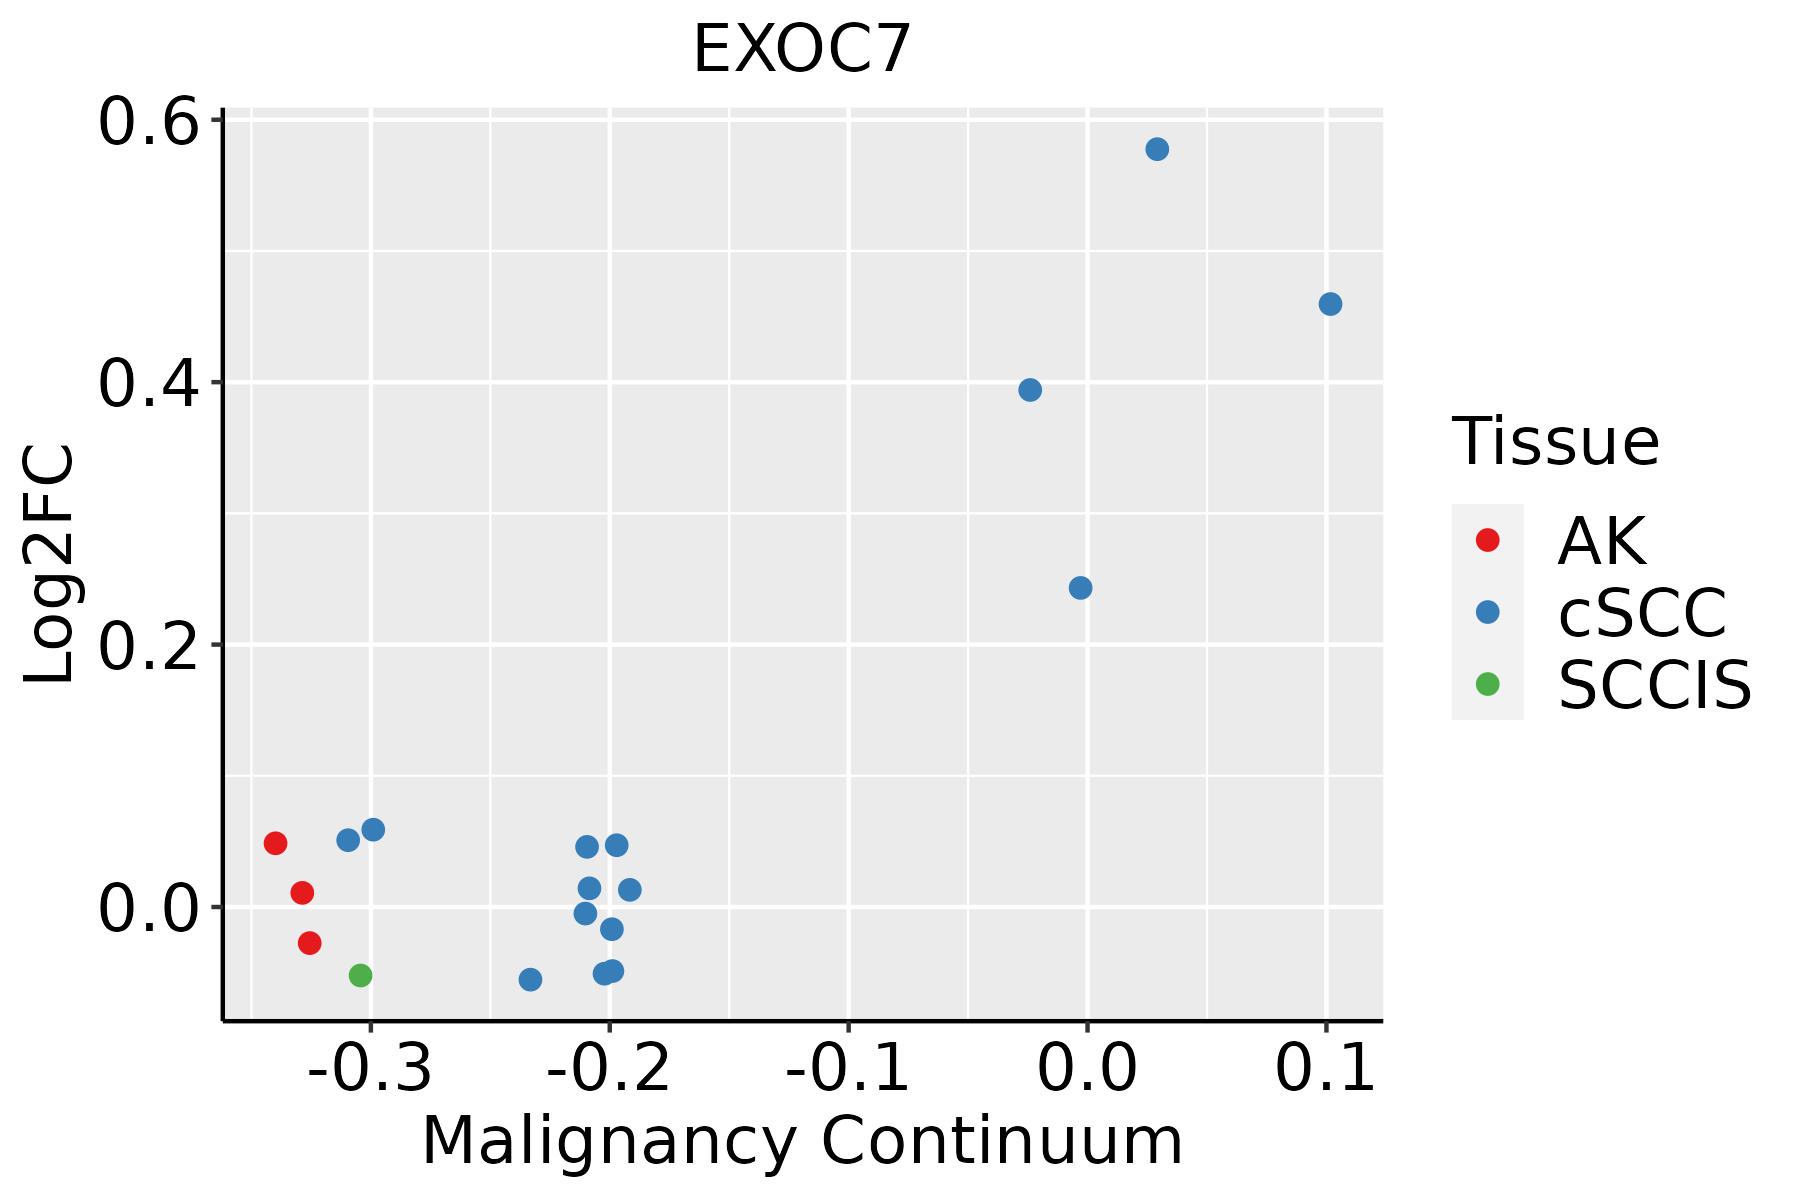 | AK: Actinic keratosis |
| cSCC: Cutaneous squamous cell carcinoma | ||
| SCCIS:squamous cell carcinoma in situ | ||
| Thyroid |  | ATC: Anaplastic thyroid cancer |
| HT: Hashimoto's thyroiditis | ||
| PTC: Papillary thyroid cancer |
| ∗log2FC in expression of this searched gene in stem-like cells from each diseased tissue sample relative to stem-like cells in normal samples in each tissue plotted against the malignancy continuum. Samples are colored based on if they are from different disease stage. |
Top |
Malignant transformation related pathway analysis |
| Find out the enriched GO biological processes and KEGG pathways involved in transition from healthy to precancer to cancer |
| Tissue | Disease Stage | Enriched GO biological Processes |
| Colorectum | AD |  |
| Colorectum | SER |  |
| Colorectum | MSS |  |
| Colorectum | MSI-H |  |
| Colorectum | FAP |  |
| ∗Top 15 enriched GO BP terms are showed in the bar plot of each disease state in each tissue. Each row represents a significant GO biological process which is colored according to the -log10(p.adjust). |
| Page: 1 2 3 4 5 6 7 8 9 |
| GO ID | Tissue | Disease Stage | Description | Gene Ratio | Bg Ratio | pvalue | p.adjust | Count |
| GO:001050616 | Esophagus | HGIN | regulation of autophagy | 84/2587 | 317/18723 | 1.39e-09 | 1.08e-07 | 84 |
| GO:001623616 | Esophagus | HGIN | macroautophagy | 77/2587 | 291/18723 | 7.15e-09 | 4.61e-07 | 77 |
| GO:004440326 | Esophagus | HGIN | biological process involved in symbiotic interaction | 71/2587 | 290/18723 | 7.09e-07 | 3.00e-05 | 71 |
| GO:005170127 | Esophagus | HGIN | biological process involved in interaction with host | 51/2587 | 203/18723 | 1.16e-05 | 3.29e-04 | 51 |
| GO:00162418 | Esophagus | HGIN | regulation of macroautophagy | 38/2587 | 141/18723 | 2.80e-05 | 7.21e-04 | 38 |
| GO:005212627 | Esophagus | HGIN | movement in host environment | 43/2587 | 175/18723 | 9.45e-05 | 2.03e-03 | 43 |
| GO:004390320 | Esophagus | HGIN | regulation of biological process involved in symbiotic interaction | 20/2587 | 72/18723 | 1.39e-03 | 1.63e-02 | 20 |
| GO:004440927 | Esophagus | HGIN | entry into host | 34/2587 | 151/18723 | 2.43e-03 | 2.43e-02 | 34 |
| GO:001623617 | Esophagus | ESCC | macroautophagy | 216/8552 | 291/18723 | 1.94e-23 | 4.57e-21 | 216 |
| GO:001050617 | Esophagus | ESCC | regulation of autophagy | 220/8552 | 317/18723 | 6.72e-18 | 6.36e-16 | 220 |
| GO:001624114 | Esophagus | ESCC | regulation of macroautophagy | 102/8552 | 141/18723 | 1.09e-10 | 3.27e-09 | 102 |
| GO:0044403111 | Esophagus | ESCC | biological process involved in symbiotic interaction | 186/8552 | 290/18723 | 1.43e-10 | 4.16e-09 | 186 |
| GO:0051701111 | Esophagus | ESCC | biological process involved in interaction with host | 135/8552 | 203/18723 | 1.49e-09 | 3.49e-08 | 135 |
| GO:0052126111 | Esophagus | ESCC | movement in host environment | 117/8552 | 175/18723 | 1.14e-08 | 2.26e-07 | 117 |
| GO:0044409111 | Esophagus | ESCC | entry into host | 96/8552 | 151/18723 | 6.73e-06 | 6.84e-05 | 96 |
| GO:0043903111 | Esophagus | ESCC | regulation of biological process involved in symbiotic interaction | 49/8552 | 72/18723 | 1.03e-04 | 7.26e-04 | 49 |
| GO:005237219 | Esophagus | ESCC | modulation by symbiont of entry into host | 32/8552 | 49/18723 | 4.39e-03 | 1.73e-02 | 32 |
| GO:004440312 | Liver | Cirrhotic | biological process involved in symbiotic interaction | 131/4634 | 290/18723 | 2.00e-14 | 1.84e-12 | 131 |
| GO:001623611 | Liver | Cirrhotic | macroautophagy | 129/4634 | 291/18723 | 1.75e-13 | 1.41e-11 | 129 |
| GO:001050611 | Liver | Cirrhotic | regulation of autophagy | 132/4634 | 317/18723 | 2.17e-11 | 1.33e-09 | 132 |
| Page: 1 2 3 4 5 |
| Pathway ID | Tissue | Disease Stage | Description | Gene Ratio | Bg Ratio | pvalue | p.adjust | qvalue | Count |
| hsa0513239 | Esophagus | HGIN | Salmonella infection | 69/1383 | 249/8465 | 3.02e-06 | 4.47e-05 | 3.55e-05 | 69 |
| hsa05132115 | Esophagus | HGIN | Salmonella infection | 69/1383 | 249/8465 | 3.02e-06 | 4.47e-05 | 3.55e-05 | 69 |
| hsa05132211 | Esophagus | ESCC | Salmonella infection | 191/4205 | 249/8465 | 6.51e-19 | 5.45e-17 | 2.79e-17 | 191 |
| hsa049109 | Esophagus | ESCC | Insulin signaling pathway | 89/4205 | 137/8465 | 1.97e-04 | 7.32e-04 | 3.75e-04 | 89 |
| hsa05132310 | Esophagus | ESCC | Salmonella infection | 191/4205 | 249/8465 | 6.51e-19 | 5.45e-17 | 2.79e-17 | 191 |
| hsa0491014 | Esophagus | ESCC | Insulin signaling pathway | 89/4205 | 137/8465 | 1.97e-04 | 7.32e-04 | 3.75e-04 | 89 |
| hsa0513222 | Liver | Cirrhotic | Salmonella infection | 121/2530 | 249/8465 | 2.47e-10 | 5.13e-09 | 3.16e-09 | 121 |
| hsa0491021 | Liver | Cirrhotic | Insulin signaling pathway | 56/2530 | 137/8465 | 3.74e-03 | 1.50e-02 | 9.26e-03 | 56 |
| hsa0513232 | Liver | Cirrhotic | Salmonella infection | 121/2530 | 249/8465 | 2.47e-10 | 5.13e-09 | 3.16e-09 | 121 |
| hsa0491031 | Liver | Cirrhotic | Insulin signaling pathway | 56/2530 | 137/8465 | 3.74e-03 | 1.50e-02 | 9.26e-03 | 56 |
| hsa0513242 | Liver | HCC | Salmonella infection | 178/4020 | 249/8465 | 5.90e-15 | 1.98e-13 | 1.10e-13 | 178 |
| hsa0491041 | Liver | HCC | Insulin signaling pathway | 95/4020 | 137/8465 | 1.53e-07 | 1.97e-06 | 1.10e-06 | 95 |
| hsa0513252 | Liver | HCC | Salmonella infection | 178/4020 | 249/8465 | 5.90e-15 | 1.98e-13 | 1.10e-13 | 178 |
| hsa0491051 | Liver | HCC | Insulin signaling pathway | 95/4020 | 137/8465 | 1.53e-07 | 1.97e-06 | 1.10e-06 | 95 |
| hsa0513230 | Oral cavity | OSCC | Salmonella infection | 174/3704 | 249/8465 | 2.67e-17 | 1.49e-15 | 7.58e-16 | 174 |
| hsa049108 | Oral cavity | OSCC | Insulin signaling pathway | 83/3704 | 137/8465 | 4.83e-05 | 2.00e-04 | 1.02e-04 | 83 |
| hsa05132114 | Oral cavity | OSCC | Salmonella infection | 174/3704 | 249/8465 | 2.67e-17 | 1.49e-15 | 7.58e-16 | 174 |
| hsa0491013 | Oral cavity | OSCC | Insulin signaling pathway | 83/3704 | 137/8465 | 4.83e-05 | 2.00e-04 | 1.02e-04 | 83 |
| hsa05132210 | Oral cavity | LP | Salmonella infection | 128/2418 | 249/8465 | 1.17e-14 | 2.79e-13 | 1.80e-13 | 128 |
| hsa0513238 | Oral cavity | LP | Salmonella infection | 128/2418 | 249/8465 | 1.17e-14 | 2.79e-13 | 1.80e-13 | 128 |
| Page: 1 2 |
Top |
Cell-cell communication analysis |
| Identification of potential cell-cell interactions between two cell types and their ligand-receptor pairs for different disease states |
| Ligand | Receptor | LRpair | Pathway | Tissue | Disease Stage |
| Page: 1 |
Top |
Single-cell gene regulatory network inference analysis |
| Find out the significant the regulons (TFs) and the target genes of each regulon across cell types for different disease states |
| TF | Cell Type | Tissue | Disease Stage | Target Gene | RSS | Regulon Activity |
| ∗The dot plots of a searched regulon are shown for all cell subpopulations in each disease state of each tissue based on the regulon specific score inferred using pySCENIC and by calculating the average expression. |
| Page: 1 |
Top |
Somatic mutation of malignant transformation related genes |
| Annotation of somatic variants for genes involved in malignant transformation |
| Hugo Symbol | Variant Class | Variant Classification | dbSNP RS | HGVSc | HGVSp | HGVSp Short | SWISSPROT | BIOTYPE | SIFT | PolyPhen | Tumor Sample Barcode | Tissue | Histology | Sex | Age | Stage | Therapy Types | Drugs | Outcome |
| EXOC7 | SNV | Missense_Mutation | c.2064N>C | p.Gln688His | p.Q688H | Q9UPT5 | protein_coding | tolerated(0.07) | probably_damaging(0.979) | TCGA-AC-A23H-01 | Breast | breast invasive carcinoma | Female | >=65 | I/II | Unknown | Unknown | PD | |
| EXOC7 | SNV | Missense_Mutation | c.1728N>A | p.Phe576Leu | p.F576L | Q9UPT5 | protein_coding | deleterious(0) | probably_damaging(0.993) | TCGA-AC-A23H-01 | Breast | breast invasive carcinoma | Female | >=65 | I/II | Unknown | Unknown | PD | |
| EXOC7 | SNV | Missense_Mutation | c.1252N>T | p.Arg418Trp | p.R418W | Q9UPT5 | protein_coding | deleterious(0) | probably_damaging(0.978) | TCGA-B6-A0WT-01 | Breast | breast invasive carcinoma | Female | <65 | I/II | Unknown | Unknown | PD | |
| EXOC7 | SNV | Missense_Mutation | c.1374N>C | p.Lys458Asn | p.K458N | Q9UPT5 | protein_coding | deleterious(0.01) | possibly_damaging(0.805) | TCGA-C8-A12P-01 | Breast | breast invasive carcinoma | Female | <65 | I/II | Unknown | Unknown | SD | |
| EXOC7 | SNV | Missense_Mutation | novel | c.553N>A | p.Asp185Asn | p.D185N | Q9UPT5 | protein_coding | tolerated(0.25) | benign(0.024) | TCGA-D8-A147-01 | Breast | breast invasive carcinoma | Female | <65 | I/II | Chemotherapy | doxorubicine | SD |
| EXOC7 | SNV | Missense_Mutation | c.1456G>A | p.Asp486Asn | p.D486N | Q9UPT5 | protein_coding | tolerated(0.05) | benign(0.088) | TCGA-D8-A27G-01 | Breast | breast invasive carcinoma | Female | >=65 | I/II | Unknown | Unknown | SD | |
| EXOC7 | SNV | Missense_Mutation | novel | c.1196N>C | p.Ile399Thr | p.I399T | Q9UPT5 | protein_coding | deleterious(0) | probably_damaging(0.922) | TCGA-E9-A1NC-01 | Breast | breast invasive carcinoma | Female | <65 | I/II | Chemotherapy | doxorubicin | CR |
| EXOC7 | SNV | Missense_Mutation | c.2116N>A | p.Val706Met | p.V706M | Q9UPT5 | protein_coding | tolerated(0.12) | benign(0.225) | TCGA-2W-A8YY-01 | Cervix | cervical & endocervical cancer | Female | <65 | I/II | Chemotherapy | cisplatin | CR | |
| EXOC7 | SNV | Missense_Mutation | novel | c.1627N>T | p.Arg543Trp | p.R543W | Q9UPT5 | protein_coding | deleterious(0.01) | probably_damaging(0.931) | TCGA-2W-A8YY-01 | Cervix | cervical & endocervical cancer | Female | <65 | I/II | Chemotherapy | cisplatin | CR |
| EXOC7 | SNV | Missense_Mutation | c.988N>T | p.His330Tyr | p.H330Y | Q9UPT5 | protein_coding | tolerated(0.65) | benign(0) | TCGA-EK-A2PG-01 | Cervix | cervical & endocervical cancer | Female | >=65 | I/II | Unknown | Unknown | SD |
| Page: 1 2 3 4 5 6 7 |
Top |
Related drugs of malignant transformation related genes |
| Identification of chemicals and drugs interact with genes involved in malignant transfromation |
| (DGIdb 4.0) |
| Entrez ID | Symbol | Category | Interaction Types | Drug Claim Name | Drug Name | PMIDs |
| Page: 1 |

Copyright 2023-Present -The University of Texas Health Science Center at Houston |