| Tissue | Expression Dynamics | Abbreviation |
| Cervix | 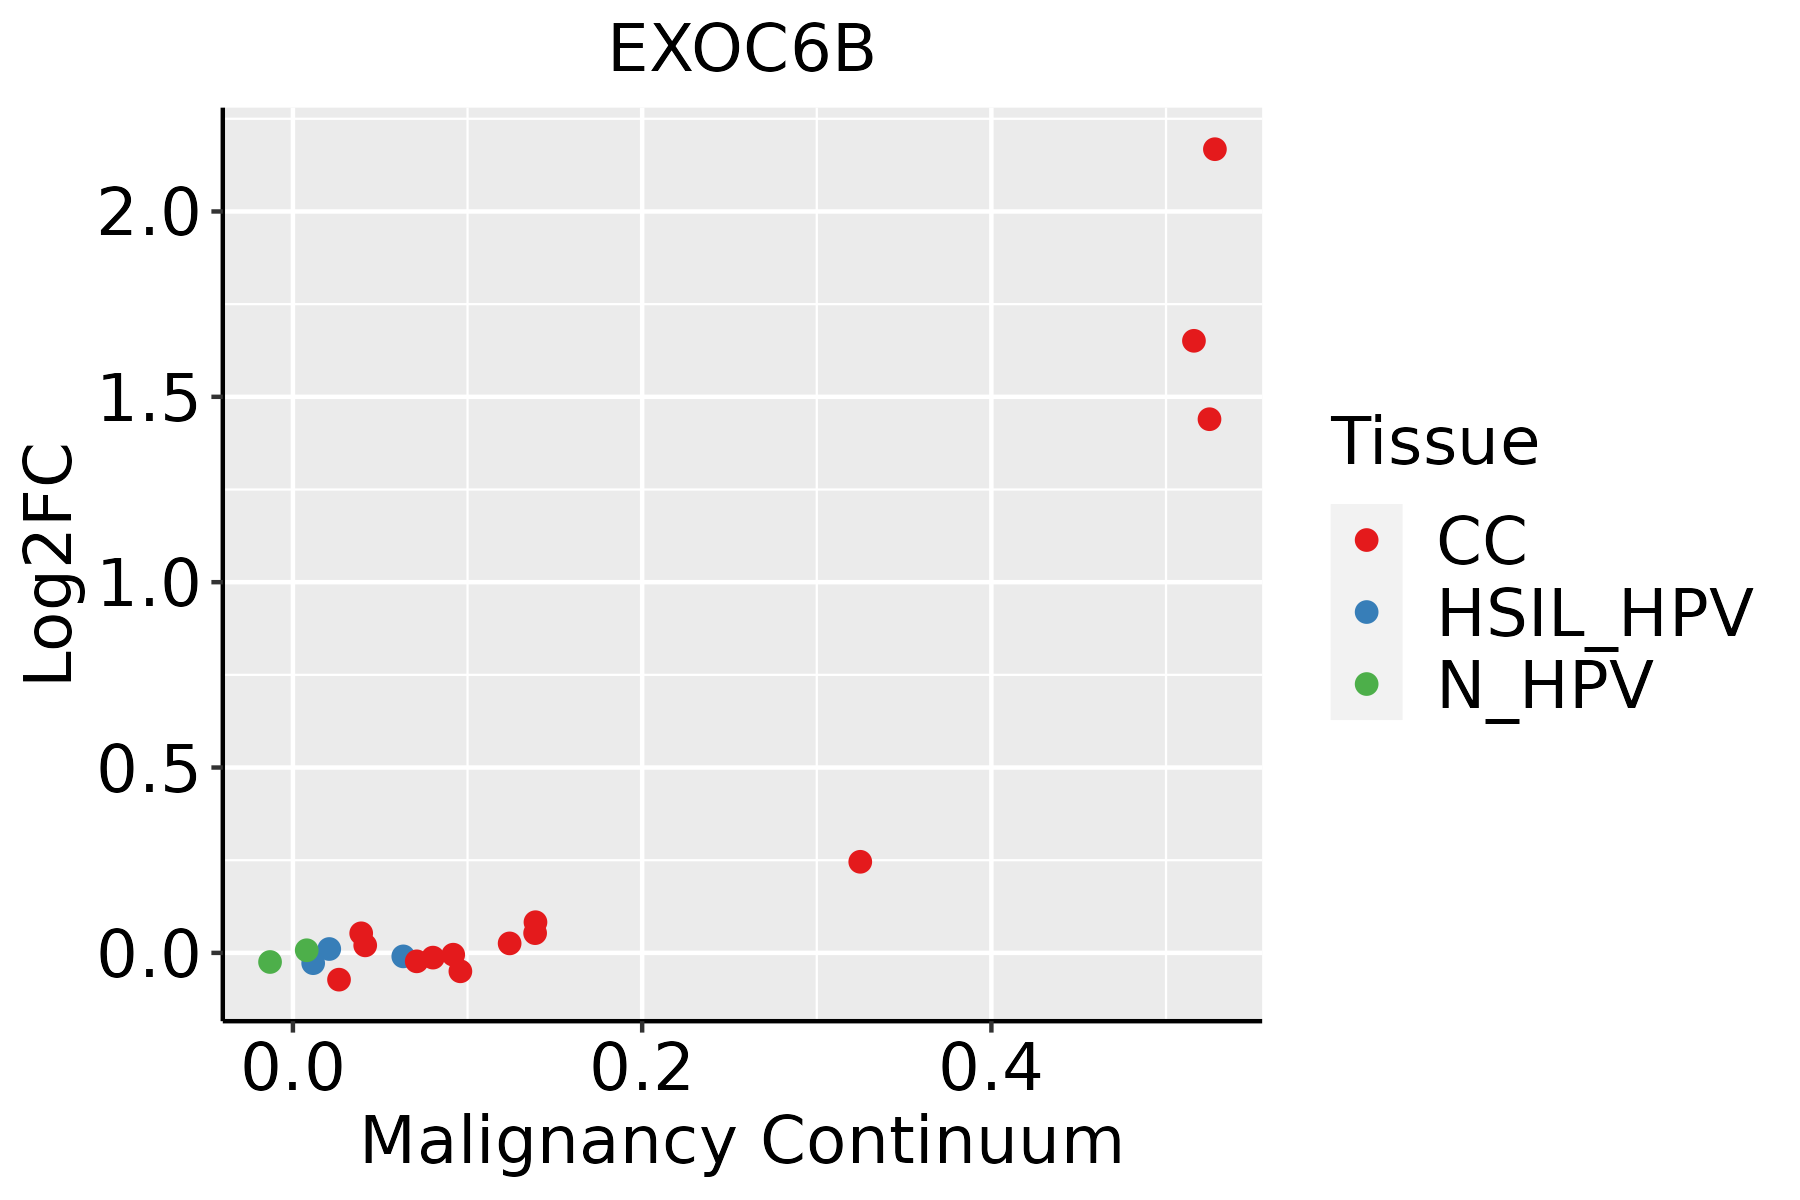 | CC: Cervix cancer |
| HSIL_HPV: HPV-infected high-grade squamous intraepithelial lesions |
| N_HPV: HPV-infected normal cervix |
| Colorectum (GSE201348) |  | FAP: Familial adenomatous polyposis |
| CRC: Colorectal cancer |
| Colorectum (HTA11) |  | AD: Adenomas |
| SER: Sessile serrated lesions |
| MSI-H: Microsatellite-high colorectal cancer |
| MSS: Microsatellite stable colorectal cancer |
| Endometrium | 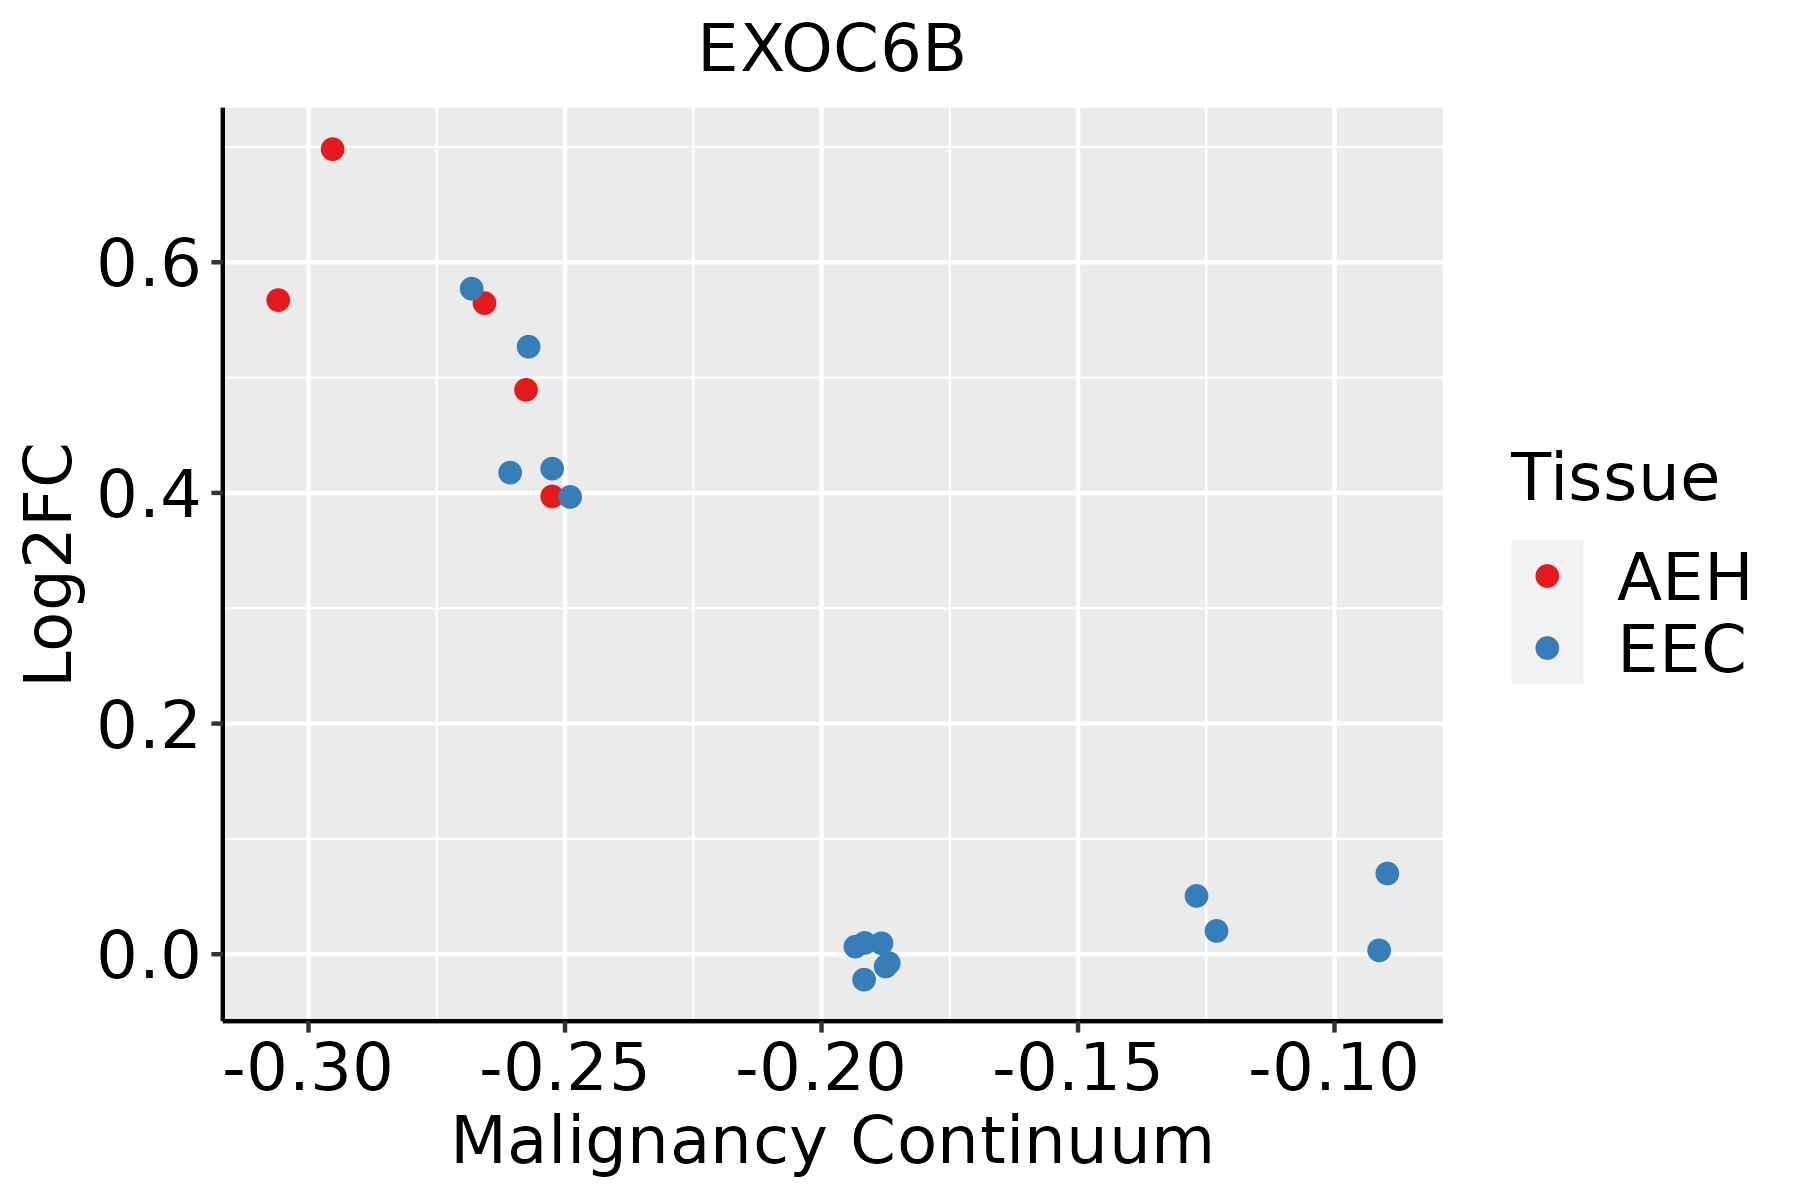 | AEH: Atypical endometrial hyperplasia |
| EEC: Endometrioid Cancer |
| Esophagus | 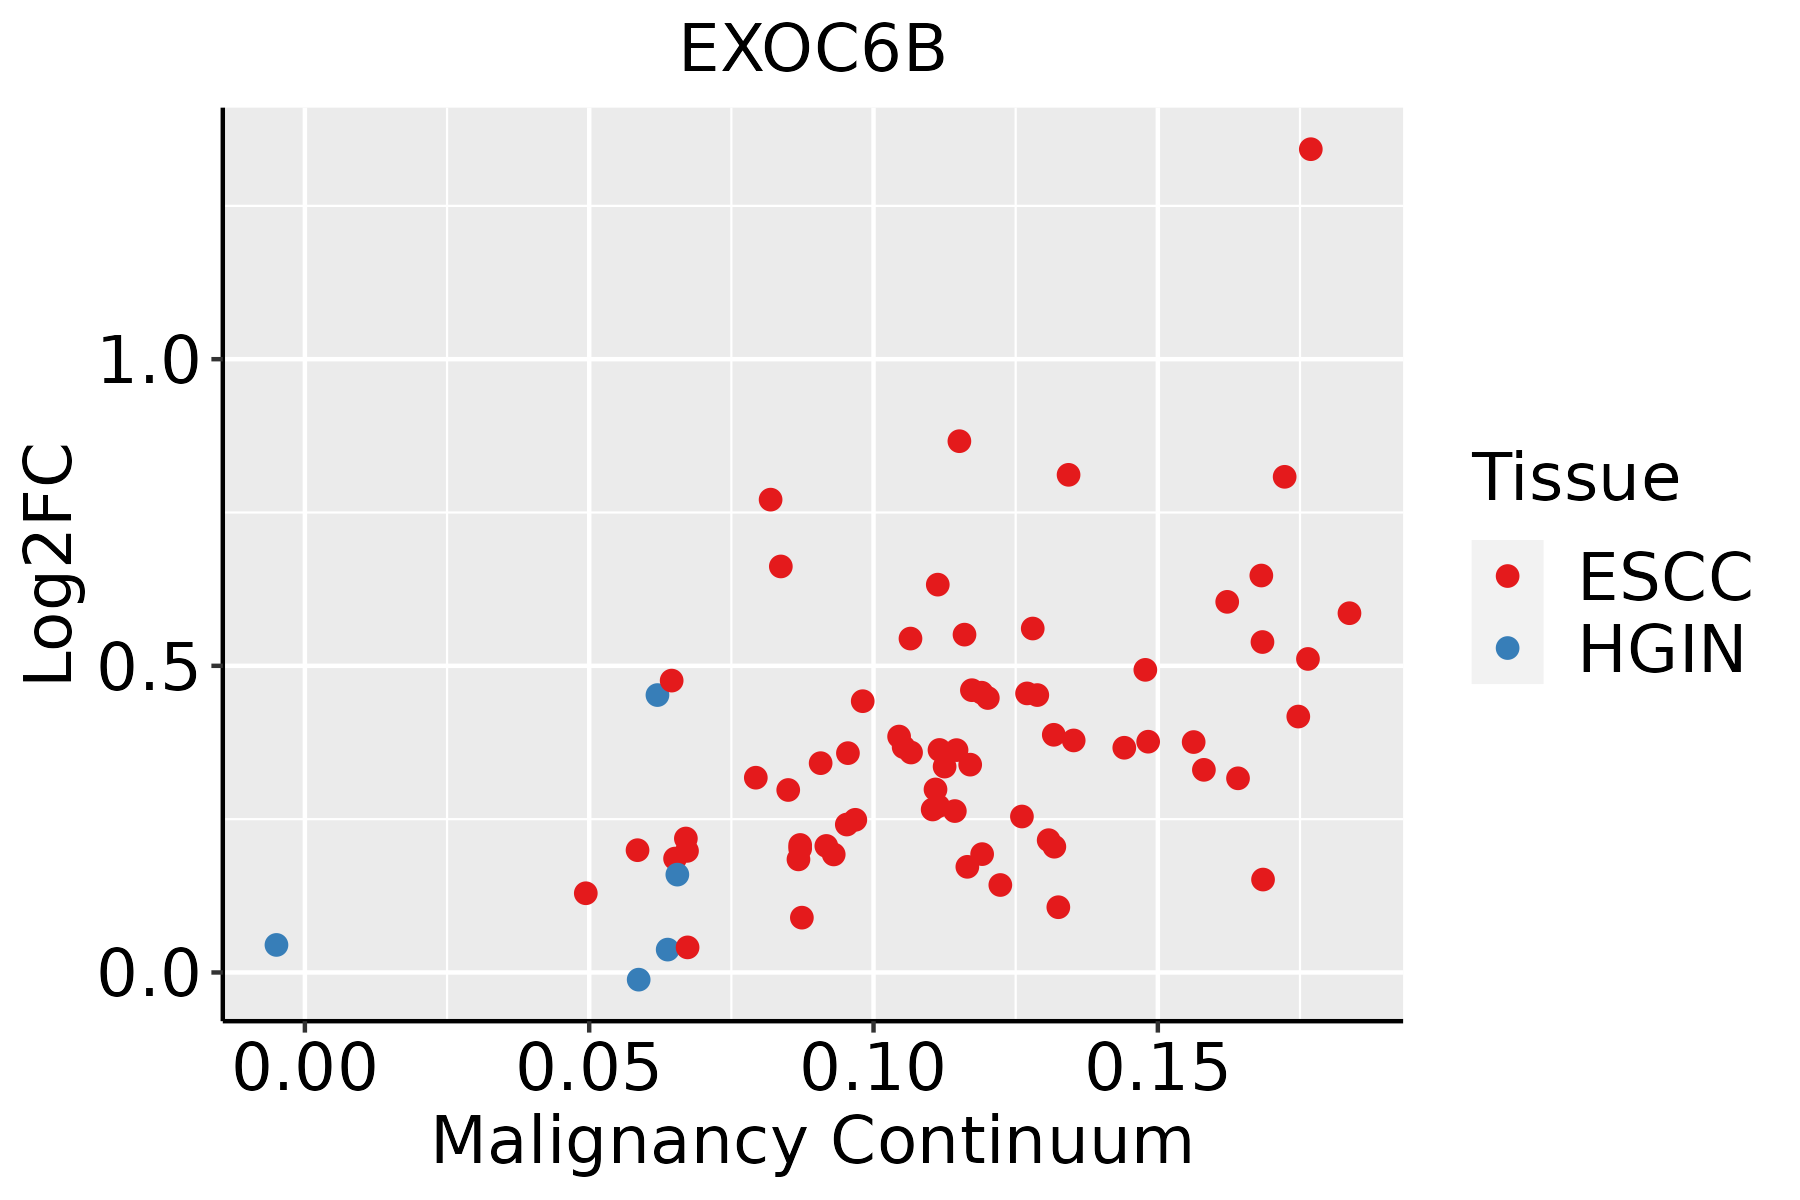 | ESCC: Esophageal squamous cell carcinoma |
| HGIN: High-grade intraepithelial neoplasias |
| LGIN: Low-grade intraepithelial neoplasias |
| GC | 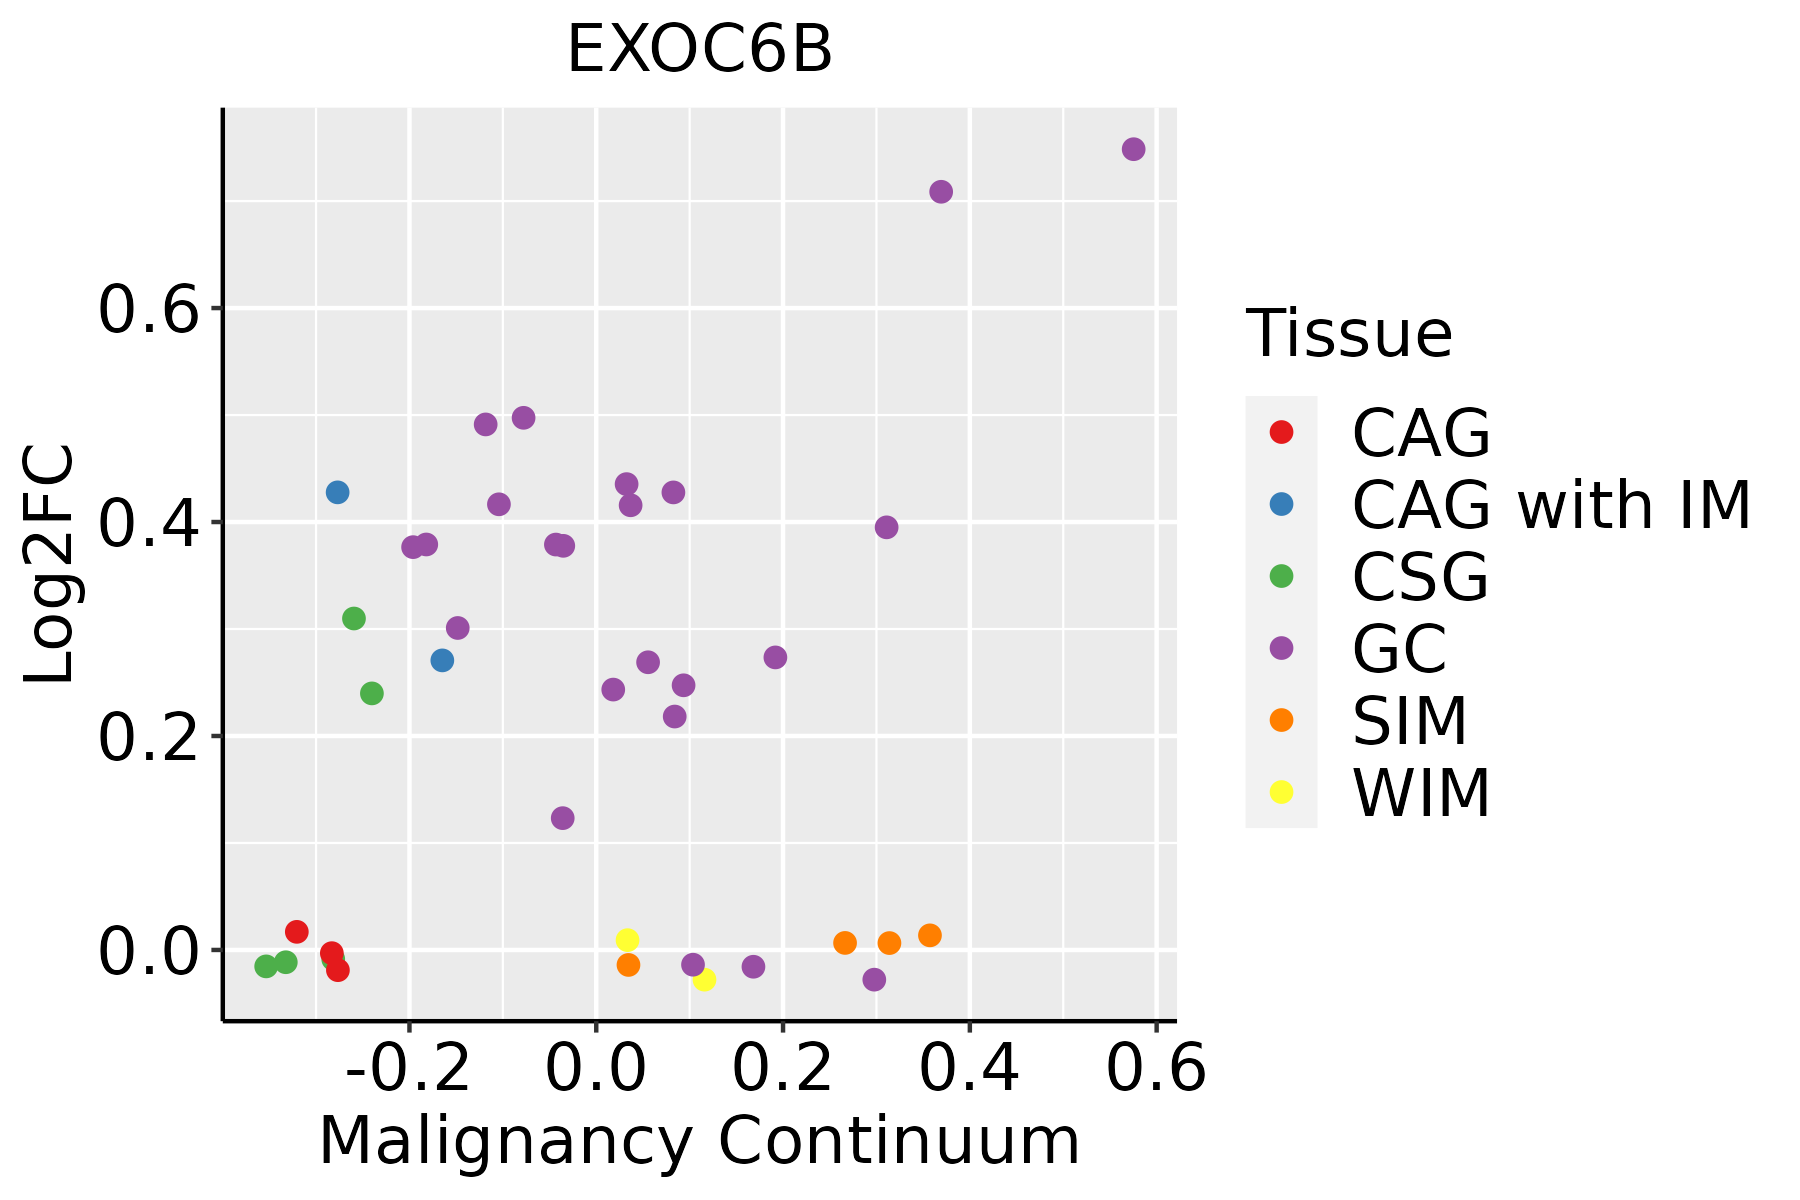 | CAG: Chronic atrophic gastritis |
| CAG with IM: Chronic atrophic gastritis with intestinal metaplasia |
| CSG: Chronic superficial gastritis |
| GC: Gastric cancer |
| SIM: Severe intestinal metaplasia |
| WIM: Wild intestinal metaplasia |
| Lung | 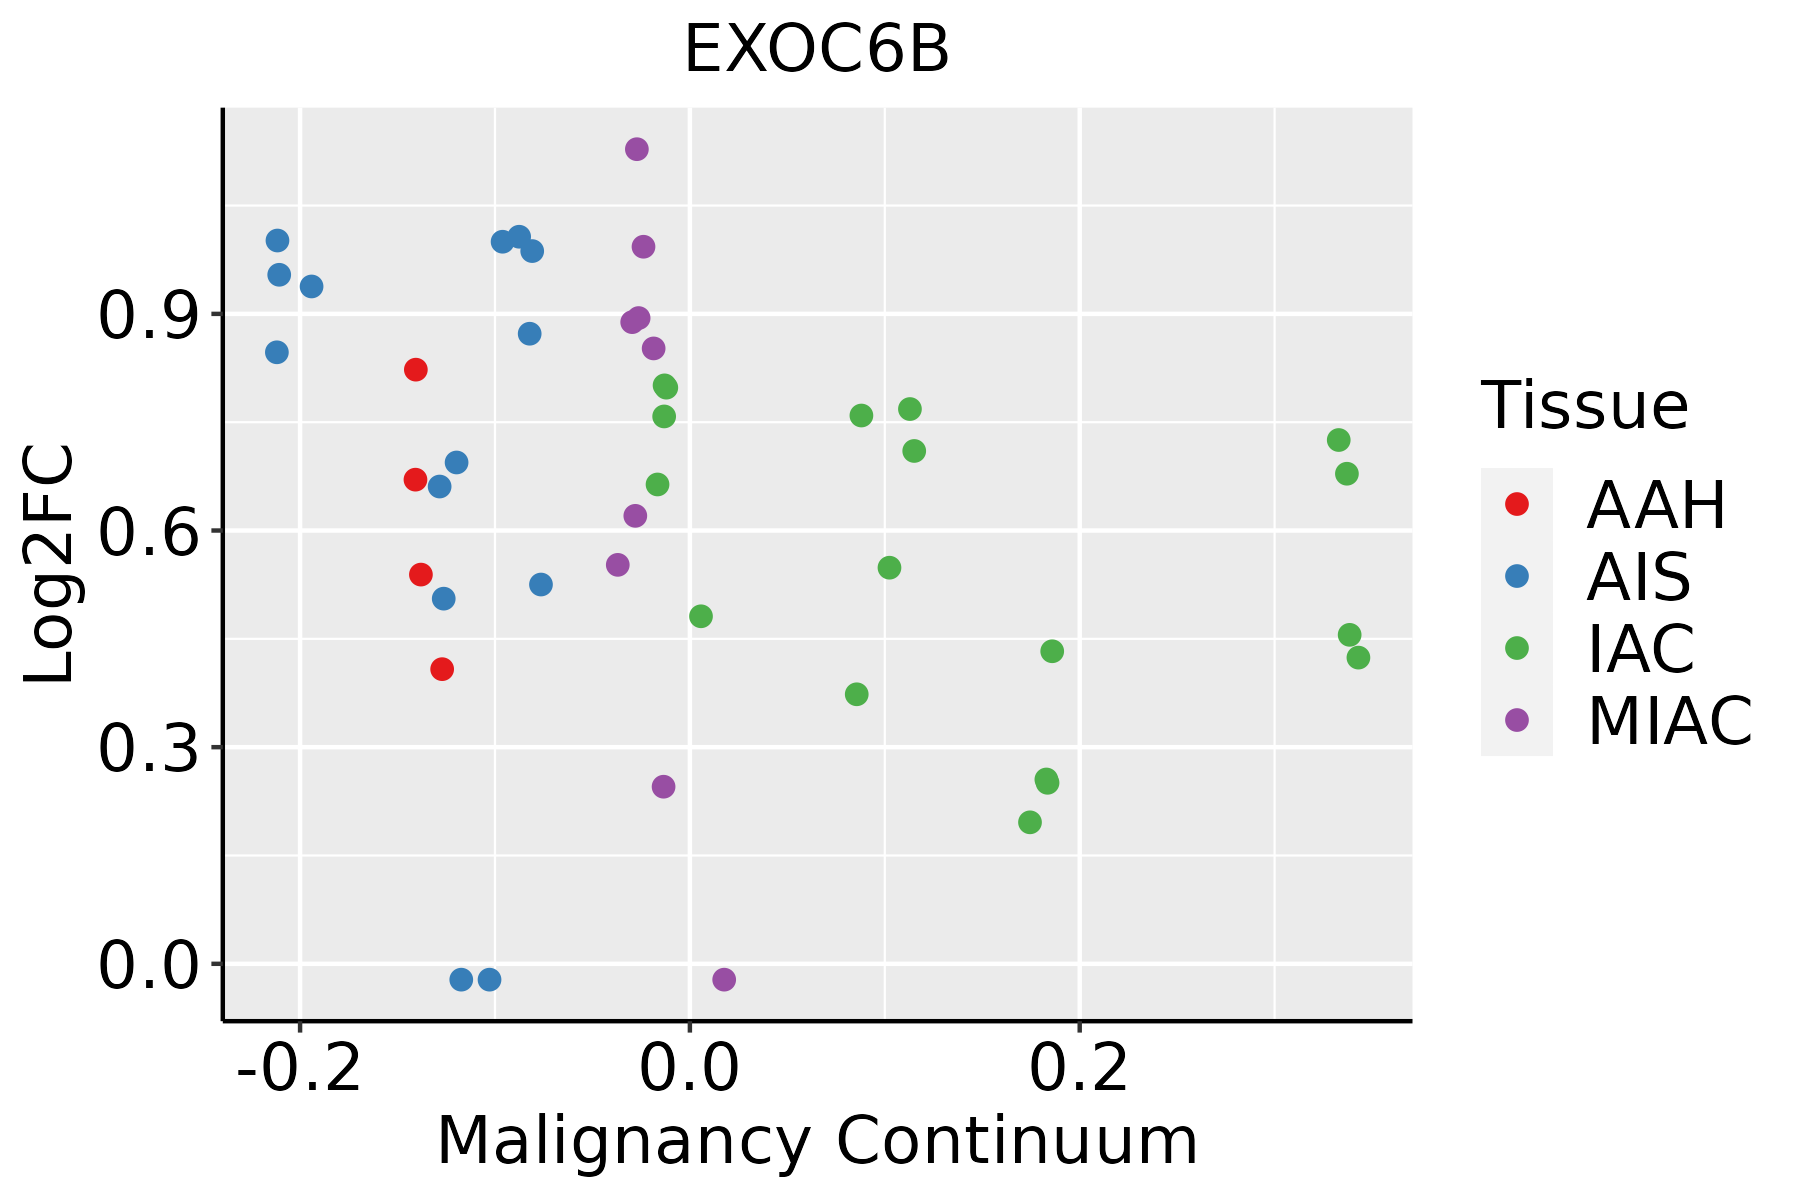 | AAH: Atypical adenomatous hyperplasia |
| AIS: Adenocarcinoma in situ |
| IAC: Invasive lung adenocarcinoma |
| MIA: Minimally invasive adenocarcinoma |
| Oral Cavity | 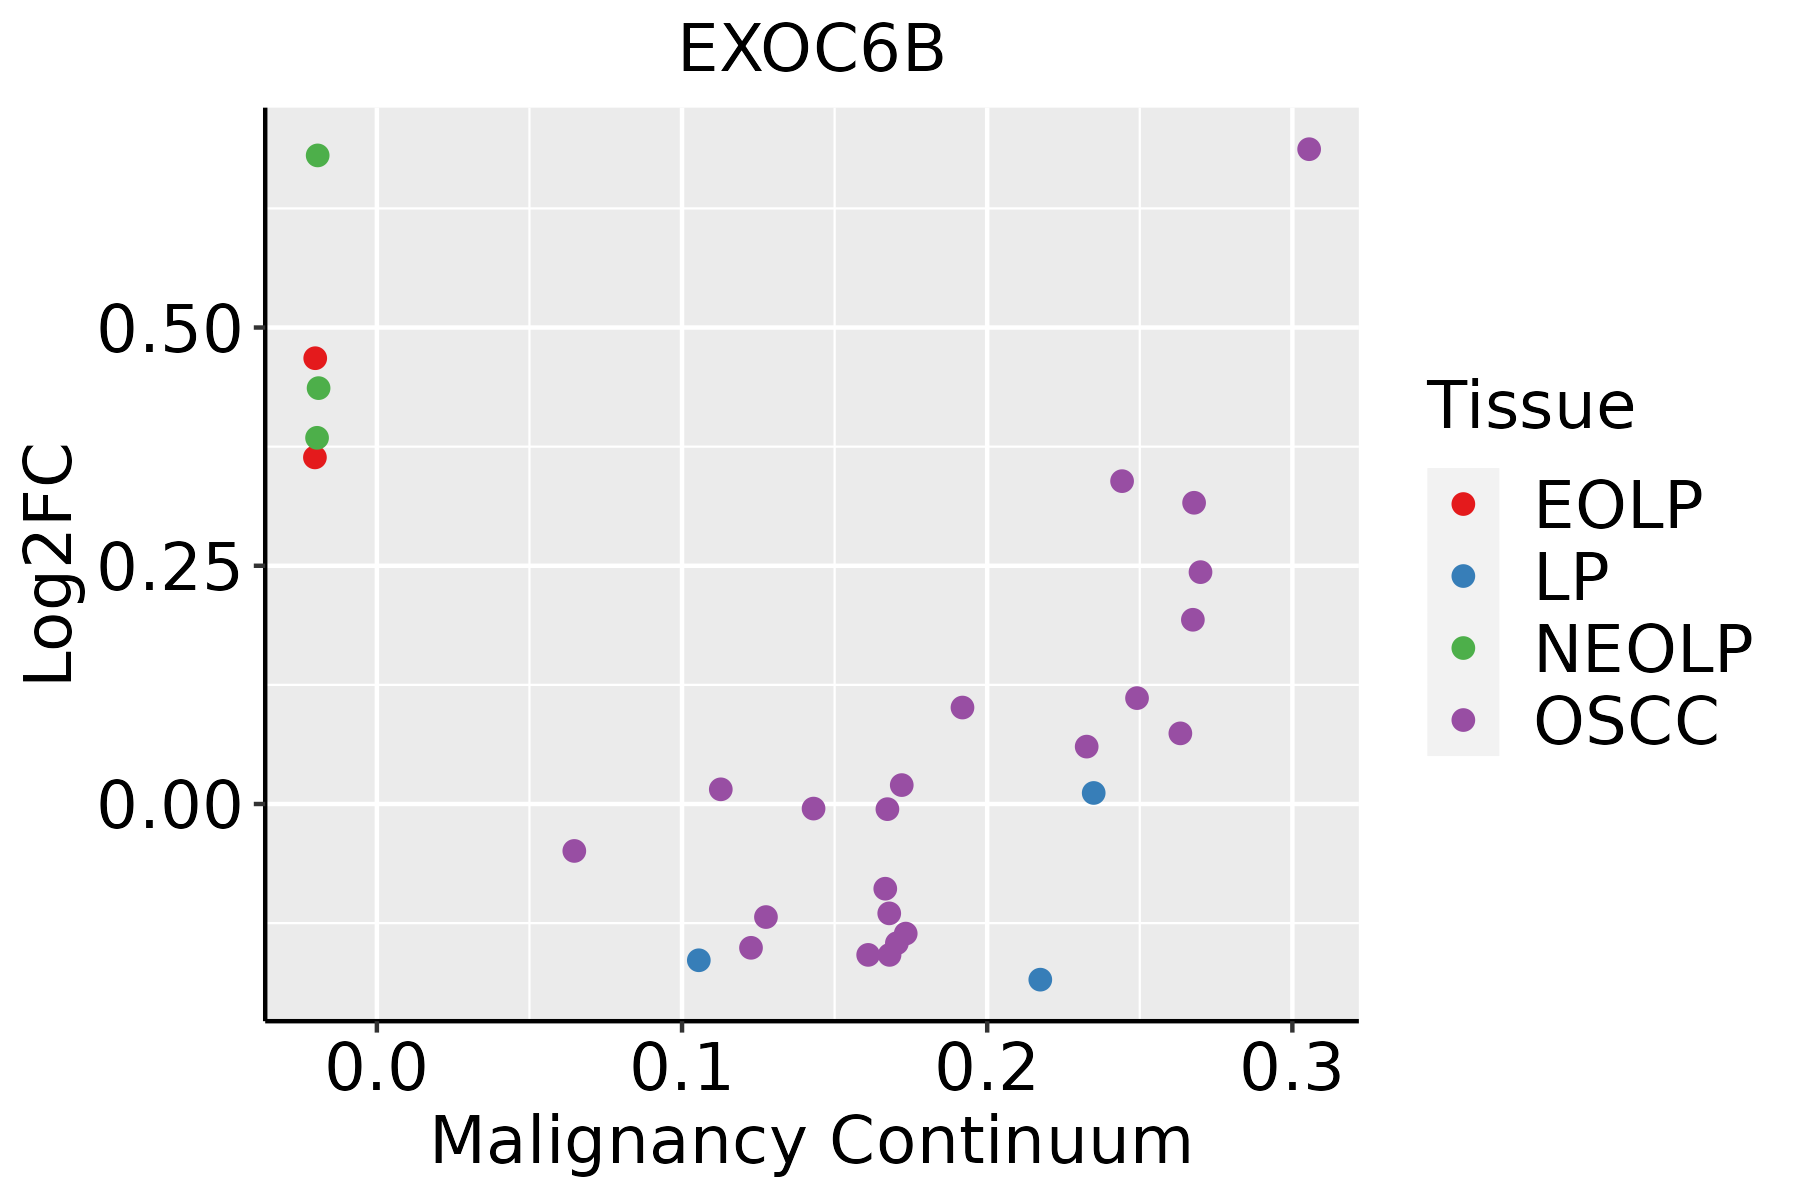 | EOLP: Erosive Oral lichen planus |
| LP: leukoplakia |
| NEOLP: Non-erosive oral lichen planus |
| OSCC: Oral squamous cell carcinoma |
| Prostate | 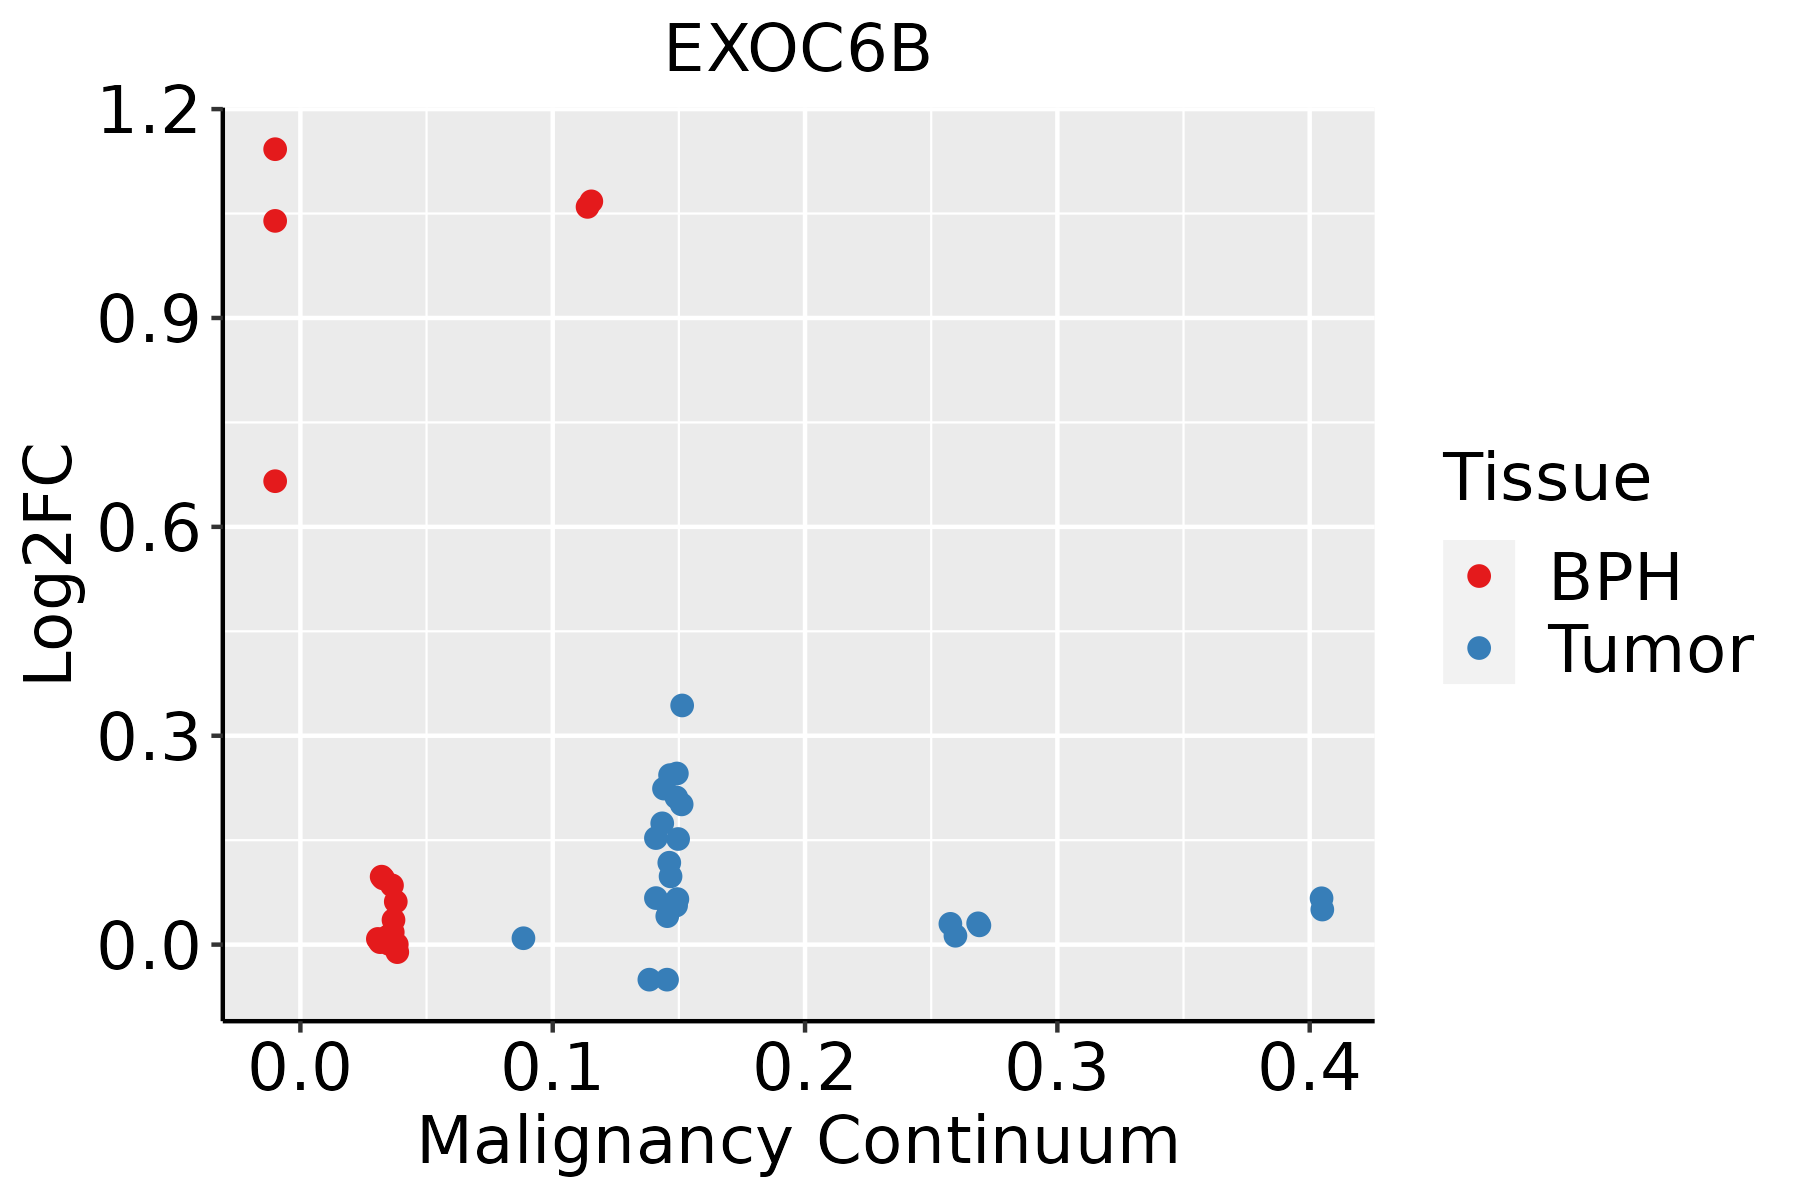 | BPH: Benign Prostatic Hyperplasia |
| Skin |  | AK: Actinic keratosis |
| cSCC: Cutaneous squamous cell carcinoma |
| SCCIS:squamous cell carcinoma in situ |
| Thyroid |  | ATC: Anaplastic thyroid cancer |
| HT: Hashimoto's thyroiditis |
| PTC: Papillary thyroid cancer |
| GO ID | Tissue | Disease Stage | Description | Gene Ratio | Bg Ratio | pvalue | p.adjust | Count |
| GO:00516567 | Cervix | CC | establishment of organelle localization | 76/2311 | 390/18723 | 3.17e-05 | 5.21e-04 | 76 |
| GO:00988767 | Cervix | CC | vesicle-mediated transport to the plasma membrane | 34/2311 | 136/18723 | 3.75e-05 | 5.91e-04 | 34 |
| GO:00068927 | Cervix | CC | post-Golgi vesicle-mediated transport | 28/2311 | 104/18723 | 4.31e-05 | 6.61e-04 | 28 |
| GO:00481938 | Cervix | CC | Golgi vesicle transport | 58/2311 | 296/18723 | 2.24e-04 | 2.54e-03 | 58 |
| GO:00068936 | Cervix | CC | Golgi to plasma membrane transport | 16/2311 | 60/18723 | 2.00e-03 | 1.46e-02 | 16 |
| GO:00068873 | Cervix | CC | exocytosis | 59/2311 | 352/18723 | 8.74e-03 | 4.48e-02 | 59 |
| GO:0048193 | Colorectum | AD | Golgi vesicle transport | 109/3918 | 296/18723 | 1.80e-10 | 1.68e-08 | 109 |
| GO:0051656 | Colorectum | AD | establishment of organelle localization | 131/3918 | 390/18723 | 3.00e-09 | 2.06e-07 | 131 |
| GO:0098876 | Colorectum | AD | vesicle-mediated transport to the plasma membrane | 57/3918 | 136/18723 | 2.30e-08 | 1.27e-06 | 57 |
| GO:0006892 | Colorectum | AD | post-Golgi vesicle-mediated transport | 45/3918 | 104/18723 | 2.22e-07 | 9.26e-06 | 45 |
| GO:0051650 | Colorectum | AD | establishment of vesicle localization | 57/3918 | 161/18723 | 1.47e-05 | 3.15e-04 | 57 |
| GO:0006893 | Colorectum | AD | Golgi to plasma membrane transport | 27/3918 | 60/18723 | 2.41e-05 | 4.66e-04 | 27 |
| GO:0051648 | Colorectum | AD | vesicle localization | 59/3918 | 177/18723 | 7.83e-05 | 1.25e-03 | 59 |
| GO:0006903 | Colorectum | AD | vesicle targeting | 19/3918 | 45/18723 | 9.94e-04 | 9.28e-03 | 19 |
| GO:0006887 | Colorectum | AD | exocytosis | 96/3918 | 352/18723 | 2.48e-03 | 1.90e-02 | 96 |
| GO:00516561 | Colorectum | SER | establishment of organelle localization | 100/2897 | 390/18723 | 1.11e-07 | 6.79e-06 | 100 |
| GO:00481931 | Colorectum | SER | Golgi vesicle transport | 79/2897 | 296/18723 | 4.20e-07 | 2.15e-05 | 79 |
| GO:00068921 | Colorectum | SER | post-Golgi vesicle-mediated transport | 31/2897 | 104/18723 | 1.59e-04 | 3.08e-03 | 31 |
| GO:00988761 | Colorectum | SER | vesicle-mediated transport to the plasma membrane | 37/2897 | 136/18723 | 3.08e-04 | 5.00e-03 | 37 |
| GO:00516501 | Colorectum | SER | establishment of vesicle localization | 42/2897 | 161/18723 | 3.38e-04 | 5.35e-03 | 42 |
| Hugo Symbol | Variant Class | Variant Classification | dbSNP RS | HGVSc | HGVSp | HGVSp Short | SWISSPROT | BIOTYPE | SIFT | PolyPhen | Tumor Sample Barcode | Tissue | Histology | Sex | Age | Stage | Therapy Types | Drugs | Outcome |
| EXOC6B | SNV | Missense_Mutation | novel | c.1918N>A | p.Asp640Asn | p.D640N | | protein_coding | tolerated(0.2) | possibly_damaging(0.562) | TCGA-A2-A4S1-01 | Breast | breast invasive carcinoma | Female | >=65 | I/II | Unknown | Unknown | SD |
| EXOC6B | SNV | Missense_Mutation | | c.1531T>C | p.Phe511Leu | p.F511L | | protein_coding | deleterious(0.02) | probably_damaging(0.992) | TCGA-A8-A097-01 | Breast | breast invasive carcinoma | Female | >=65 | I/II | Hormone Therapy | tamoxiphen | SD |
| EXOC6B | SNV | Missense_Mutation | novel | c.988C>T | p.Pro330Ser | p.P330S | | protein_coding | tolerated(0.34) | probably_damaging(0.999) | TCGA-BH-A0HA-01 | Breast | breast invasive carcinoma | Female | <65 | I/II | Unknown | Unknown | SD |
| EXOC6B | SNV | Missense_Mutation | novel | c.2374N>C | p.Glu792Gln | p.E792Q | | protein_coding | tolerated(0.07) | probably_damaging(0.998) | TCGA-BH-A0HQ-01 | Breast | breast invasive carcinoma | Female | <65 | I/II | Hormone Therapy | arimidex | SD |
| EXOC6B | SNV | Missense_Mutation | rs201814463 | c.167N>T | p.Arg56Leu | p.R56L | | protein_coding | deleterious(0.03) | probably_damaging(0.998) | TCGA-D8-A1Y1-01 | Breast | breast invasive carcinoma | Female | >=65 | III/IV | Hormone Therapy | tamoxiphen | PD |
| EXOC6B | SNV | Missense_Mutation | | c.2423N>C | p.Gly808Ala | p.G808A | | protein_coding | tolerated(0.85) | benign(0.007) | TCGA-E2-A14T-01 | Breast | breast invasive carcinoma | Female | <65 | I/II | Chemotherapy | doxorubicin | SD |
| EXOC6B | SNV | Missense_Mutation | | c.880N>T | p.Pro294Ser | p.P294S | | protein_coding | deleterious(0) | possibly_damaging(0.767) | TCGA-FU-A3TX-01 | Cervix | cervical & endocervical cancer | Female | >=65 | I/II | Unknown | Unknown | SD |
| EXOC6B | SNV | Missense_Mutation | | c.1178N>T | p.Ser393Phe | p.S393F | | protein_coding | deleterious(0.01) | possibly_damaging(0.857) | TCGA-Q1-A73O-01 | Cervix | cervical & endocervical cancer | Female | <65 | I/II | Chemotherapy | cisplatin | CR |
| EXOC6B | SNV | Missense_Mutation | novel | c.1535N>T | p.Ser512Leu | p.S512L | | protein_coding | tolerated(0.08) | probably_damaging(0.996) | TCGA-VS-A8EL-01 | Cervix | cervical & endocervical cancer | Female | <65 | I/II | Chemotherapy | cisplatin | CR |
| EXOC6B | SNV | Missense_Mutation | rs755302023 | c.142N>T | p.Arg48Cys | p.R48C | | protein_coding | deleterious(0.01) | possibly_damaging(0.761) | TCGA-A6-2684-01 | Colorectum | colon adenocarcinoma | Female | >=65 | I/II | Unknown | Unknown | PD |


