
|
|||||
|
 | |
| |
| |
| |
| |
| |
|
Gene: EXOC6 |
Gene summary for EXOC6 |
| Gene information | Species | Human | Gene symbol | EXOC6 | Gene ID | 54536 |
| Gene name | exocyst complex component 6 | |
| Gene Alias | EXOC6A | |
| Cytomap | 10q23.33 | |
| Gene Type | protein-coding | GO ID | GO:0006810 | UniProtAcc | B3KXY5 |
Top |
Malignant transformation analysis |
| Identification of the aberrant gene expression in precancerous and cancerous lesions by comparing the gene expression of stem-like cells in diseased tissues with normal stem cells |
| Entrez ID | Symbol | Replicates | Species | Organ | Tissue | Adj P-value | Log2FC | Malignancy |
| 54536 | EXOC6 | NAFLD1 | Human | Liver | NAFLD | 1.80e-03 | 3.49e-01 | -0.04 |
| 54536 | EXOC6 | HCC1_Meng | Human | Liver | HCC | 1.44e-58 | -4.65e-02 | 0.0246 |
| 54536 | EXOC6 | HCC2_Meng | Human | Liver | HCC | 1.12e-13 | -1.31e-02 | 0.0107 |
| 54536 | EXOC6 | HCC1 | Human | Liver | HCC | 8.04e-03 | 3.35e+00 | 0.5336 |
| 54536 | EXOC6 | HCC2 | Human | Liver | HCC | 9.11e-05 | 2.96e+00 | 0.5341 |
| 54536 | EXOC6 | Pt14.a | Human | Liver | HCC | 4.10e-04 | 2.25e-01 | 0.0169 |
| 54536 | EXOC6 | S027 | Human | Liver | HCC | 1.76e-02 | 3.79e-01 | 0.2446 |
| 54536 | EXOC6 | S028 | Human | Liver | HCC | 3.83e-03 | 3.67e-01 | 0.2503 |
| 54536 | EXOC6 | S029 | Human | Liver | HCC | 1.66e-04 | 4.43e-01 | 0.2581 |
| 54536 | EXOC6 | HTA12-23-1 | Human | Pancreas | PDAC | 8.22e-04 | 7.78e-01 | 0.3405 |
| 54536 | EXOC6 | HTA12-25-1 | Human | Pancreas | PDAC | 2.31e-12 | 1.04e+00 | 0.313 |
| 54536 | EXOC6 | HTA12-26-1 | Human | Pancreas | PDAC | 1.11e-21 | 1.08e+00 | 0.3728 |
| 54536 | EXOC6 | HTA12-29-1 | Human | Pancreas | PDAC | 9.74e-63 | 1.26e+00 | 0.3722 |
| 54536 | EXOC6 | HTA12-32-1 | Human | Pancreas | PDAC | 1.27e-06 | 1.34e+00 | 0.3624 |
| 54536 | EXOC6 | male-WTA | Human | Thyroid | PTC | 6.89e-26 | 1.21e-01 | 0.1037 |
| 54536 | EXOC6 | PTC01 | Human | Thyroid | PTC | 1.90e-12 | 2.32e-01 | 0.1899 |
| 54536 | EXOC6 | PTC04 | Human | Thyroid | PTC | 5.49e-24 | 4.75e-01 | 0.1927 |
| 54536 | EXOC6 | PTC05 | Human | Thyroid | PTC | 1.60e-23 | 8.44e-01 | 0.2065 |
| 54536 | EXOC6 | PTC06 | Human | Thyroid | PTC | 8.80e-31 | 6.57e-01 | 0.2057 |
| 54536 | EXOC6 | PTC07 | Human | Thyroid | PTC | 5.43e-39 | 6.35e-01 | 0.2044 |
| Page: 1 2 |
| Tissue | Expression Dynamics | Abbreviation |
| Liver | 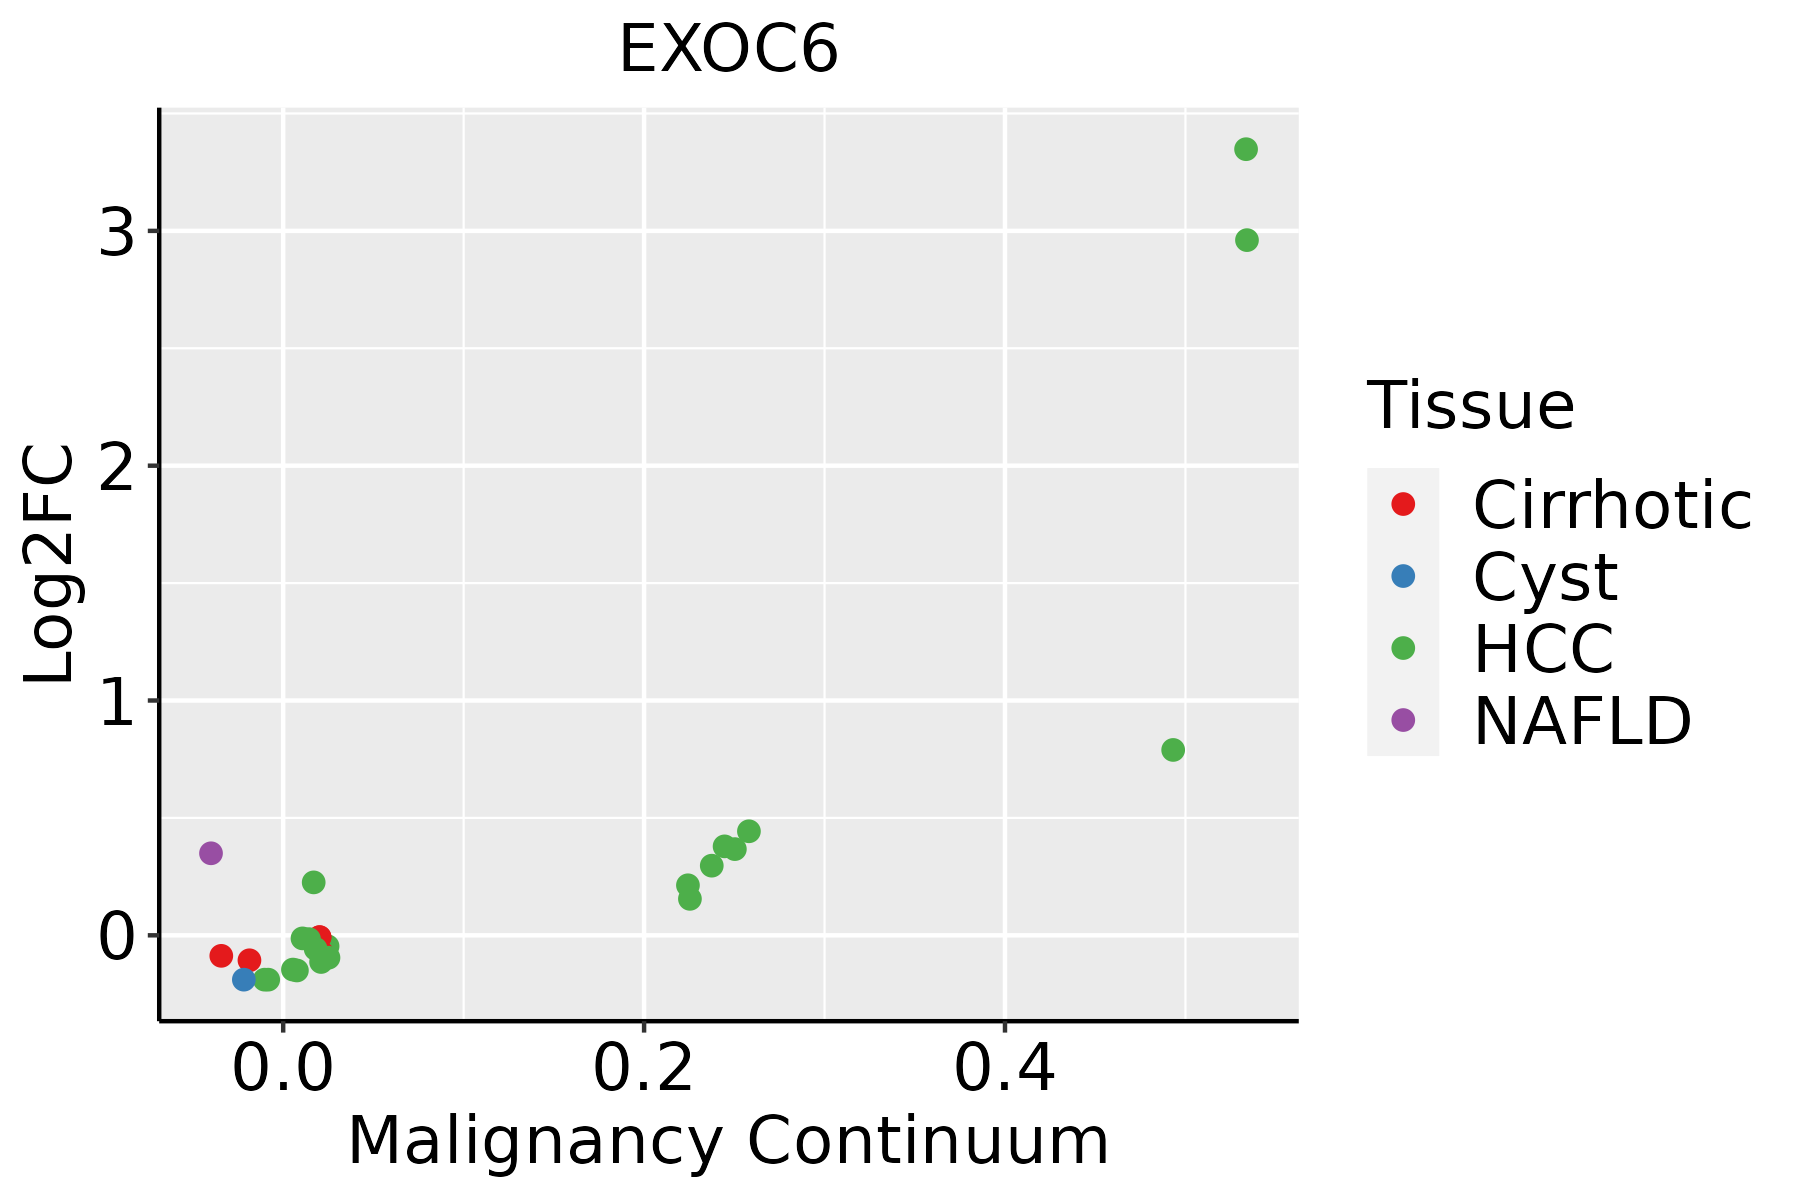 | HCC: Hepatocellular carcinoma |
| NAFLD: Non-alcoholic fatty liver disease | ||
| Thyroid |  | ATC: Anaplastic thyroid cancer |
| HT: Hashimoto's thyroiditis | ||
| PTC: Papillary thyroid cancer |
| ∗log2FC in expression of this searched gene in stem-like cells from each diseased tissue sample relative to stem-like cells in normal samples in each tissue plotted against the malignancy continuum. Samples are colored based on if they are from different disease stage. |
Top |
Malignant transformation related pathway analysis |
| Find out the enriched GO biological processes and KEGG pathways involved in transition from healthy to precancer to cancer |
| Tissue | Disease Stage | Enriched GO biological Processes |
| Colorectum | AD |  |
| Colorectum | SER |  |
| Colorectum | MSS |  |
| Colorectum | MSI-H |  |
| Colorectum | FAP |  |
| ∗Top 15 enriched GO BP terms are showed in the bar plot of each disease state in each tissue. Each row represents a significant GO biological process which is colored according to the -log10(p.adjust). |
| Page: 1 2 3 4 5 6 7 8 9 |
| GO ID | Tissue | Disease Stage | Description | Gene Ratio | Bg Ratio | pvalue | p.adjust | Count |
| GO:00516567 | Cervix | CC | establishment of organelle localization | 76/2311 | 390/18723 | 3.17e-05 | 5.21e-04 | 76 |
| GO:00988767 | Cervix | CC | vesicle-mediated transport to the plasma membrane | 34/2311 | 136/18723 | 3.75e-05 | 5.91e-04 | 34 |
| GO:00068927 | Cervix | CC | post-Golgi vesicle-mediated transport | 28/2311 | 104/18723 | 4.31e-05 | 6.61e-04 | 28 |
| GO:00481938 | Cervix | CC | Golgi vesicle transport | 58/2311 | 296/18723 | 2.24e-04 | 2.54e-03 | 58 |
| GO:00068936 | Cervix | CC | Golgi to plasma membrane transport | 16/2311 | 60/18723 | 2.00e-03 | 1.46e-02 | 16 |
| GO:00068873 | Cervix | CC | exocytosis | 59/2311 | 352/18723 | 8.74e-03 | 4.48e-02 | 59 |
| GO:0048193 | Colorectum | AD | Golgi vesicle transport | 109/3918 | 296/18723 | 1.80e-10 | 1.68e-08 | 109 |
| GO:0051656 | Colorectum | AD | establishment of organelle localization | 131/3918 | 390/18723 | 3.00e-09 | 2.06e-07 | 131 |
| GO:0098876 | Colorectum | AD | vesicle-mediated transport to the plasma membrane | 57/3918 | 136/18723 | 2.30e-08 | 1.27e-06 | 57 |
| GO:0006892 | Colorectum | AD | post-Golgi vesicle-mediated transport | 45/3918 | 104/18723 | 2.22e-07 | 9.26e-06 | 45 |
| GO:0051650 | Colorectum | AD | establishment of vesicle localization | 57/3918 | 161/18723 | 1.47e-05 | 3.15e-04 | 57 |
| GO:0006893 | Colorectum | AD | Golgi to plasma membrane transport | 27/3918 | 60/18723 | 2.41e-05 | 4.66e-04 | 27 |
| GO:0051648 | Colorectum | AD | vesicle localization | 59/3918 | 177/18723 | 7.83e-05 | 1.25e-03 | 59 |
| GO:0006903 | Colorectum | AD | vesicle targeting | 19/3918 | 45/18723 | 9.94e-04 | 9.28e-03 | 19 |
| GO:0006887 | Colorectum | AD | exocytosis | 96/3918 | 352/18723 | 2.48e-03 | 1.90e-02 | 96 |
| GO:00516561 | Colorectum | SER | establishment of organelle localization | 100/2897 | 390/18723 | 1.11e-07 | 6.79e-06 | 100 |
| GO:00481931 | Colorectum | SER | Golgi vesicle transport | 79/2897 | 296/18723 | 4.20e-07 | 2.15e-05 | 79 |
| GO:00068921 | Colorectum | SER | post-Golgi vesicle-mediated transport | 31/2897 | 104/18723 | 1.59e-04 | 3.08e-03 | 31 |
| GO:00988761 | Colorectum | SER | vesicle-mediated transport to the plasma membrane | 37/2897 | 136/18723 | 3.08e-04 | 5.00e-03 | 37 |
| GO:00516501 | Colorectum | SER | establishment of vesicle localization | 42/2897 | 161/18723 | 3.38e-04 | 5.35e-03 | 42 |
| Page: 1 2 3 4 5 6 7 8 9 |
| Pathway ID | Tissue | Disease Stage | Description | Gene Ratio | Bg Ratio | pvalue | p.adjust | qvalue | Count |
| Page: 1 |
Top |
Cell-cell communication analysis |
| Identification of potential cell-cell interactions between two cell types and their ligand-receptor pairs for different disease states |
| Ligand | Receptor | LRpair | Pathway | Tissue | Disease Stage |
| Page: 1 |
Top |
Single-cell gene regulatory network inference analysis |
| Find out the significant the regulons (TFs) and the target genes of each regulon across cell types for different disease states |
| TF | Cell Type | Tissue | Disease Stage | Target Gene | RSS | Regulon Activity |
| ∗The dot plots of a searched regulon are shown for all cell subpopulations in each disease state of each tissue based on the regulon specific score inferred using pySCENIC and by calculating the average expression. |
| Page: 1 |
Top |
Somatic mutation of malignant transformation related genes |
| Annotation of somatic variants for genes involved in malignant transformation |
| Hugo Symbol | Variant Class | Variant Classification | dbSNP RS | HGVSc | HGVSp | HGVSp Short | SWISSPROT | BIOTYPE | SIFT | PolyPhen | Tumor Sample Barcode | Tissue | Histology | Sex | Age | Stage | Therapy Types | Drugs | Outcome |
| EXOC6 | SNV | Missense_Mutation | c.223G>C | p.Asp75His | p.D75H | Q8TAG9 | protein_coding | deleterious(0.03) | benign(0.114) | TCGA-A8-A06Y-01 | Breast | breast invasive carcinoma | Female | >=65 | I/II | Hormone Therapy | anastrozole | PD | |
| EXOC6 | SNV | Missense_Mutation | c.2154C>G | p.Phe718Leu | p.F718L | Q8TAG9 | protein_coding | deleterious(0.01) | probably_damaging(0.993) | TCGA-AC-A23H-01 | Breast | breast invasive carcinoma | Female | >=65 | I/II | Unknown | Unknown | PD | |
| EXOC6 | SNV | Missense_Mutation | rs752026979 | c.61N>A | p.Glu21Lys | p.E21K | Q8TAG9 | protein_coding | deleterious(0.01) | benign(0.02) | TCGA-AN-A046-01 | Breast | breast invasive carcinoma | Female | >=65 | I/II | Unknown | Unknown | SD |
| EXOC6 | SNV | Missense_Mutation | novel | c.350N>A | p.Arg117Gln | p.R117Q | Q8TAG9 | protein_coding | tolerated(0.57) | benign(0.001) | TCGA-AN-A046-01 | Breast | breast invasive carcinoma | Female | >=65 | I/II | Unknown | Unknown | SD |
| EXOC6 | SNV | Missense_Mutation | novel | c.1431N>T | p.Lys477Asn | p.K477N | Q8TAG9 | protein_coding | deleterious(0) | possibly_damaging(0.875) | TCGA-AN-A046-01 | Breast | breast invasive carcinoma | Female | >=65 | I/II | Unknown | Unknown | SD |
| EXOC6 | SNV | Missense_Mutation | c.181N>A | p.Glu61Lys | p.E61K | Q8TAG9 | protein_coding | deleterious(0.04) | benign(0.168) | TCGA-D8-A147-01 | Breast | breast invasive carcinoma | Female | <65 | I/II | Chemotherapy | doxorubicine | SD | |
| EXOC6 | SNV | Missense_Mutation | rs768956810 | c.874A>G | p.Ile292Val | p.I292V | Q8TAG9 | protein_coding | deleterious(0.03) | benign(0.125) | TCGA-D8-A1JM-01 | Breast | breast invasive carcinoma | Female | <65 | I/II | ChemotherapyHormone Therapy | doxorubicine | SD |
| EXOC6 | insertion | Frame_Shift_Ins | novel | c.1762_1763insGGGTCCAGGACTTTGGGGCTACAGTGAG | p.Ser588TrpfsTer32 | p.S588Wfs*32 | Q8TAG9 | protein_coding | TCGA-AR-A0TY-01 | Breast | breast invasive carcinoma | Female | <65 | I/II | Unspecific | Paclitaxel | PD | ||
| EXOC6 | SNV | Missense_Mutation | novel | c.1276G>A | p.Glu426Lys | p.E426K | Q8TAG9 | protein_coding | deleterious(0) | benign(0.265) | TCGA-DR-A0ZM-01 | Cervix | cervical & endocervical cancer | Female | <65 | III/IV | Unspecific | Cisplatin | SD |
| EXOC6 | SNV | Missense_Mutation | c.1945C>G | p.His649Asp | p.H649D | Q8TAG9 | protein_coding | tolerated(0.08) | benign(0.232) | TCGA-JW-A5VL-01 | Cervix | cervical & endocervical cancer | Female | <65 | I/II | Unknown | Unknown | SD |
| Page: 1 2 3 4 5 6 7 8 9 |
Top |
Related drugs of malignant transformation related genes |
| Identification of chemicals and drugs interact with genes involved in malignant transfromation |
| (DGIdb 4.0) |
| Entrez ID | Symbol | Category | Interaction Types | Drug Claim Name | Drug Name | PMIDs |
| Page: 1 |

Copyright 2023-Present -The University of Texas Health Science Center at Houston |