
|
|||||
|
 | |
| |
| |
| |
| |
| |
|
Gene: EXOC5 |
Gene summary for EXOC5 |
| Gene information | Species | Human | Gene symbol | EXOC5 | Gene ID | 10640 |
| Gene name | exocyst complex component 5 | |
| Gene Alias | HSEC10 | |
| Cytomap | 14q22.3 | |
| Gene Type | protein-coding | GO ID | GO:0001736 | UniProtAcc | O00471 |
Top |
Malignant transformation analysis |
| Identification of the aberrant gene expression in precancerous and cancerous lesions by comparing the gene expression of stem-like cells in diseased tissues with normal stem cells |
| Entrez ID | Symbol | Replicates | Species | Organ | Tissue | Adj P-value | Log2FC | Malignancy |
| 10640 | EXOC5 | LZE4T | Human | Esophagus | ESCC | 3.62e-15 | 4.55e-01 | 0.0811 |
| 10640 | EXOC5 | LZE7T | Human | Esophagus | ESCC | 7.69e-05 | 3.08e-01 | 0.0667 |
| 10640 | EXOC5 | LZE8T | Human | Esophagus | ESCC | 6.43e-05 | 1.37e-01 | 0.067 |
| 10640 | EXOC5 | LZE24T | Human | Esophagus | ESCC | 8.18e-12 | 3.55e-01 | 0.0596 |
| 10640 | EXOC5 | LZE6T | Human | Esophagus | ESCC | 4.70e-02 | 3.26e-02 | 0.0845 |
| 10640 | EXOC5 | P1T-E | Human | Esophagus | ESCC | 1.49e-04 | 2.07e-01 | 0.0875 |
| 10640 | EXOC5 | P2T-E | Human | Esophagus | ESCC | 2.12e-22 | 3.16e-01 | 0.1177 |
| 10640 | EXOC5 | P4T-E | Human | Esophagus | ESCC | 2.64e-20 | 4.27e-01 | 0.1323 |
| 10640 | EXOC5 | P5T-E | Human | Esophagus | ESCC | 2.92e-12 | 2.25e-01 | 0.1327 |
| 10640 | EXOC5 | P8T-E | Human | Esophagus | ESCC | 1.42e-17 | 2.79e-01 | 0.0889 |
| 10640 | EXOC5 | P9T-E | Human | Esophagus | ESCC | 9.39e-06 | 1.02e-01 | 0.1131 |
| 10640 | EXOC5 | P10T-E | Human | Esophagus | ESCC | 3.97e-31 | 4.94e-01 | 0.116 |
| 10640 | EXOC5 | P11T-E | Human | Esophagus | ESCC | 6.03e-10 | 4.08e-01 | 0.1426 |
| 10640 | EXOC5 | P12T-E | Human | Esophagus | ESCC | 4.46e-30 | 5.75e-01 | 0.1122 |
| 10640 | EXOC5 | P15T-E | Human | Esophagus | ESCC | 2.95e-43 | 9.38e-01 | 0.1149 |
| 10640 | EXOC5 | P16T-E | Human | Esophagus | ESCC | 7.25e-20 | 2.97e-01 | 0.1153 |
| 10640 | EXOC5 | P19T-E | Human | Esophagus | ESCC | 1.20e-03 | 4.12e-01 | 0.1662 |
| 10640 | EXOC5 | P20T-E | Human | Esophagus | ESCC | 3.32e-23 | 2.62e-01 | 0.1124 |
| 10640 | EXOC5 | P21T-E | Human | Esophagus | ESCC | 1.81e-22 | 3.06e-01 | 0.1617 |
| 10640 | EXOC5 | P22T-E | Human | Esophagus | ESCC | 2.54e-23 | 2.29e-01 | 0.1236 |
| Page: 1 2 3 4 5 6 |
| Tissue | Expression Dynamics | Abbreviation |
| Esophagus | 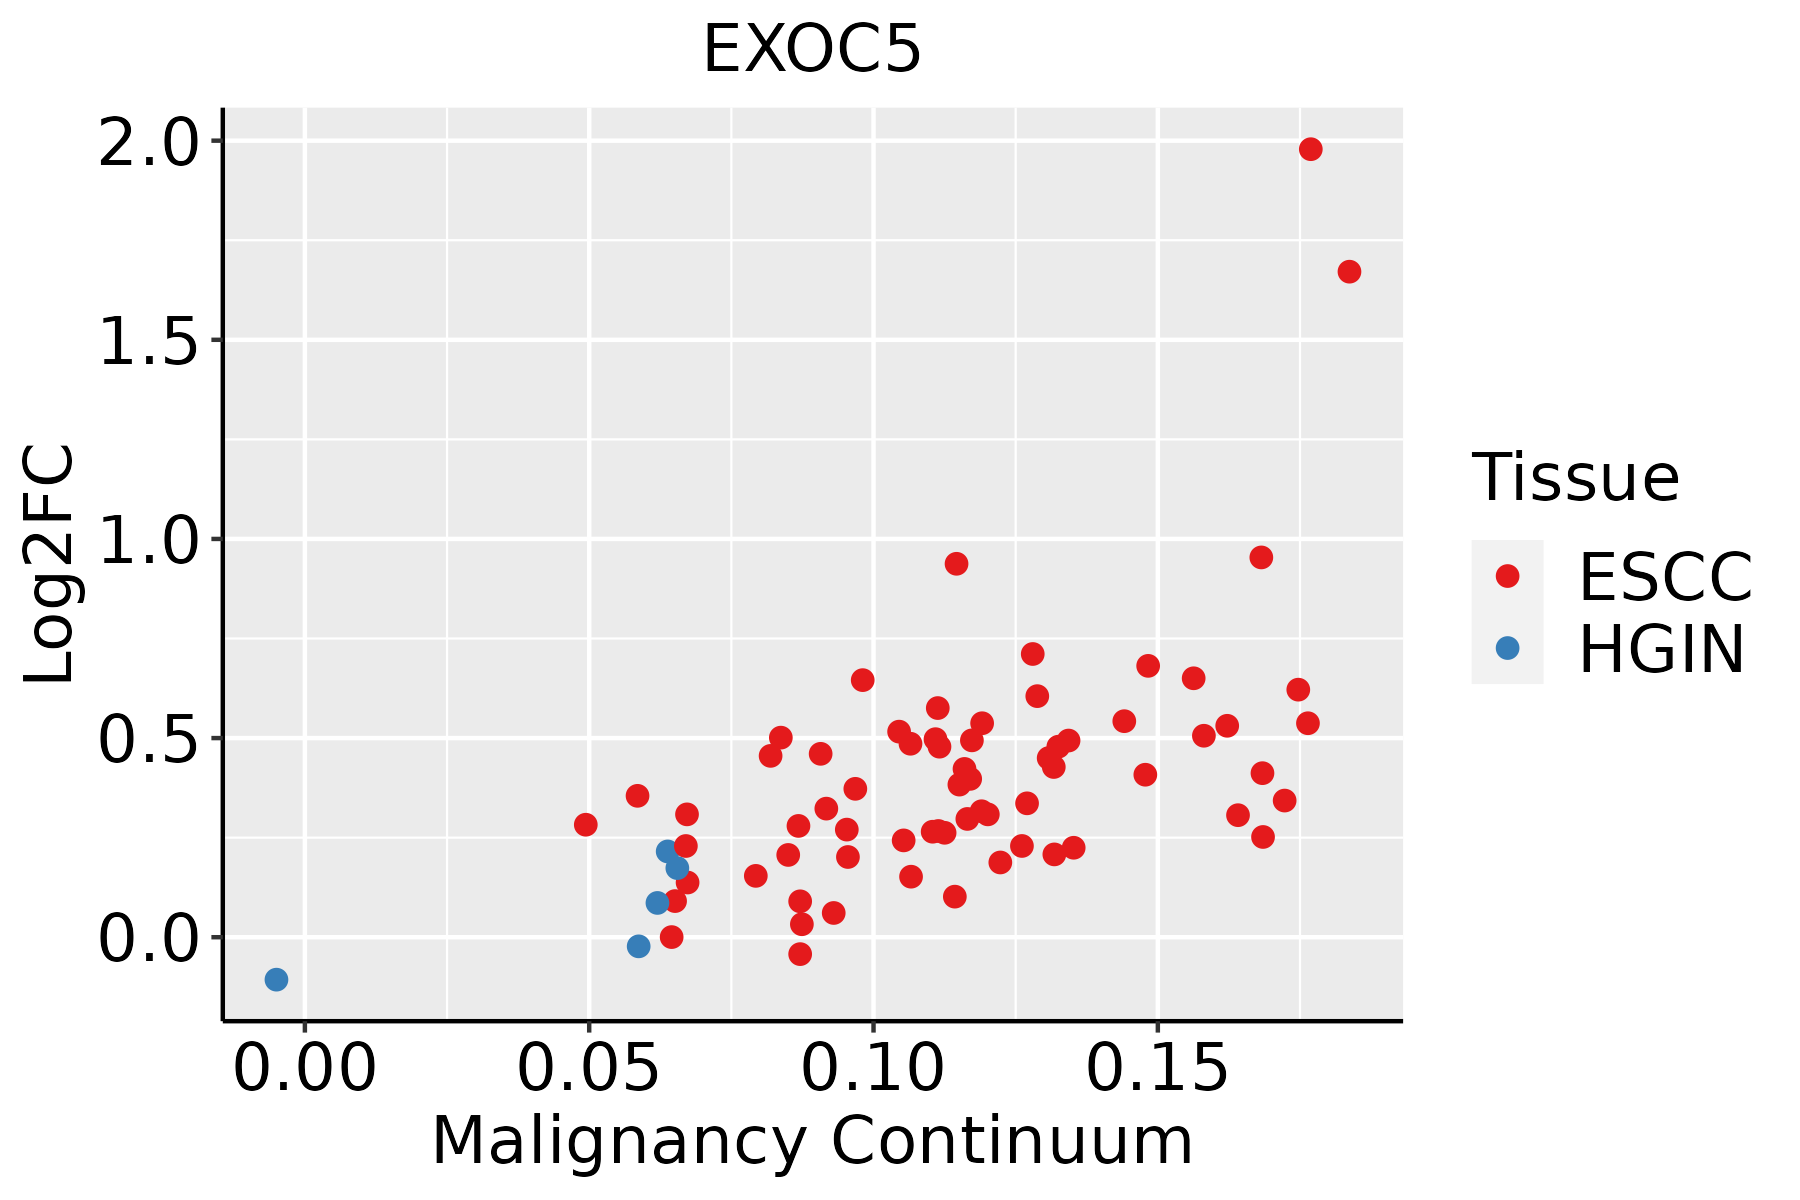 | ESCC: Esophageal squamous cell carcinoma |
| HGIN: High-grade intraepithelial neoplasias | ||
| LGIN: Low-grade intraepithelial neoplasias | ||
| Liver | 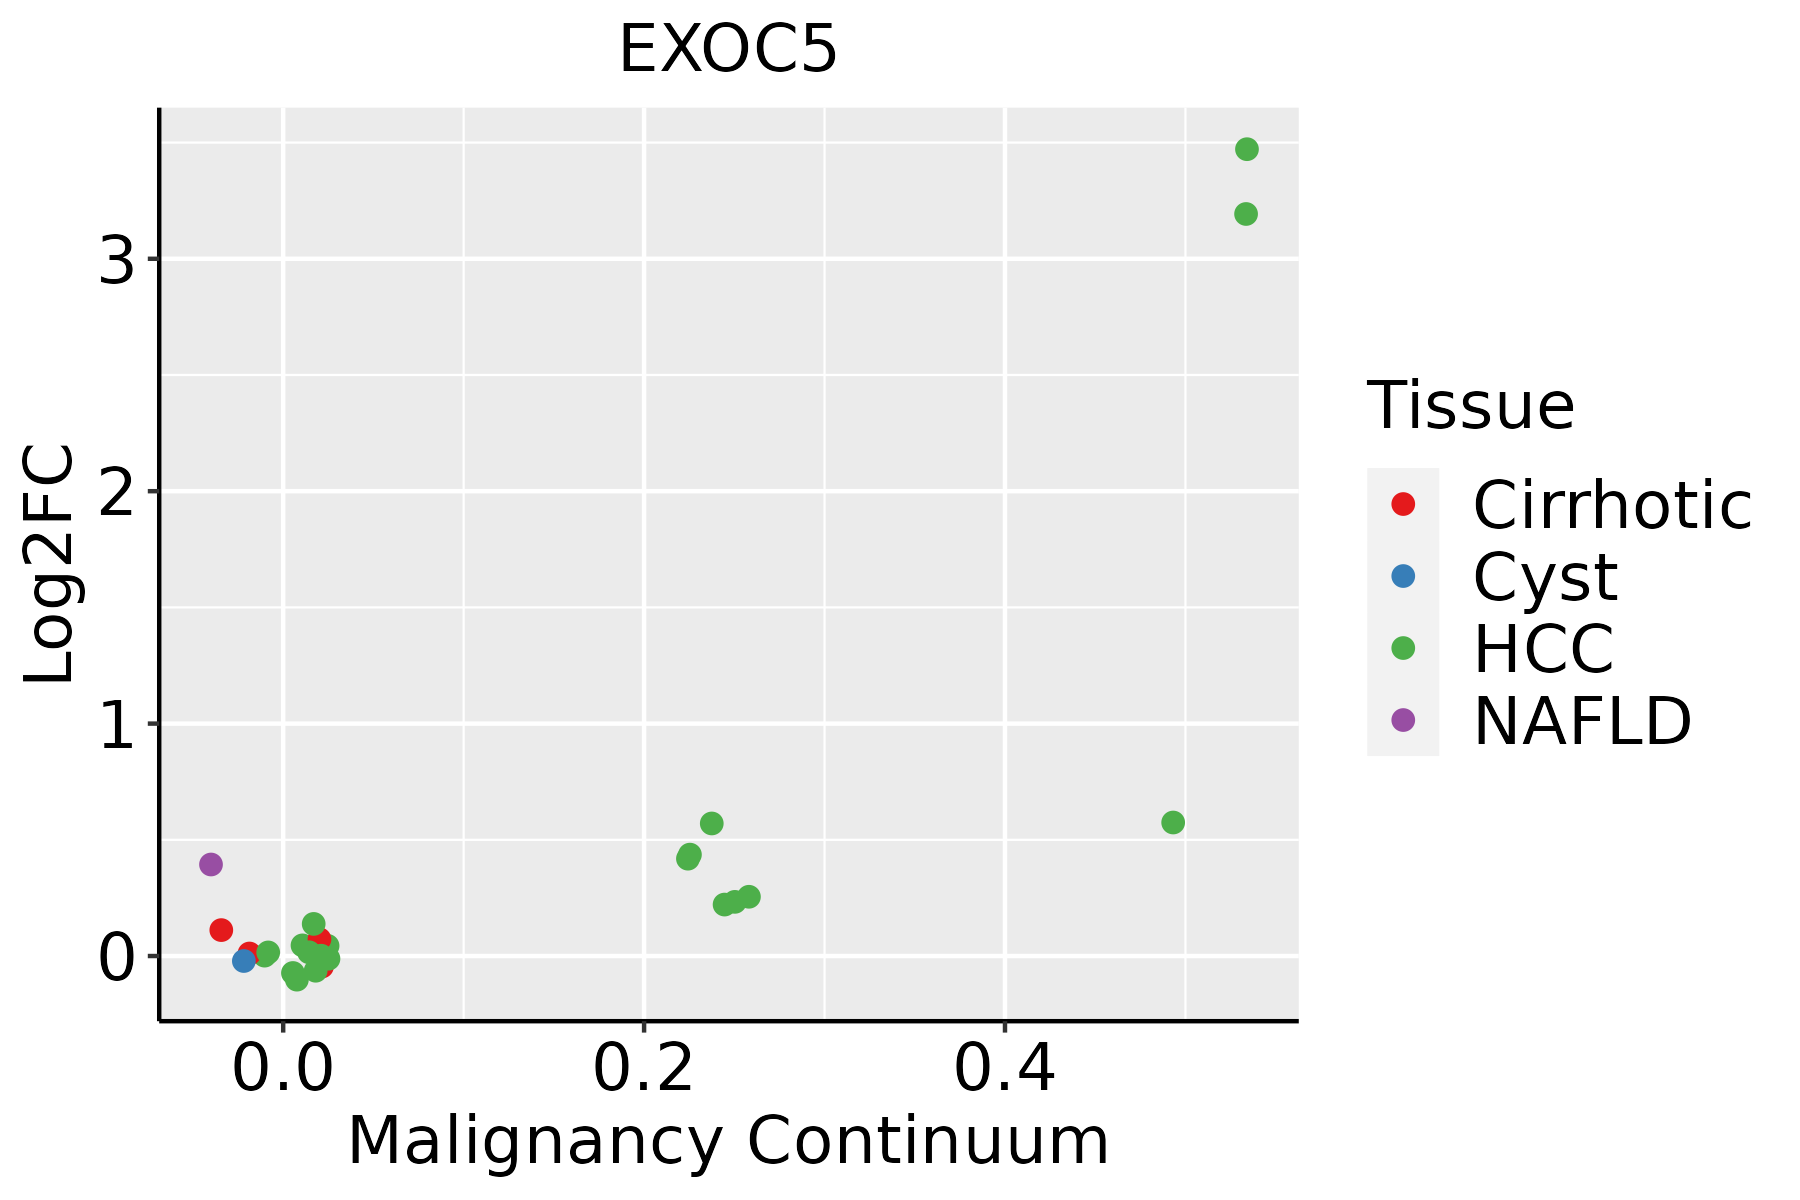 | HCC: Hepatocellular carcinoma |
| NAFLD: Non-alcoholic fatty liver disease | ||
| Oral Cavity | 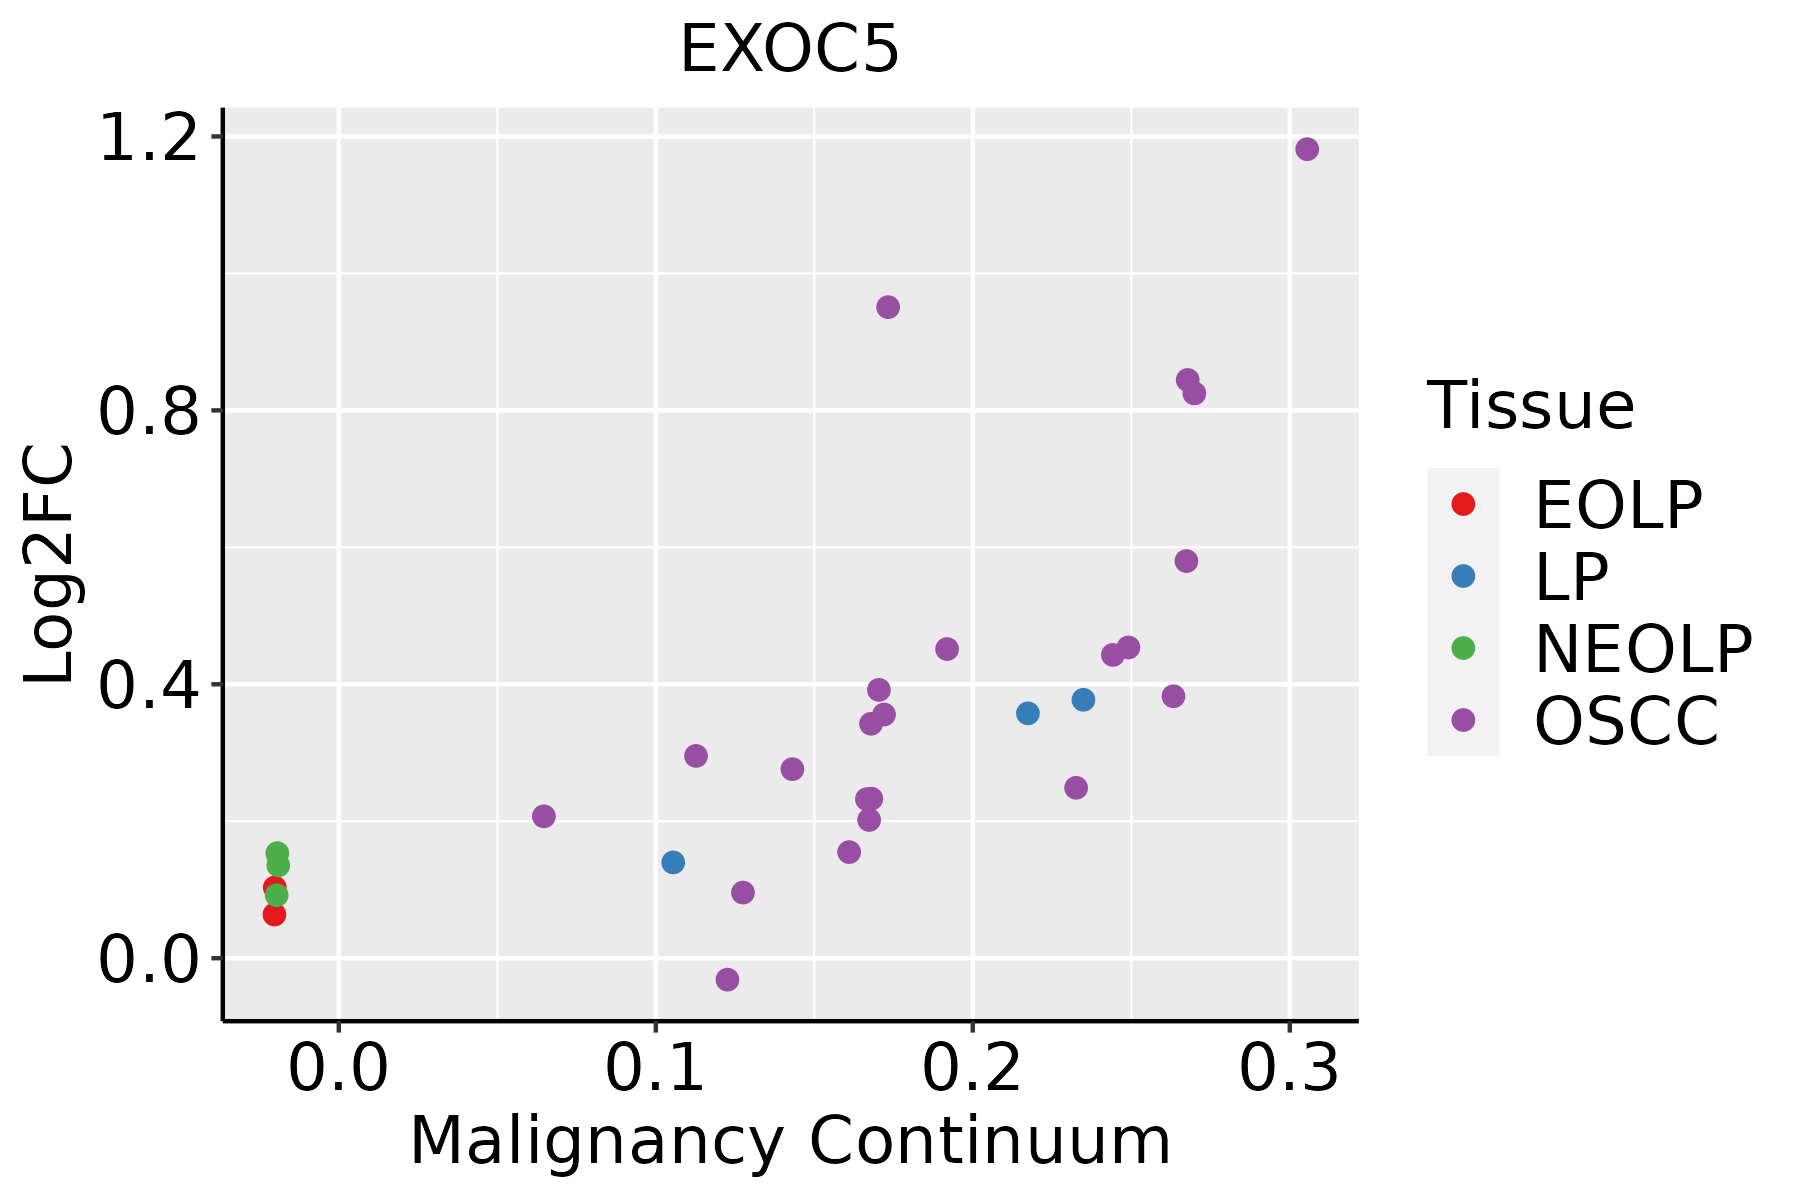 | EOLP: Erosive Oral lichen planus |
| LP: leukoplakia | ||
| NEOLP: Non-erosive oral lichen planus | ||
| OSCC: Oral squamous cell carcinoma | ||
| Skin | 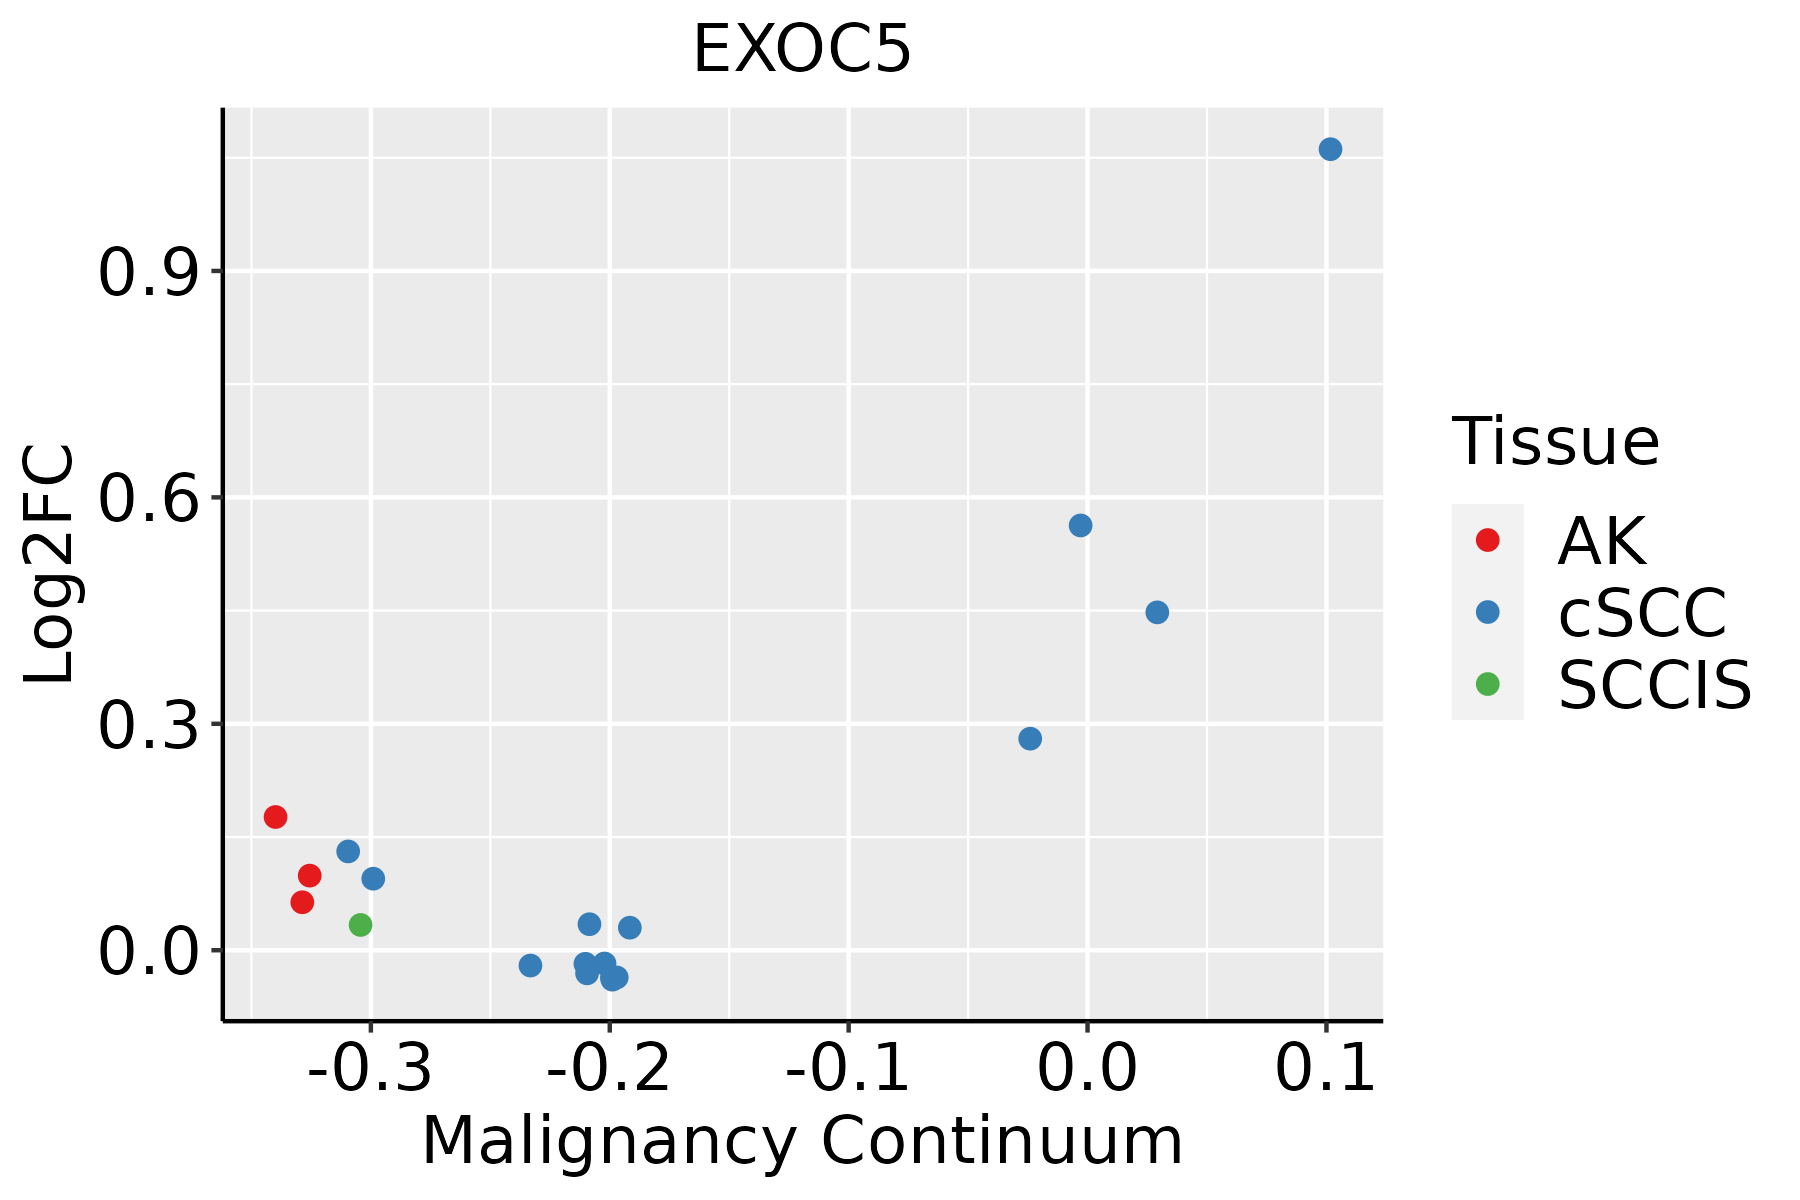 | AK: Actinic keratosis |
| cSCC: Cutaneous squamous cell carcinoma | ||
| SCCIS:squamous cell carcinoma in situ | ||
| Thyroid | 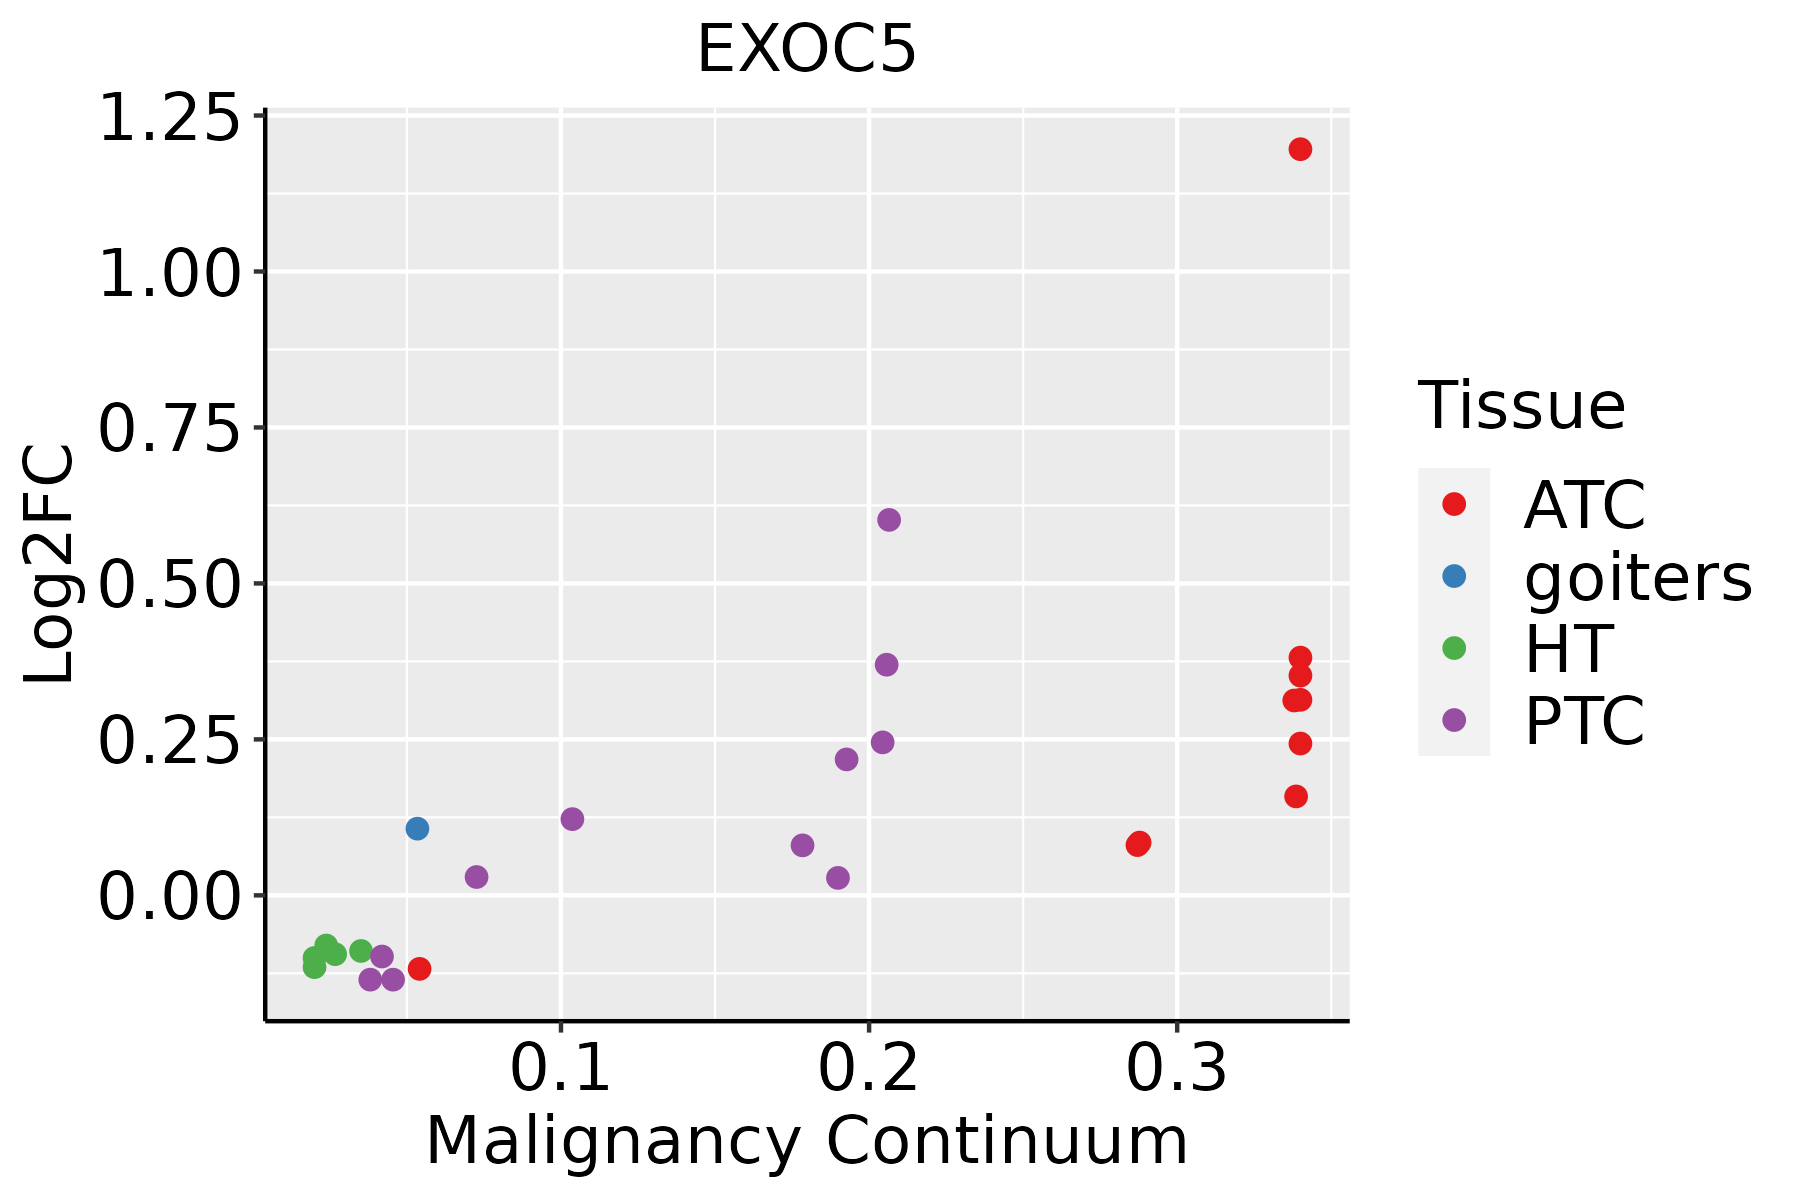 | ATC: Anaplastic thyroid cancer |
| HT: Hashimoto's thyroiditis | ||
| PTC: Papillary thyroid cancer |
| ∗log2FC in expression of this searched gene in stem-like cells from each diseased tissue sample relative to stem-like cells in normal samples in each tissue plotted against the malignancy continuum. Samples are colored based on if they are from different disease stage. |
Top |
Malignant transformation related pathway analysis |
| Find out the enriched GO biological processes and KEGG pathways involved in transition from healthy to precancer to cancer |
| Tissue | Disease Stage | Enriched GO biological Processes |
| Colorectum | AD |  |
| Colorectum | SER |  |
| Colorectum | MSS |  |
| Colorectum | MSI-H |  |
| Colorectum | FAP |  |
| ∗Top 15 enriched GO BP terms are showed in the bar plot of each disease state in each tissue. Each row represents a significant GO biological process which is colored according to the -log10(p.adjust). |
| Page: 1 2 3 4 5 6 7 8 9 |
| GO ID | Tissue | Disease Stage | Description | Gene Ratio | Bg Ratio | pvalue | p.adjust | Count |
| GO:004819318 | Esophagus | ESCC | Golgi vesicle transport | 231/8552 | 296/18723 | 1.82e-30 | 9.63e-28 | 231 |
| GO:0072659110 | Esophagus | ESCC | protein localization to plasma membrane | 193/8552 | 284/18723 | 1.95e-14 | 1.03e-12 | 193 |
| GO:199077819 | Esophagus | ESCC | protein localization to cell periphery | 217/8552 | 333/18723 | 4.08e-13 | 1.88e-11 | 217 |
| GO:000689215 | Esophagus | ESCC | post-Golgi vesicle-mediated transport | 82/8552 | 104/18723 | 4.00e-12 | 1.55e-10 | 82 |
| GO:009887615 | Esophagus | ESCC | vesicle-mediated transport to the plasma membrane | 99/8552 | 136/18723 | 1.13e-10 | 3.39e-09 | 99 |
| GO:000689315 | Esophagus | ESCC | Golgi to plasma membrane transport | 48/8552 | 60/18723 | 5.11e-08 | 9.16e-07 | 48 |
| GO:00017387 | Esophagus | ESCC | morphogenesis of a polarized epithelium | 63/8552 | 94/18723 | 2.34e-05 | 2.00e-04 | 63 |
| GO:00017361 | Esophagus | ESCC | establishment of planar polarity | 45/8552 | 72/18723 | 2.97e-03 | 1.24e-02 | 45 |
| GO:00071641 | Esophagus | ESCC | establishment of tissue polarity | 45/8552 | 72/18723 | 2.97e-03 | 1.24e-02 | 45 |
| GO:19055153 | Esophagus | ESCC | non-motile cilium assembly | 39/8552 | 61/18723 | 3.08e-03 | 1.28e-02 | 39 |
| GO:19040197 | Esophagus | ESCC | epithelial cell apoptotic process | 68/8552 | 121/18723 | 1.27e-02 | 4.21e-02 | 68 |
| GO:00481936 | Liver | NAFLD | Golgi vesicle transport | 66/1882 | 296/18723 | 3.66e-10 | 9.30e-08 | 66 |
| GO:00068925 | Liver | NAFLD | post-Golgi vesicle-mediated transport | 31/1882 | 104/18723 | 1.70e-08 | 2.03e-06 | 31 |
| GO:00068934 | Liver | NAFLD | Golgi to plasma membrane transport | 19/1882 | 60/18723 | 3.60e-06 | 1.42e-04 | 19 |
| GO:00988765 | Liver | NAFLD | vesicle-mediated transport to the plasma membrane | 30/1882 | 136/18723 | 2.76e-05 | 7.39e-04 | 30 |
| GO:00726597 | Liver | NAFLD | protein localization to plasma membrane | 51/1882 | 284/18723 | 2.97e-05 | 7.83e-04 | 51 |
| GO:19907786 | Liver | NAFLD | protein localization to cell periphery | 56/1882 | 333/18723 | 8.29e-05 | 1.69e-03 | 56 |
| GO:1904019 | Liver | NAFLD | epithelial cell apoptotic process | 24/1882 | 121/18723 | 8.75e-04 | 1.07e-02 | 24 |
| GO:004819321 | Liver | HCC | Golgi vesicle transport | 217/7958 | 296/18723 | 2.58e-27 | 1.02e-24 | 217 |
| GO:007265921 | Liver | HCC | protein localization to plasma membrane | 177/7958 | 284/18723 | 1.02e-11 | 4.18e-10 | 177 |
| Page: 1 2 3 |
| Pathway ID | Tissue | Disease Stage | Description | Gene Ratio | Bg Ratio | pvalue | p.adjust | qvalue | Count |
| hsa05132211 | Esophagus | ESCC | Salmonella infection | 191/4205 | 249/8465 | 6.51e-19 | 5.45e-17 | 2.79e-17 | 191 |
| hsa05132310 | Esophagus | ESCC | Salmonella infection | 191/4205 | 249/8465 | 6.51e-19 | 5.45e-17 | 2.79e-17 | 191 |
| hsa0513214 | Liver | NAFLD | Salmonella infection | 55/1043 | 249/8465 | 8.48e-06 | 3.09e-04 | 2.49e-04 | 55 |
| hsa0513215 | Liver | NAFLD | Salmonella infection | 55/1043 | 249/8465 | 8.48e-06 | 3.09e-04 | 2.49e-04 | 55 |
| hsa0513242 | Liver | HCC | Salmonella infection | 178/4020 | 249/8465 | 5.90e-15 | 1.98e-13 | 1.10e-13 | 178 |
| hsa0513252 | Liver | HCC | Salmonella infection | 178/4020 | 249/8465 | 5.90e-15 | 1.98e-13 | 1.10e-13 | 178 |
| hsa0513230 | Oral cavity | OSCC | Salmonella infection | 174/3704 | 249/8465 | 2.67e-17 | 1.49e-15 | 7.58e-16 | 174 |
| hsa05132114 | Oral cavity | OSCC | Salmonella infection | 174/3704 | 249/8465 | 2.67e-17 | 1.49e-15 | 7.58e-16 | 174 |
| Page: 1 |
Top |
Cell-cell communication analysis |
| Identification of potential cell-cell interactions between two cell types and their ligand-receptor pairs for different disease states |
| Ligand | Receptor | LRpair | Pathway | Tissue | Disease Stage |
| Page: 1 |
Top |
Single-cell gene regulatory network inference analysis |
| Find out the significant the regulons (TFs) and the target genes of each regulon across cell types for different disease states |
| TF | Cell Type | Tissue | Disease Stage | Target Gene | RSS | Regulon Activity |
| ∗The dot plots of a searched regulon are shown for all cell subpopulations in each disease state of each tissue based on the regulon specific score inferred using pySCENIC and by calculating the average expression. |
| Page: 1 |
Top |
Somatic mutation of malignant transformation related genes |
| Annotation of somatic variants for genes involved in malignant transformation |
| Hugo Symbol | Variant Class | Variant Classification | dbSNP RS | HGVSc | HGVSp | HGVSp Short | SWISSPROT | BIOTYPE | SIFT | PolyPhen | Tumor Sample Barcode | Tissue | Histology | Sex | Age | Stage | Therapy Types | Drugs | Outcome |
| EXOC5 | SNV | Missense_Mutation | c.89C>G | p.Ser30Cys | p.S30C | O00471 | protein_coding | deleterious(0.02) | possibly_damaging(0.887) | TCGA-A8-A094-01 | Breast | breast invasive carcinoma | Female | >=65 | I/II | Unknown | Unknown | SD | |
| EXOC5 | SNV | Missense_Mutation | rs868177967 | c.2083N>T | p.Arg695Cys | p.R695C | O00471 | protein_coding | deleterious(0.02) | benign(0.049) | TCGA-AN-A046-01 | Breast | breast invasive carcinoma | Female | >=65 | I/II | Unknown | Unknown | SD |
| EXOC5 | SNV | Missense_Mutation | novel | c.43G>A | p.Asp15Asn | p.D15N | O00471 | protein_coding | tolerated(0.12) | possibly_damaging(0.614) | TCGA-GM-A2DO-01 | Breast | breast invasive carcinoma | Female | <65 | I/II | Hormone Therapy | tamoxiphen | CR |
| EXOC5 | SNV | Missense_Mutation | c.2047C>G | p.Leu683Val | p.L683V | O00471 | protein_coding | deleterious(0) | probably_damaging(0.997) | TCGA-EK-A2RK-01 | Cervix | cervical & endocervical cancer | Female | >=65 | I/II | Unknown | Unknown | SD | |
| EXOC5 | SNV | Missense_Mutation | novel | c.107N>A | p.Ala36Asp | p.A36D | O00471 | protein_coding | tolerated(0.64) | benign(0.025) | TCGA-EK-A2RM-01 | Cervix | cervical & endocervical cancer | Female | <65 | I/II | Unknown | Unknown | SD |
| EXOC5 | SNV | Missense_Mutation | rs374048935 | c.1747N>A | p.Val583Ile | p.V583I | O00471 | protein_coding | tolerated(0.49) | benign(0.084) | TCGA-VS-A9V5-01 | Cervix | cervical & endocervical cancer | Female | <65 | I/II | Chemotherapy | carboplatin | PD |
| EXOC5 | insertion | Frame_Shift_Ins | novel | c.1966_1967insGACATTC | p.Thr656ArgfsTer17 | p.T656Rfs*17 | O00471 | protein_coding | TCGA-DS-A1OC-01 | Cervix | cervical & endocervical cancer | Female | <65 | I/II | Chemotherapy | gemcitabine | SD | ||
| EXOC5 | SNV | Missense_Mutation | rs868177967 | c.2083N>T | p.Arg695Cys | p.R695C | O00471 | protein_coding | deleterious(0.02) | benign(0.049) | TCGA-AA-3510-01 | Colorectum | colon adenocarcinoma | Male | >=65 | I/II | Unknown | Unknown | SD |
| EXOC5 | SNV | Missense_Mutation | novel | c.479C>T | p.Ala160Val | p.A160V | O00471 | protein_coding | deleterious(0) | possibly_damaging(0.451) | TCGA-AA-3947-01 | Colorectum | colon adenocarcinoma | Female | <65 | I/II | Unknown | Unknown | SD |
| EXOC5 | SNV | Missense_Mutation | rs868177967 | c.2083N>T | p.Arg695Cys | p.R695C | O00471 | protein_coding | deleterious(0.02) | benign(0.049) | TCGA-AA-A00N-01 | Colorectum | colon adenocarcinoma | Male | >=65 | I/II | Unknown | Unknown | PD |
| Page: 1 2 3 4 5 6 7 |
Top |
Related drugs of malignant transformation related genes |
| Identification of chemicals and drugs interact with genes involved in malignant transfromation |
| (DGIdb 4.0) |
| Entrez ID | Symbol | Category | Interaction Types | Drug Claim Name | Drug Name | PMIDs |
| Page: 1 |

Copyright 2023-Present -The University of Texas Health Science Center at Houston |