
|
|||||
|
 | |
| |
| |
| |
| |
| |
|
Gene: EXOC3 |
Gene summary for EXOC3 |
| Gene information | Species | Human | Gene symbol | EXOC3 | Gene ID | 11336 |
| Gene name | exocyst complex component 3 | |
| Gene Alias | SEC6 | |
| Cytomap | 5p15.33 | |
| Gene Type | protein-coding | GO ID | GO:0006810 | UniProtAcc | A0A024QYZ6 |
Top |
Malignant transformation analysis |
| Identification of the aberrant gene expression in precancerous and cancerous lesions by comparing the gene expression of stem-like cells in diseased tissues with normal stem cells |
| Entrez ID | Symbol | Replicates | Species | Organ | Tissue | Adj P-value | Log2FC | Malignancy |
| 11336 | EXOC3 | Tumor | Human | Cervix | CC | 1.93e-14 | 5.20e-01 | 0.1241 |
| 11336 | EXOC3 | sample3 | Human | Cervix | CC | 1.87e-28 | 5.13e-01 | 0.1387 |
| 11336 | EXOC3 | L1 | Human | Cervix | CC | 1.96e-08 | 5.37e-01 | 0.0802 |
| 11336 | EXOC3 | T3 | Human | Cervix | CC | 2.65e-12 | 4.67e-01 | 0.1389 |
| 11336 | EXOC3 | LZE4T | Human | Esophagus | ESCC | 7.33e-07 | 2.14e-01 | 0.0811 |
| 11336 | EXOC3 | LZE8T | Human | Esophagus | ESCC | 3.91e-07 | 2.82e-01 | 0.067 |
| 11336 | EXOC3 | LZE20T | Human | Esophagus | ESCC | 2.60e-05 | 2.57e-01 | 0.0662 |
| 11336 | EXOC3 | LZE22T | Human | Esophagus | ESCC | 6.13e-05 | 2.77e-01 | 0.068 |
| 11336 | EXOC3 | LZE24T | Human | Esophagus | ESCC | 1.94e-06 | 1.61e-01 | 0.0596 |
| 11336 | EXOC3 | LZE21T | Human | Esophagus | ESCC | 9.50e-04 | 2.59e-01 | 0.0655 |
| 11336 | EXOC3 | LZE6T | Human | Esophagus | ESCC | 2.94e-04 | 2.11e-01 | 0.0845 |
| 11336 | EXOC3 | P1T-E | Human | Esophagus | ESCC | 8.47e-12 | 3.78e-01 | 0.0875 |
| 11336 | EXOC3 | P2T-E | Human | Esophagus | ESCC | 1.79e-10 | 1.83e-01 | 0.1177 |
| 11336 | EXOC3 | P4T-E | Human | Esophagus | ESCC | 5.48e-19 | 4.80e-01 | 0.1323 |
| 11336 | EXOC3 | P5T-E | Human | Esophagus | ESCC | 2.90e-15 | 1.70e-01 | 0.1327 |
| 11336 | EXOC3 | P8T-E | Human | Esophagus | ESCC | 8.80e-17 | 4.14e-01 | 0.0889 |
| 11336 | EXOC3 | P9T-E | Human | Esophagus | ESCC | 4.73e-12 | 2.82e-01 | 0.1131 |
| 11336 | EXOC3 | P10T-E | Human | Esophagus | ESCC | 9.40e-25 | 4.38e-01 | 0.116 |
| 11336 | EXOC3 | P11T-E | Human | Esophagus | ESCC | 2.50e-07 | 2.50e-01 | 0.1426 |
| 11336 | EXOC3 | P12T-E | Human | Esophagus | ESCC | 4.39e-18 | 2.44e-01 | 0.1122 |
| Page: 1 2 3 4 5 6 7 |
| Tissue | Expression Dynamics | Abbreviation |
| Cervix | 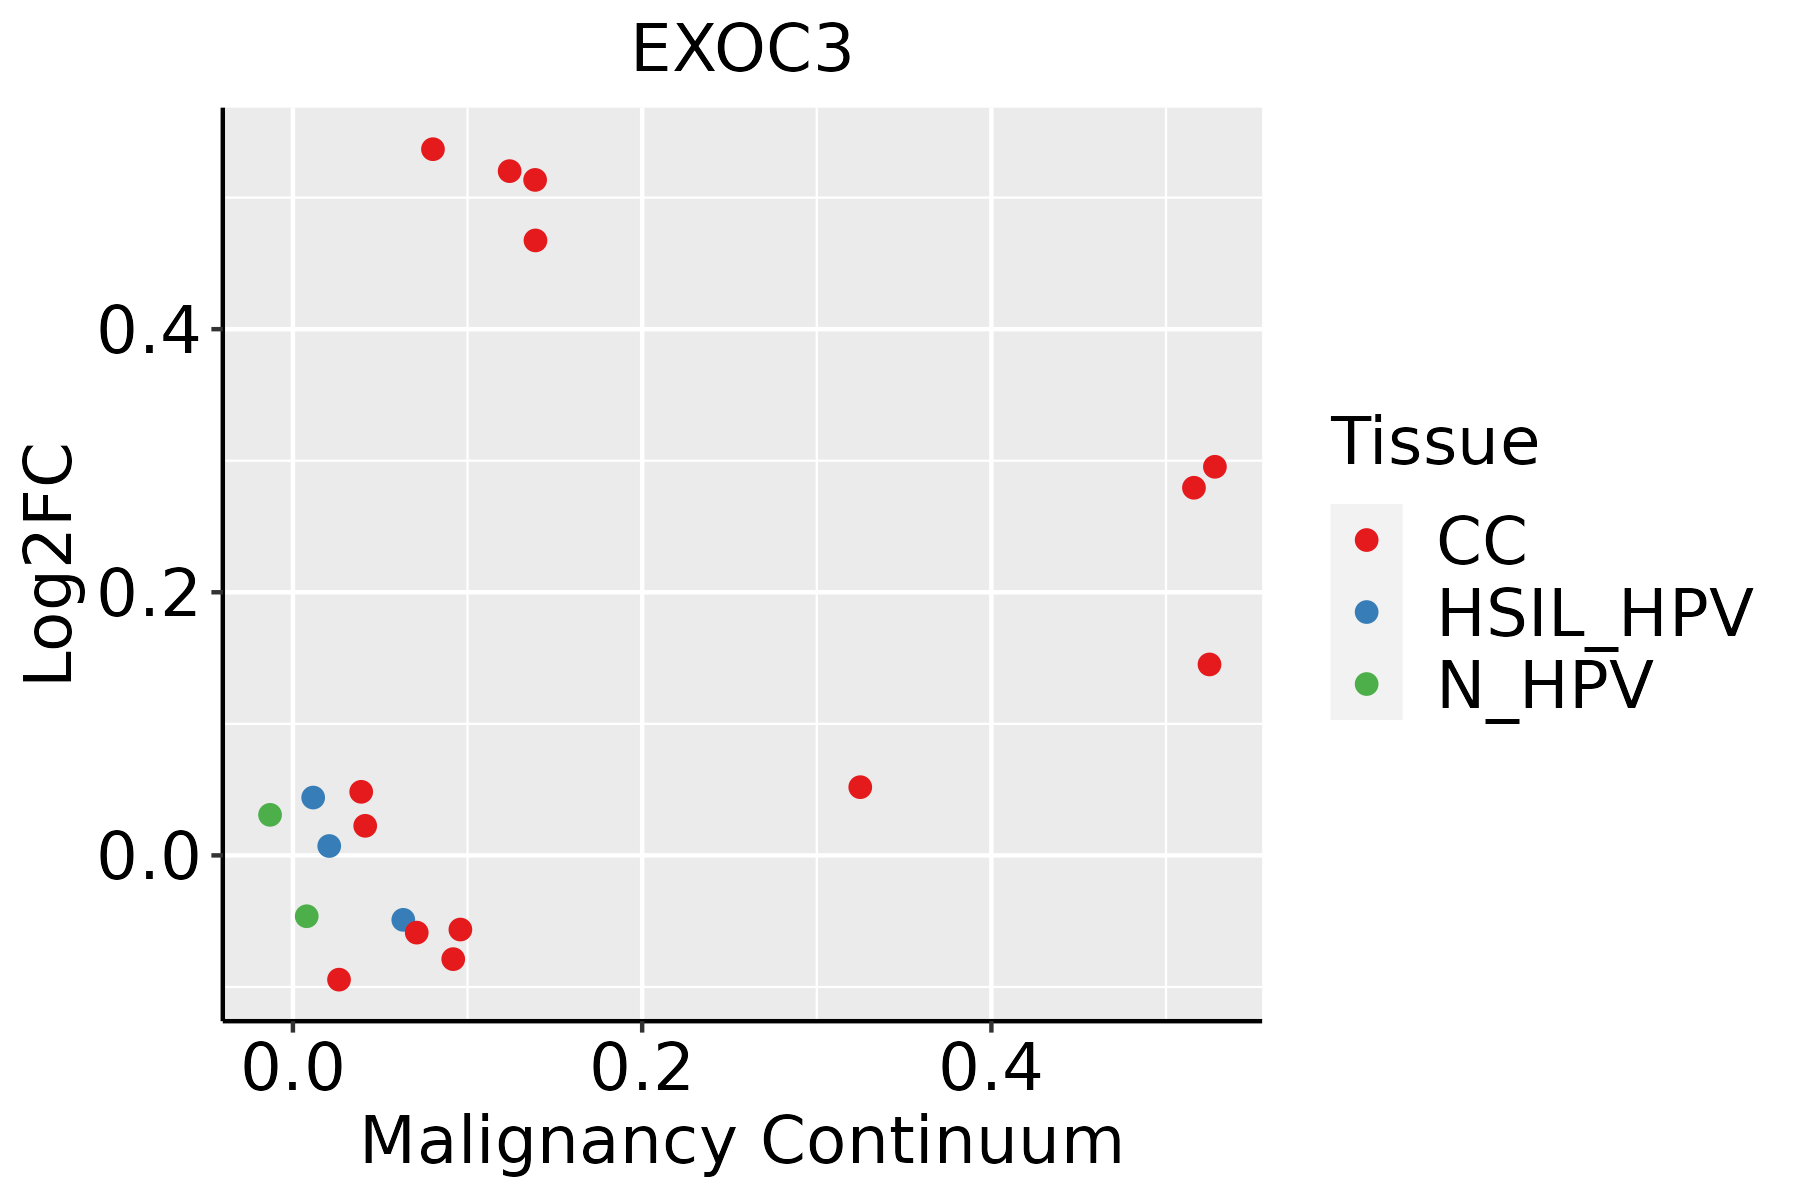 | CC: Cervix cancer |
| HSIL_HPV: HPV-infected high-grade squamous intraepithelial lesions | ||
| N_HPV: HPV-infected normal cervix | ||
| Esophagus | 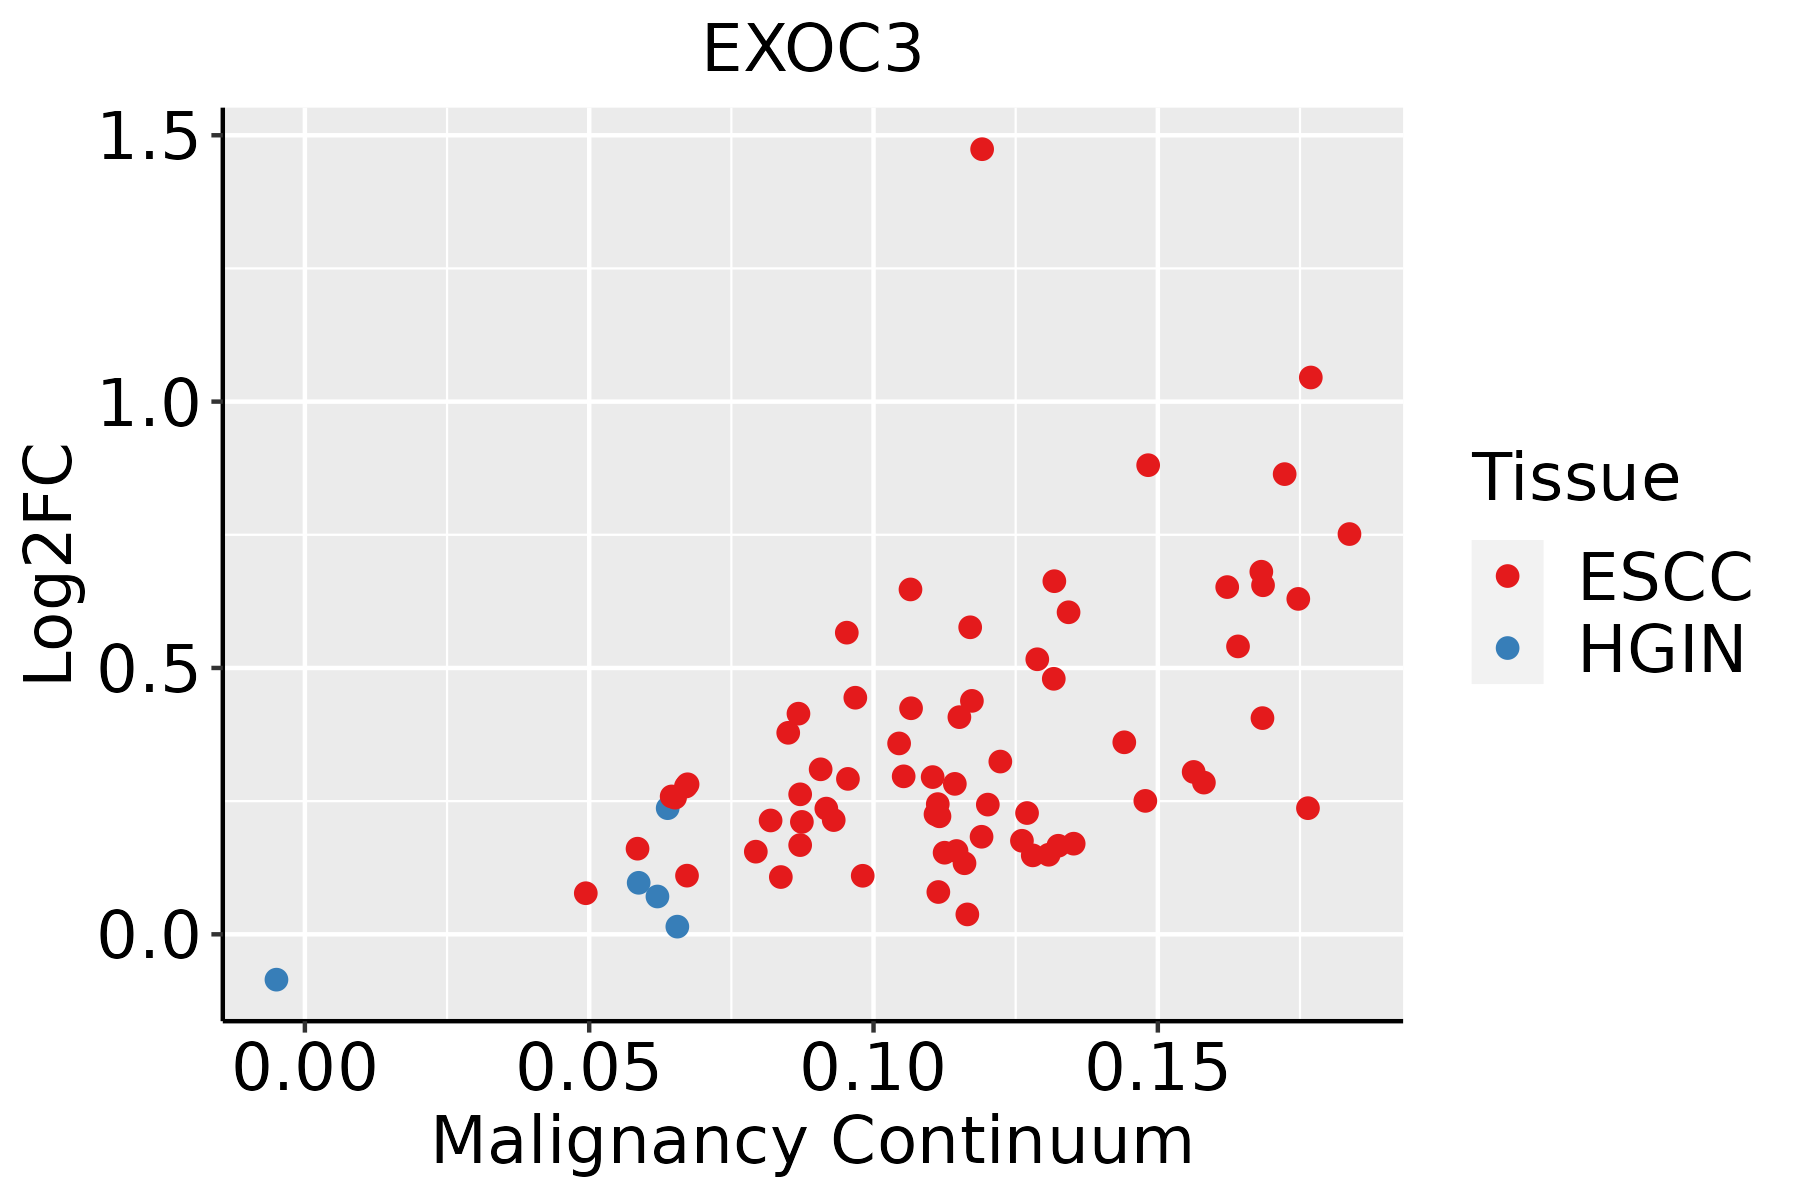 | ESCC: Esophageal squamous cell carcinoma |
| HGIN: High-grade intraepithelial neoplasias | ||
| LGIN: Low-grade intraepithelial neoplasias | ||
| Liver |  | HCC: Hepatocellular carcinoma |
| NAFLD: Non-alcoholic fatty liver disease | ||
| Lung | 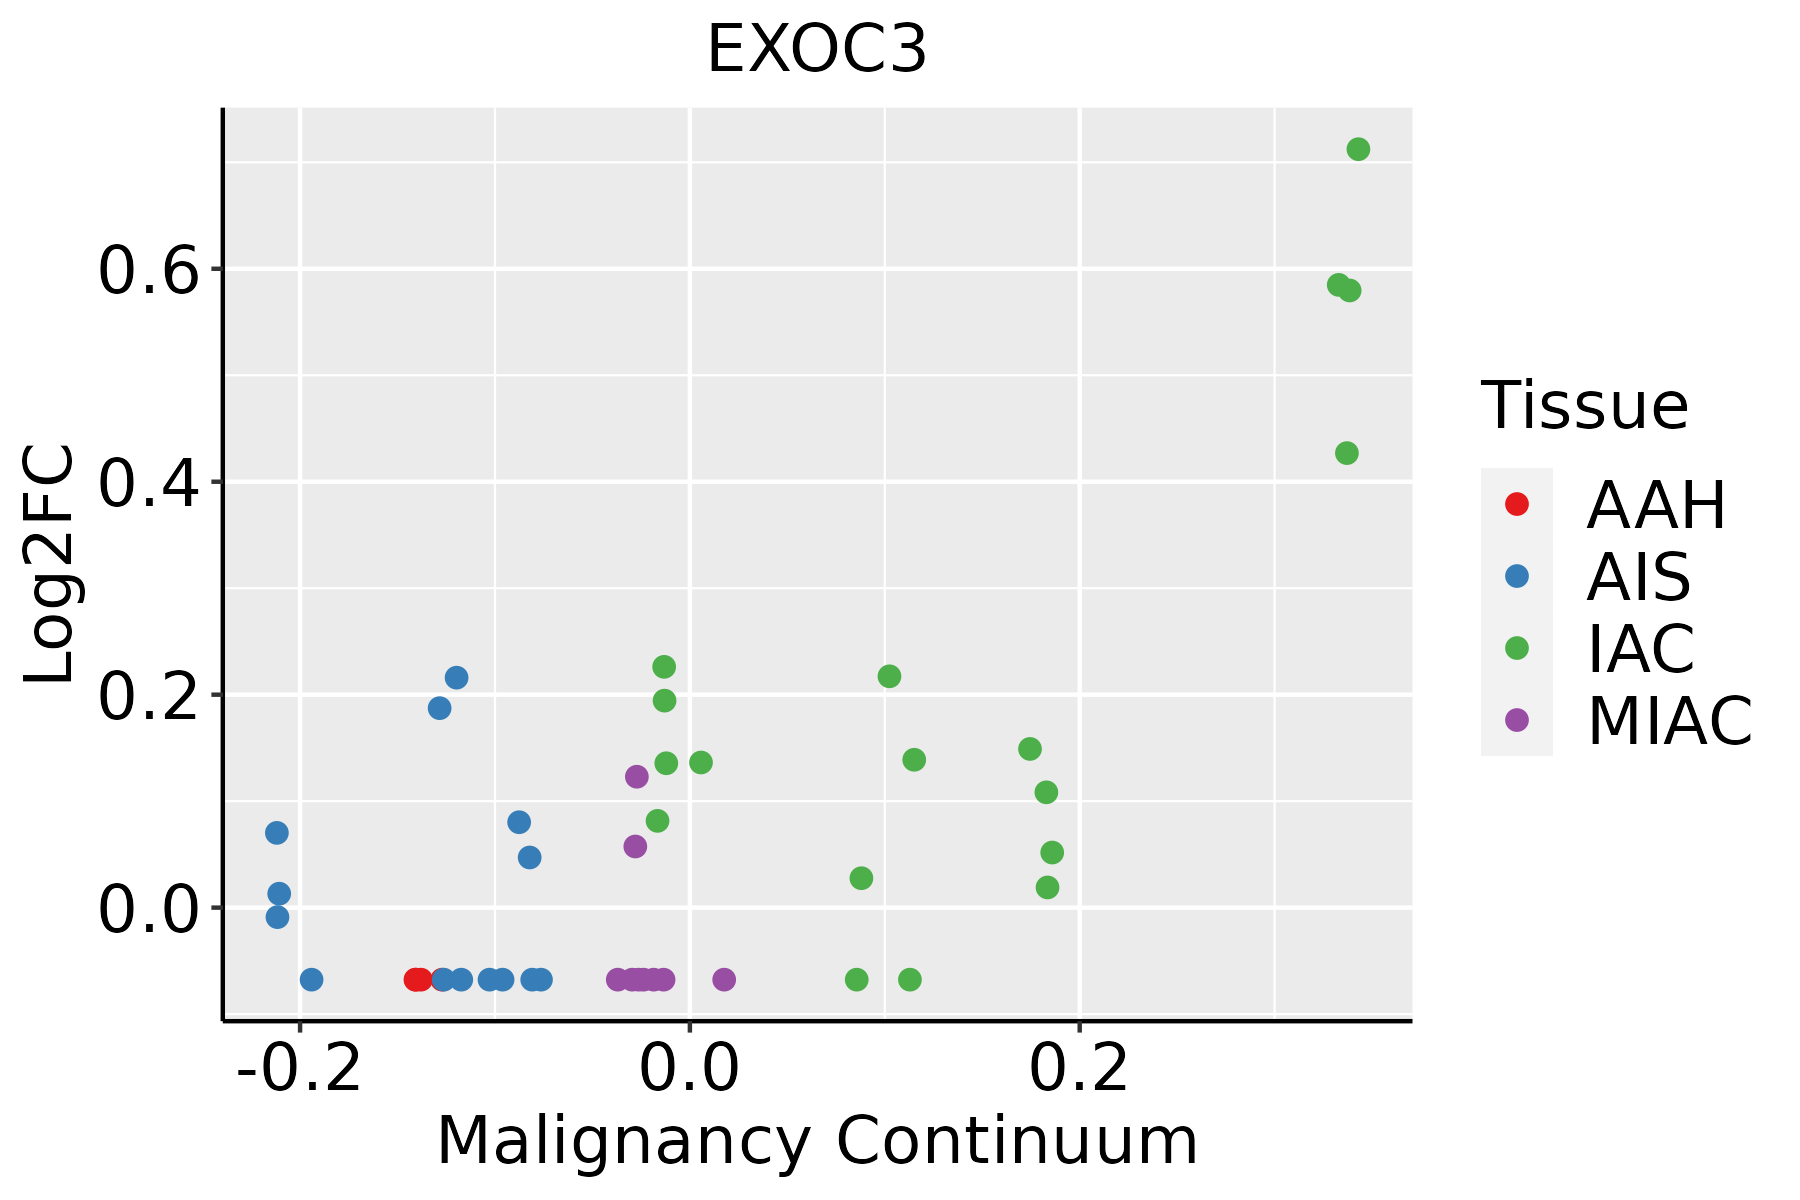 | AAH: Atypical adenomatous hyperplasia |
| AIS: Adenocarcinoma in situ | ||
| IAC: Invasive lung adenocarcinoma | ||
| MIA: Minimally invasive adenocarcinoma | ||
| Oral Cavity |  | EOLP: Erosive Oral lichen planus |
| LP: leukoplakia | ||
| NEOLP: Non-erosive oral lichen planus | ||
| OSCC: Oral squamous cell carcinoma | ||
| Skin |  | AK: Actinic keratosis |
| cSCC: Cutaneous squamous cell carcinoma | ||
| SCCIS:squamous cell carcinoma in situ | ||
| Thyroid |  | ATC: Anaplastic thyroid cancer |
| HT: Hashimoto's thyroiditis | ||
| PTC: Papillary thyroid cancer |
| ∗log2FC in expression of this searched gene in stem-like cells from each diseased tissue sample relative to stem-like cells in normal samples in each tissue plotted against the malignancy continuum. Samples are colored based on if they are from different disease stage. |
Top |
Malignant transformation related pathway analysis |
| Find out the enriched GO biological processes and KEGG pathways involved in transition from healthy to precancer to cancer |
| Tissue | Disease Stage | Enriched GO biological Processes |
| Colorectum | AD |  |
| Colorectum | SER |  |
| Colorectum | MSS |  |
| Colorectum | MSI-H |  |
| Colorectum | FAP |  |
| ∗Top 15 enriched GO BP terms are showed in the bar plot of each disease state in each tissue. Each row represents a significant GO biological process which is colored according to the -log10(p.adjust). |
| Page: 1 2 3 4 5 6 7 8 9 |
| GO ID | Tissue | Disease Stage | Description | Gene Ratio | Bg Ratio | pvalue | p.adjust | Count |
| GO:00068873 | Cervix | CC | exocytosis | 59/2311 | 352/18723 | 8.74e-03 | 4.48e-02 | 59 |
| GO:003150314 | Esophagus | ESCC | protein-containing complex localization | 139/8552 | 220/18723 | 1.14e-07 | 1.85e-06 | 139 |
| GO:00315031 | Liver | HCC | protein-containing complex localization | 129/7958 | 220/18723 | 9.38e-07 | 1.42e-05 | 129 |
| GO:0034629 | Liver | HCC | cellular protein-containing complex localization | 17/7958 | 22/18723 | 9.84e-04 | 5.70e-03 | 17 |
| GO:00315032 | Lung | IAC | protein-containing complex localization | 42/2061 | 220/18723 | 2.60e-04 | 4.32e-03 | 42 |
| GO:00315034 | Oral cavity | OSCC | protein-containing complex localization | 123/7305 | 220/18723 | 2.54e-07 | 4.00e-06 | 123 |
| GO:003150313 | Oral cavity | LP | protein-containing complex localization | 82/4623 | 220/18723 | 2.08e-05 | 3.44e-04 | 82 |
| GO:003150315 | Skin | cSCC | protein-containing complex localization | 95/4864 | 220/18723 | 2.00e-08 | 5.82e-07 | 95 |
| GO:00315037 | Thyroid | PTC | protein-containing complex localization | 107/5968 | 220/18723 | 1.47e-07 | 2.82e-06 | 107 |
| GO:003150316 | Thyroid | ATC | protein-containing complex localization | 108/6293 | 220/18723 | 1.33e-06 | 1.69e-05 | 108 |
| Page: 1 |
| Pathway ID | Tissue | Disease Stage | Description | Gene Ratio | Bg Ratio | pvalue | p.adjust | qvalue | Count |
| Page: 1 |
Top |
Cell-cell communication analysis |
| Identification of potential cell-cell interactions between two cell types and their ligand-receptor pairs for different disease states |
| Ligand | Receptor | LRpair | Pathway | Tissue | Disease Stage |
| Page: 1 |
Top |
Single-cell gene regulatory network inference analysis |
| Find out the significant the regulons (TFs) and the target genes of each regulon across cell types for different disease states |
| TF | Cell Type | Tissue | Disease Stage | Target Gene | RSS | Regulon Activity |
| ∗The dot plots of a searched regulon are shown for all cell subpopulations in each disease state of each tissue based on the regulon specific score inferred using pySCENIC and by calculating the average expression. |
| Page: 1 |
Top |
Somatic mutation of malignant transformation related genes |
| Annotation of somatic variants for genes involved in malignant transformation |
| Hugo Symbol | Variant Class | Variant Classification | dbSNP RS | HGVSc | HGVSp | HGVSp Short | SWISSPROT | BIOTYPE | SIFT | PolyPhen | Tumor Sample Barcode | Tissue | Histology | Sex | Age | Stage | Therapy Types | Drugs | Outcome |
| EXOC3 | SNV | Missense_Mutation | novel | c.1861N>C | p.Glu621Gln | p.E621Q | O60645 | protein_coding | deleterious(0.04) | possibly_damaging(0.506) | TCGA-5L-AAT1-01 | Breast | breast invasive carcinoma | Female | <65 | III/IV | Hormone Therapy | letrozol | SD |
| EXOC3 | SNV | Missense_Mutation | novel | c.1225N>C | p.Glu409Gln | p.E409Q | O60645 | protein_coding | tolerated(0.09) | benign(0.255) | TCGA-A2-A0YK-01 | Breast | breast invasive carcinoma | Female | <65 | I/II | Chemotherapy | cytoxan | SD |
| EXOC3 | SNV | Missense_Mutation | novel | c.577A>G | p.Met193Val | p.M193V | O60645 | protein_coding | tolerated(0.24) | benign(0) | TCGA-BH-A0DP-01 | Breast | breast invasive carcinoma | Female | <65 | I/II | Hormone Therapy | arimidex | SD |
| EXOC3 | SNV | Missense_Mutation | c.757N>C | p.Glu253Gln | p.E253Q | O60645 | protein_coding | deleterious(0.04) | benign(0.092) | TCGA-C8-A1HM-01 | Breast | breast invasive carcinoma | Female | >=65 | I/II | Chemotherapy | doxorubicin | CR | |
| EXOC3 | SNV | Missense_Mutation | rs543578098 | c.1913N>A | p.Arg638His | p.R638H | O60645 | protein_coding | tolerated(0.34) | benign(0.038) | TCGA-D8-A1XT-01 | Breast | breast invasive carcinoma | Female | <65 | I/II | Chemotherapy | adriamycin+cyclophosphamide | SD |
| EXOC3 | insertion | In_Frame_Ins | novel | c.1122_1123insAGAGTTCCAAAGATA | p.His374_Val375insArgValProLysIle | p.H374_V375insRVPKI | O60645 | protein_coding | TCGA-B6-A0I6-01 | Breast | breast invasive carcinoma | Female | <65 | I/II | Unknown | Unknown | PD | ||
| EXOC3 | insertion | Nonsense_Mutation | novel | c.1033_1034insTTCACCATCTTGGAGAGGACTGTGACCACCAGAATTGAGGGC | p.Asn345delinsIleHisHisLeuGlyGluAspCysAspHisGlnAsnTerGlyHis | p.N345delinsIHHLGEDCDHQN*GH | O60645 | protein_coding | TCGA-B6-A0I8-01 | Breast | breast invasive carcinoma | Female | <65 | I/II | Unknown | Unknown | PD | ||
| EXOC3 | SNV | Missense_Mutation | novel | c.264N>C | p.Gln88His | p.Q88H | O60645 | protein_coding | deleterious(0.03) | possibly_damaging(0.827) | TCGA-C5-A8XJ-01 | Cervix | cervical & endocervical cancer | Female | >=65 | I/II | Chemotherapy | cisplatin | SD |
| EXOC3 | SNV | Missense_Mutation | rs376575084 | c.16C>T | p.Arg6Trp | p.R6W | O60645 | protein_coding | deleterious(0) | possibly_damaging(0.859) | TCGA-FU-A5XV-01 | Cervix | cervical & endocervical cancer | Female | <65 | III/IV | Unknown | Unknown | SD |
| EXOC3 | SNV | Missense_Mutation | c.1789N>A | p.Glu597Lys | p.E597K | O60645 | protein_coding | tolerated(0.32) | benign(0.104) | TCGA-Q1-A73O-01 | Cervix | cervical & endocervical cancer | Female | <65 | I/II | Chemotherapy | cisplatin | CR |
| Page: 1 2 3 4 5 6 7 8 9 |
Top |
Related drugs of malignant transformation related genes |
| Identification of chemicals and drugs interact with genes involved in malignant transfromation |
| (DGIdb 4.0) |
| Entrez ID | Symbol | Category | Interaction Types | Drug Claim Name | Drug Name | PMIDs |
| Page: 1 |

Copyright 2023-Present -The University of Texas Health Science Center at Houston |