Schematic overview of the cellular and molecular mechanisms involved in the cancer progression, including the proposed cellular and molecular mechanisms in cancer cells trajectory. AT1: alveolar type 1 cells; AT2: alveolar type 2 cells; AAH: atypical adenomatous hyperplasia; AIS: adenocarcinoma in situ; MIA: minimally invasive adenocarcinoma; IA: invasive adenocarcinoma; EMT: epithelial-mesenchymal transition

Home

Download

Statistics

Help

Contact

Center for Computational Systems Medicine
leaf

Gene summary

leaf

Malignant transformation analysis

leaf

Malignant transformation related pathway analysis

leaf

Cell-cell communication analysis

leaf

Single-cell gene regulatory network inference analysis

leaf

Somatic mutation of malignant transformation related genes

leaf

Related drugs of malignant transformation related genes

Gene: EXOC1

Gene summary for EXOC1

check button Gene summary.

Gene informationSpeciesHuman
Gene symbol

EXOC1

Gene ID

55763

Gene nameexocyst complex component 1
Gene AliasBM-102
Cytomap4q12
Gene Typeprotein-coding
GO ID

GO:0002376

UniProtAcc

A0A024RDA9


Top

Malignant transformation analysis

check button Identification of the aberrant gene expression in precancerous and cancerous lesions by comparing the gene expression of stem-like cells in diseased tissues with normal stem cells
check button Malignant transformation involving gene list.
Entrez IDSymbolReplicatesSpeciesOrganTissueAdj P-valueLog2FCMalignancy
55763EXOC1LZE4THumanEsophagusESCC1.24e-094.86e-010.0811
55763EXOC1LZE7THumanEsophagusESCC5.52e-062.66e-010.0667
55763EXOC1LZE8THumanEsophagusESCC1.70e-031.65e-010.067
55763EXOC1LZE20THumanEsophagusESCC4.48e-041.50e-010.0662
55763EXOC1LZE24THumanEsophagusESCC1.79e-093.17e-010.0596
55763EXOC1LZE21THumanEsophagusESCC4.38e-063.40e-010.0655
55763EXOC1LZE6THumanEsophagusESCC1.21e-022.28e-010.0845
55763EXOC1P1T-EHumanEsophagusESCC2.66e-073.63e-010.0875
55763EXOC1P2T-EHumanEsophagusESCC1.67e-234.35e-010.1177
55763EXOC1P4T-EHumanEsophagusESCC6.43e-194.45e-010.1323
55763EXOC1P5T-EHumanEsophagusESCC7.81e-071.07e-010.1327
55763EXOC1P8T-EHumanEsophagusESCC6.18e-233.96e-010.0889
55763EXOC1P9T-EHumanEsophagusESCC4.43e-048.73e-020.1131
55763EXOC1P10T-EHumanEsophagusESCC6.90e-091.76e-010.116
55763EXOC1P11T-EHumanEsophagusESCC8.93e-114.70e-010.1426
55763EXOC1P12T-EHumanEsophagusESCC2.29e-152.89e-010.1122
55763EXOC1P15T-EHumanEsophagusESCC1.60e-152.93e-010.1149
55763EXOC1P16T-EHumanEsophagusESCC7.21e-192.70e-010.1153
55763EXOC1P17T-EHumanEsophagusESCC3.09e-022.76e-010.1278
55763EXOC1P19T-EHumanEsophagusESCC5.43e-043.95e-010.1662
Page: 1 2 3 4 5 

check button Transcriptomic changes along malignancy continuum.
TissueExpression DynamicsAbbreviation
EsophagusThe image shows the transcriptomic changes along malignancy continuum.log2FC in expression of this searched gene in stem-like cells from each diseased tissue sample relative to stem-like cells in normal samples in each tissue plotted against the malignancy continuum. Samples are colored based on if they are from different disease stage.ESCC: Esophageal squamous cell carcinoma
HGIN: High-grade intraepithelial neoplasias
LGIN: Low-grade intraepithelial neoplasias
Oral CavityThe image shows the transcriptomic changes along malignancy continuum.log2FC in expression of this searched gene in stem-like cells from each diseased tissue sample relative to stem-like cells in normal samples in each tissue plotted against the malignancy continuum. Samples are colored based on if they are from different disease stage.
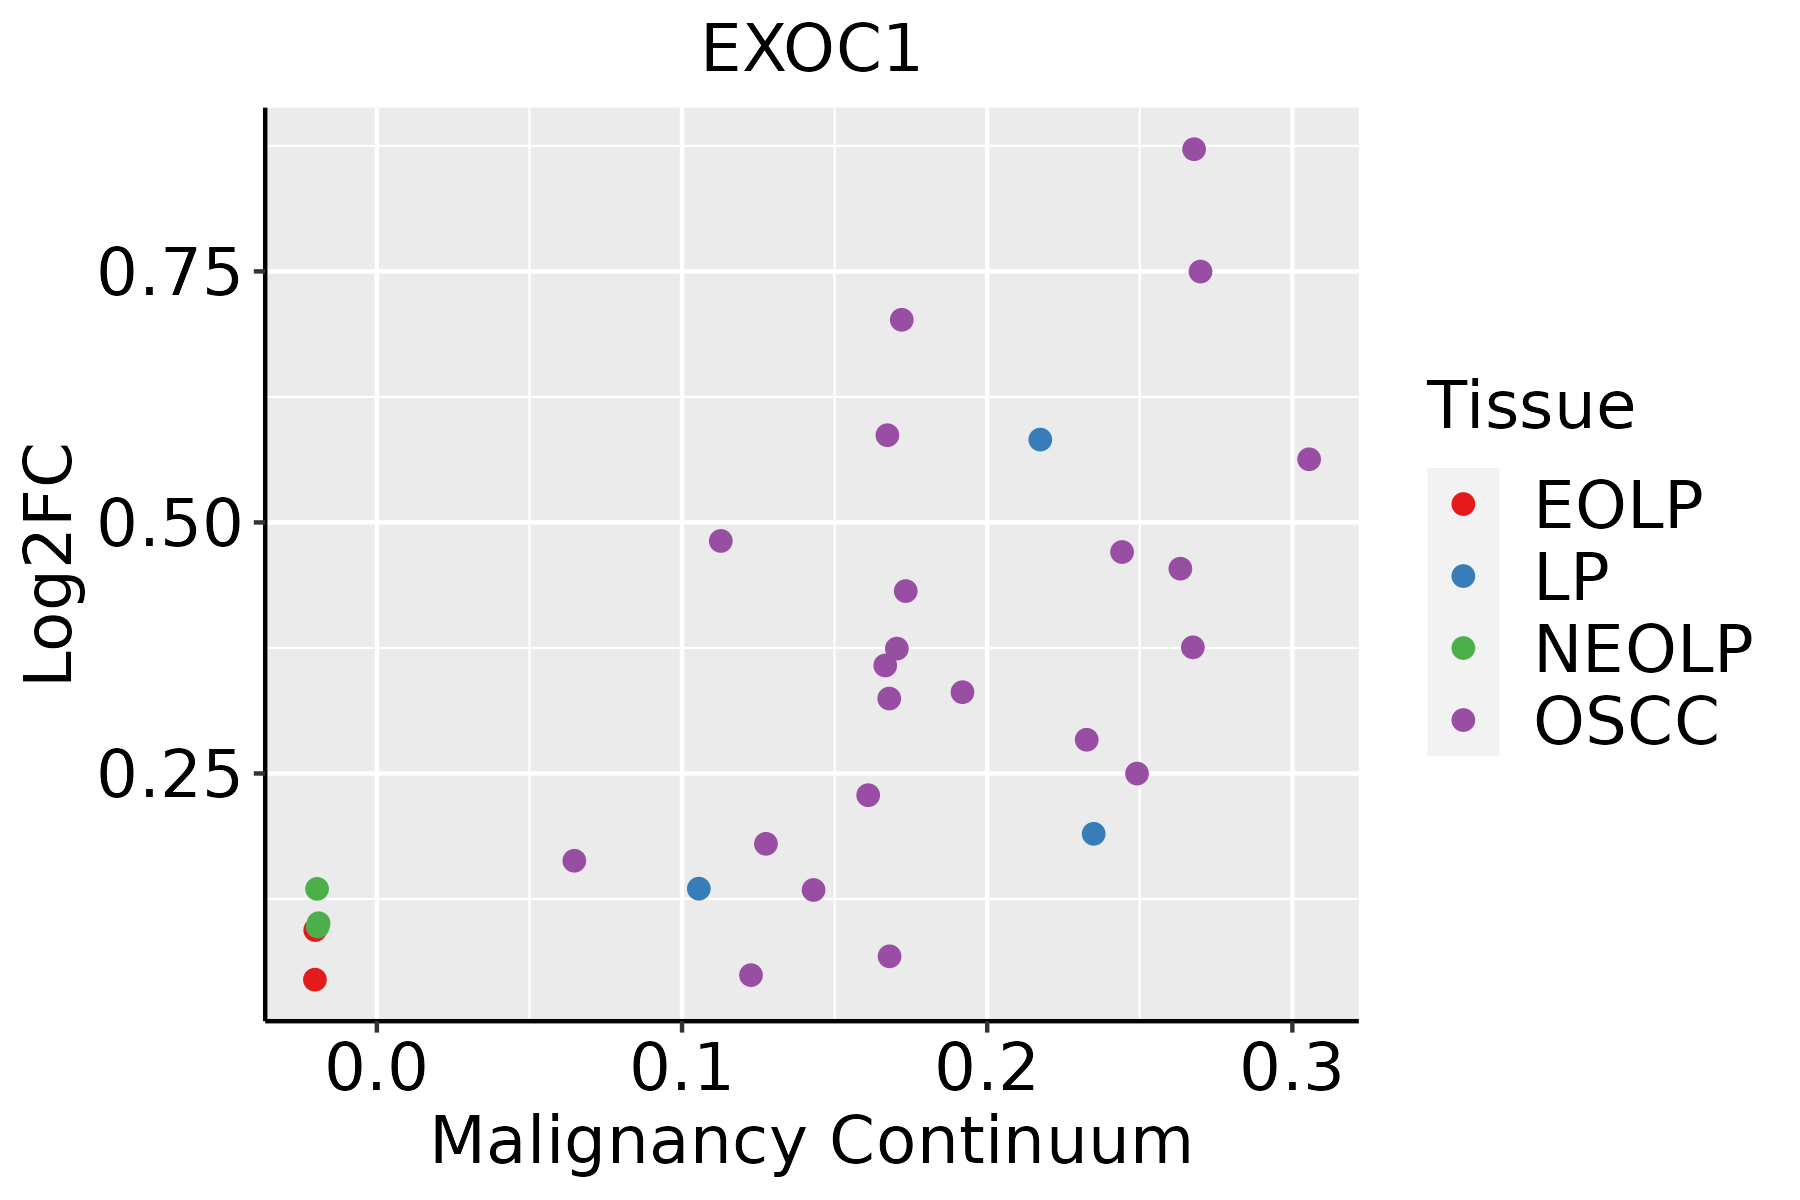
EOLP: Erosive Oral lichen planus
LP: leukoplakia
NEOLP: Non-erosive oral lichen planus
OSCC: Oral squamous cell carcinoma
SkinThe image shows the transcriptomic changes along malignancy continuum.log2FC in expression of this searched gene in stem-like cells from each diseased tissue sample relative to stem-like cells in normal samples in each tissue plotted against the malignancy continuum. Samples are colored based on if they are from different disease stage.
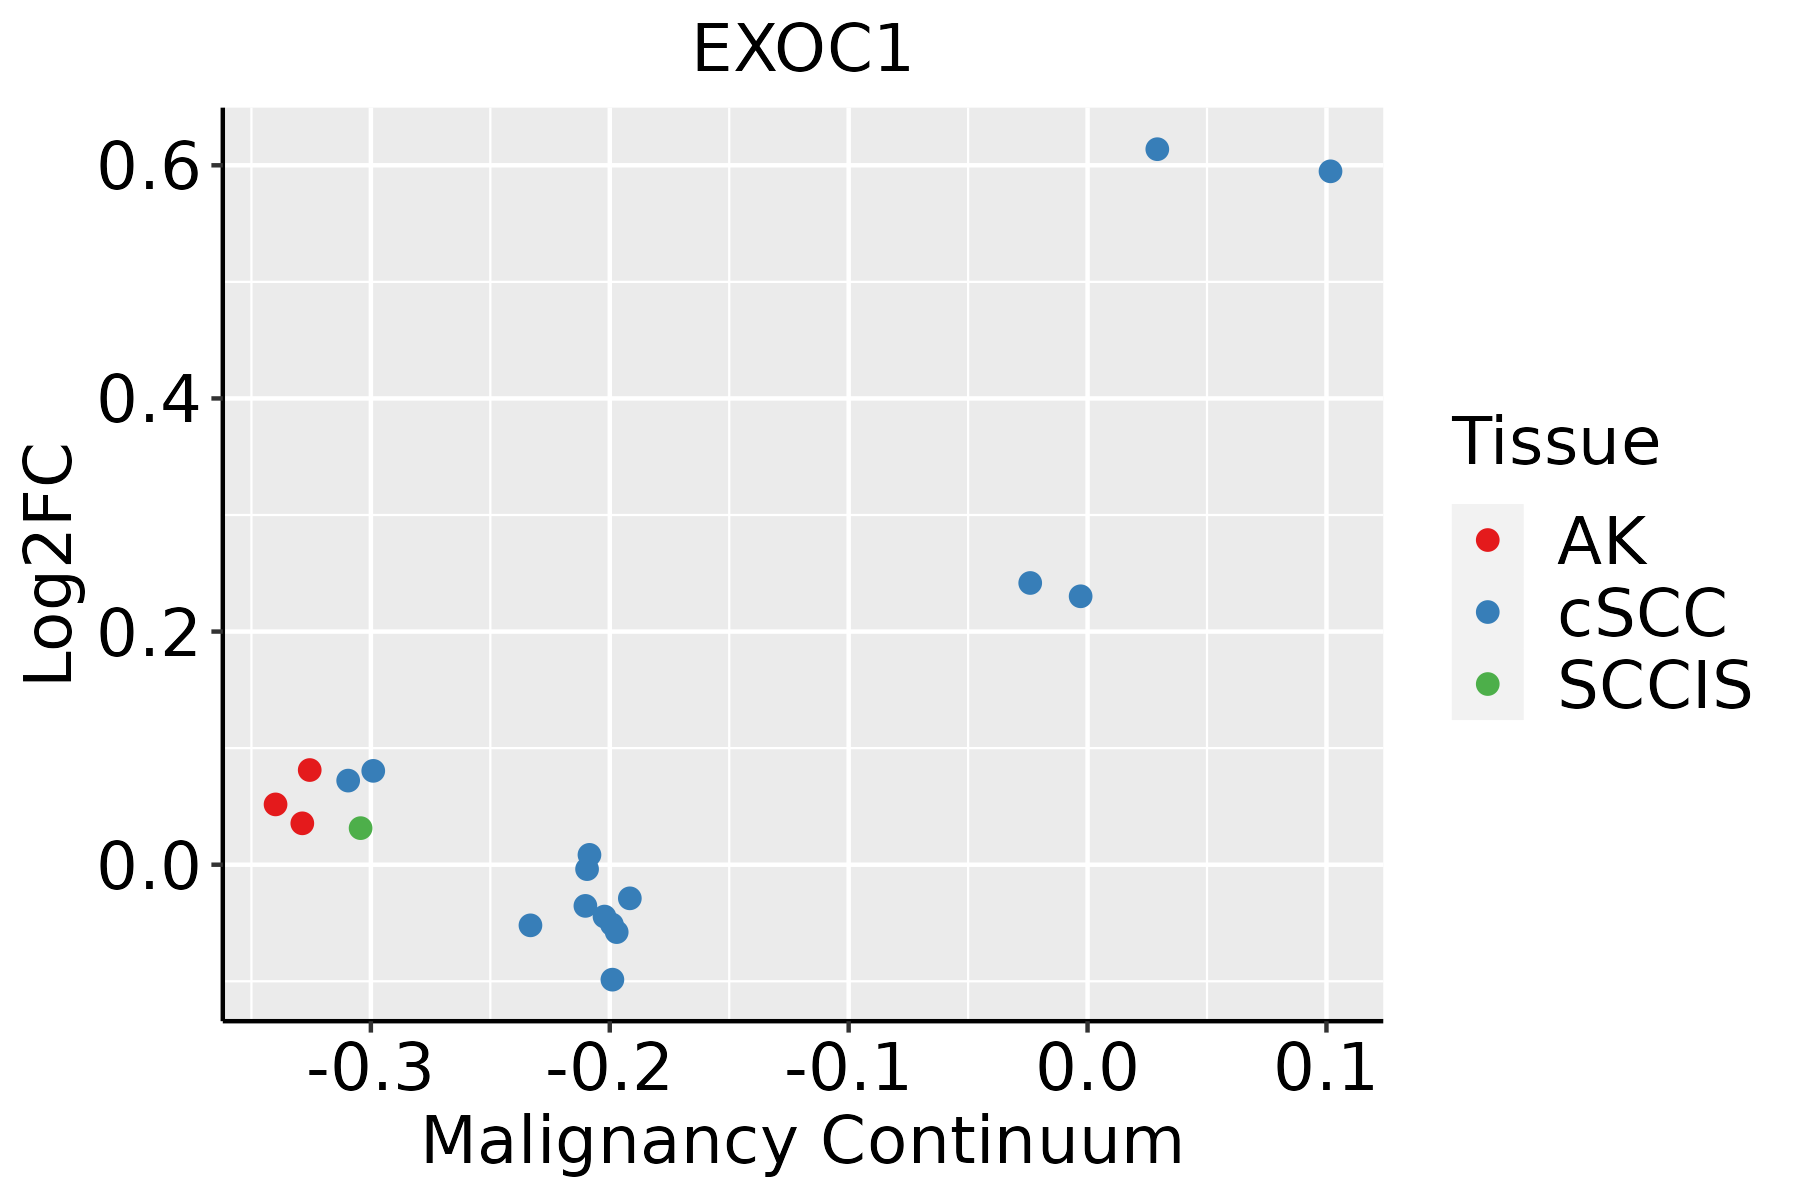
AK: Actinic keratosis
cSCC: Cutaneous squamous cell carcinoma
SCCIS:squamous cell carcinoma in situ
ThyroidThe image shows the transcriptomic changes along malignancy continuum.log2FC in expression of this searched gene in stem-like cells from each diseased tissue sample relative to stem-like cells in normal samples in each tissue plotted against the malignancy continuum. Samples are colored based on if they are from different disease stage.
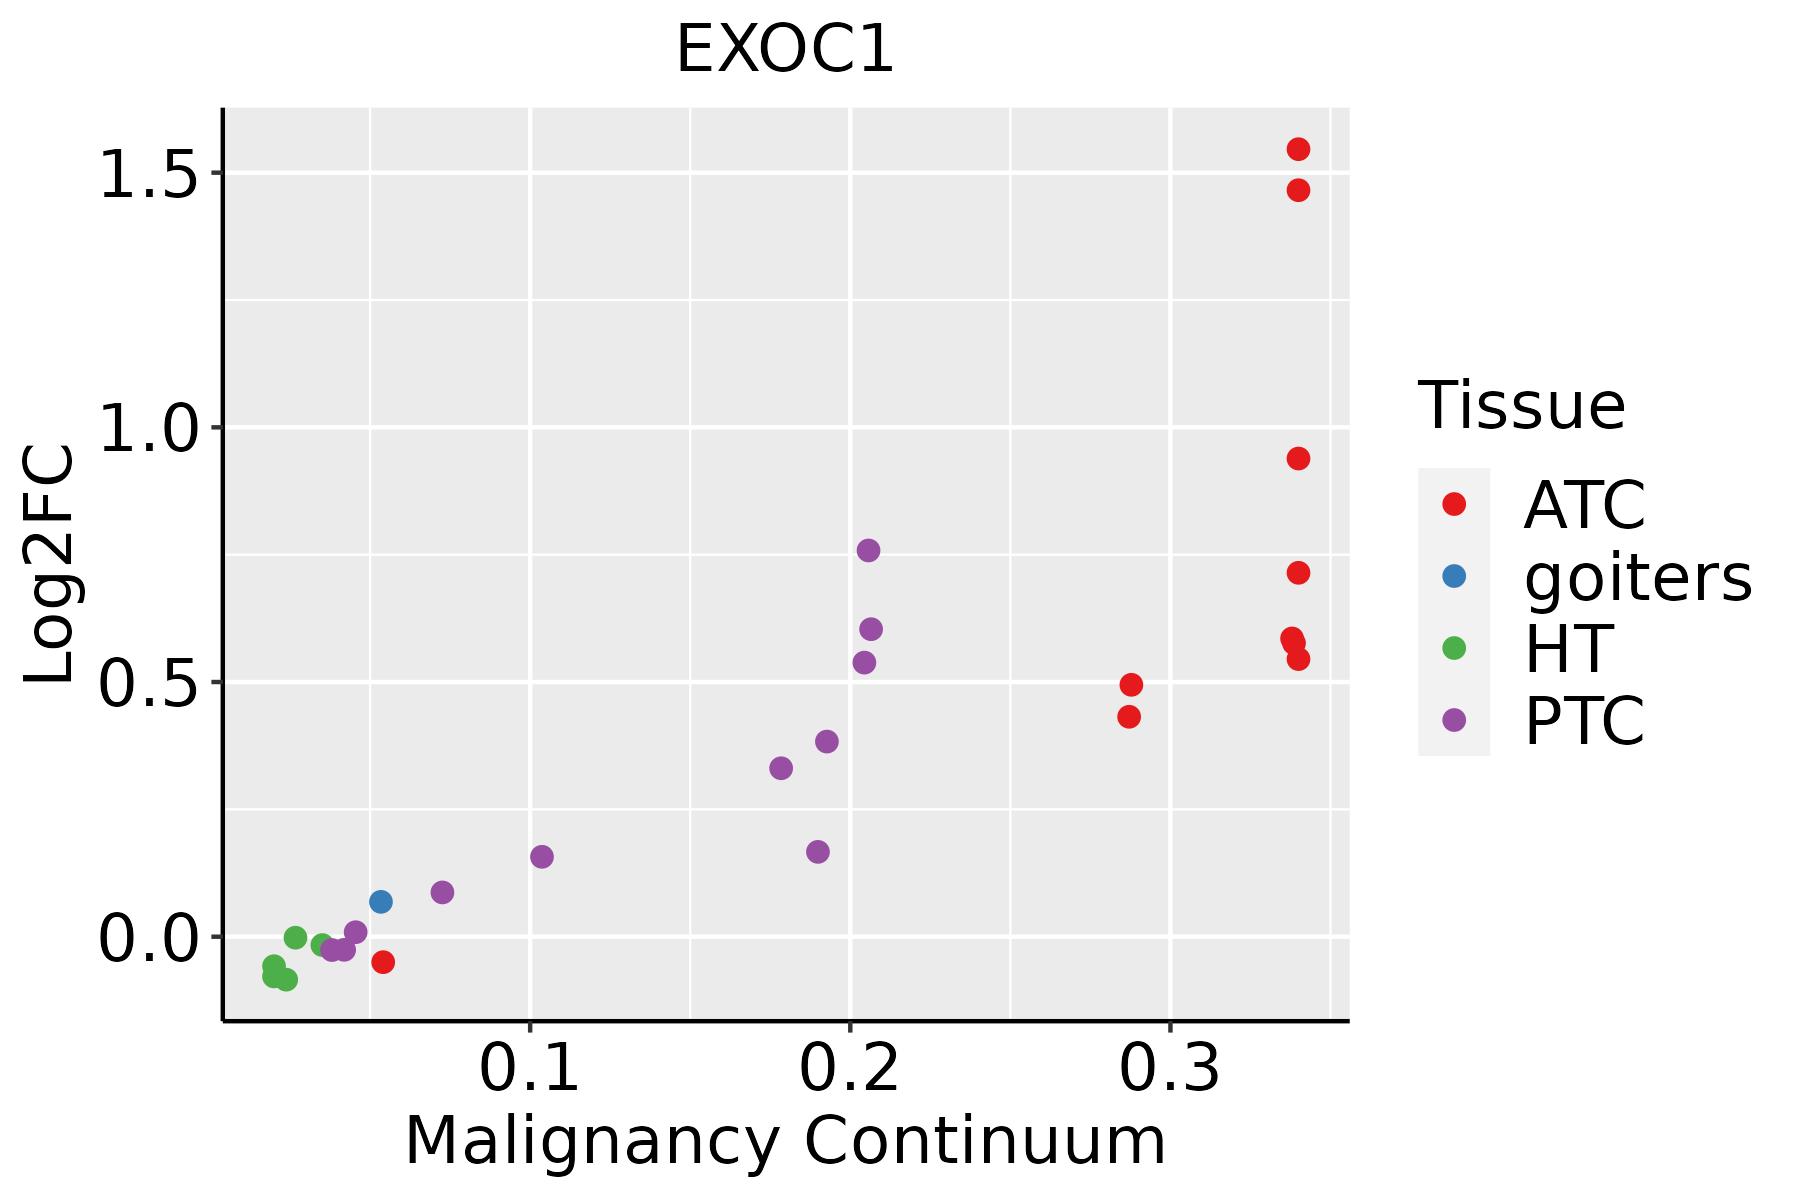
ATC: Anaplastic thyroid cancer
HT: Hashimoto's thyroiditis
PTC: Papillary thyroid cancer
∗log2FC in expression of this searched gene in stem-like cells from each diseased tissue sample relative to stem-like cells in normal samples in each tissue plotted against the malignancy continuum. Samples are colored based on if they are from different disease stage.

Top

Malignant transformation related pathway analysis

check buttonFind out the enriched GO biological processes and KEGG pathways involved in transition from healthy to precancer to cancer
check button Figure of enriched GO biological processes.
TissueDisease StageEnriched GO biological Processes
ColorectumADGO analysis - Figure of enriched GO biological processes: Top 15 enriched GO BP terms are showed in the bar plot of each disease state in each tissue. Each row represents a significant GO biological process which is colored according to the -log10(p.adjust).
ColorectumSERGO analysis - Figure of enriched GO biological processes: Top 15 enriched GO BP terms are showed in the bar plot of each disease state in each tissue. Each row represents a significant GO biological process which is colored according to the -log10(p.adjust).
ColorectumMSSGO analysis - Figure of enriched GO biological processes: Top 15 enriched GO BP terms are showed in the bar plot of each disease state in each tissue. Each row represents a significant GO biological process which is colored according to the -log10(p.adjust).
ColorectumMSI-HGO analysis - Figure of enriched GO biological processes: Top 15 enriched GO BP terms are showed in the bar plot of each disease state in each tissue. Each row represents a significant GO biological process which is colored according to the -log10(p.adjust).
ColorectumFAPGO analysis - Figure of enriched GO biological processes: Top 15 enriched GO BP terms are showed in the bar plot of each disease state in each tissue. Each row represents a significant GO biological process which is colored according to the -log10(p.adjust).
∗Top 15 enriched GO BP terms are showed in the bar plot of each disease state in each tissue. Each row represents a significant GO biological process which is colored according to the -log10(p.adjust).
Page: 1 2 3 4 5 6 7 8 9 

check button Enriched GO biological processes.
GO IDTissueDisease StageDescriptionGene RatioBg Ratiopvaluep.adjustCount
GO:004819318EsophagusESCCGolgi vesicle transport231/8552296/187231.82e-309.63e-28231
GO:001623617EsophagusESCCmacroautophagy216/8552291/187231.94e-234.57e-21216
GO:001050617EsophagusESCCregulation of autophagy220/8552317/187236.72e-186.36e-16220
GO:1904951111EsophagusESCCpositive regulation of establishment of protein localization216/8552319/187231.01e-156.86e-14216
GO:0051222111EsophagusESCCpositive regulation of protein transport204/8552303/187231.56e-148.38e-13204
GO:000961518EsophagusESCCresponse to virus238/8552367/187236.65e-143.32e-12238
GO:000689215EsophagusESCCpost-Golgi vesicle-mediated transport82/8552104/187234.00e-121.55e-1082
GO:001624114EsophagusESCCregulation of macroautophagy102/8552141/187231.09e-103.27e-09102
GO:009887615EsophagusESCCvesicle-mediated transport to the plasma membrane99/8552136/187231.13e-103.39e-0999
GO:00516075EsophagusESCCdefense response to virus171/8552265/187233.91e-101.05e-08171
GO:01405465EsophagusESCCdefense response to symbiont171/8552265/187233.91e-101.05e-08171
GO:000689315EsophagusESCCGolgi to plasma membrane transport48/855260/187235.11e-089.16e-0748
GO:000930617EsophagusESCCprotein secretion190/8552359/187233.22e-031.34e-02190
GO:003559217EsophagusESCCestablishment of protein localization to extracellular region190/8552360/187233.77e-031.53e-02190
GO:007169210EsophagusESCCprotein localization to extracellular region193/8552368/187235.01e-031.92e-02193
GO:005070810EsophagusESCCregulation of protein secretion142/8552268/187239.31e-033.24e-02142
GO:005071416EsophagusESCCpositive regulation of protein secretion76/8552137/187231.32e-024.31e-0276
GO:004819315Oral cavityOSCCGolgi vesicle transport209/7305296/187231.39e-286.30e-26209
GO:001623610Oral cavityOSCCmacroautophagy192/7305291/187237.01e-211.14e-18192
GO:001050610Oral cavityOSCCregulation of autophagy198/7305317/187231.63e-171.51e-15198
Page: 1 2 3 4 5 

check button Enriched KEGG pathways.
Pathway IDTissueDisease StageDescriptionGene RatioBg Ratiopvaluep.adjustqvalueCount
Page: 1 

Top

Cell-cell communication analysis

check buttonIdentification of potential cell-cell interactions between two cell types and their ligand-receptor pairs for different disease states
LigandReceptorLRpairPathwayTissueDisease Stage
Page: 1 

Top

Single-cell gene regulatory network inference analysis

check buttonFind out the significant the regulons (TFs) and the target genes of each regulon across cell types for different disease states
TFCell TypeTissueDisease StageTarget GeneRSSRegulon Activity
∗The dot plots of a searched regulon are shown for all cell subpopulations in each disease state of each tissue based on the regulon specific score inferred using pySCENIC and by calculating the average expression.
Page: 1 

Top

Somatic mutation of malignant transformation related genes

check buttonAnnotation of somatic variants for genes involved in malignant transformation
Hugo SymbolVariant ClassVariant ClassificationdbSNP RSHGVScHGVSpHGVSp ShortSWISSPROTBIOTYPESIFTPolyPhenTumor Sample BarcodeTissueHistologySexAgeStageTherapy TypesDrugsOutcome
EXOC1SNVMissense_Mutationc.2056N>Cp.Glu686Glnp.E686QQ9NV70protein_codingdeleterious(0.03)probably_damaging(0.98)TCGA-AC-A23H-01Breastbreast invasive carcinomaFemale>=65I/IIUnknownUnknownPD
EXOC1SNVMissense_Mutationrs192310507c.56G>Ap.Arg19Hisp.R19HQ9NV70protein_codingdeleterious(0)probably_damaging(0.991)TCGA-AN-A046-01Breastbreast invasive carcinomaFemale>=65I/IIUnknownUnknownSD
EXOC1SNVMissense_Mutationc.324G>Tp.Lys108Asnp.K108NQ9NV70protein_codingdeleterious(0)probably_damaging(0.98)TCGA-AN-A046-01Breastbreast invasive carcinomaFemale>=65I/IIUnknownUnknownSD
EXOC1SNVMissense_Mutationnovelc.1391C>Tp.Ser464Leup.S464LQ9NV70protein_codingdeleterious(0.02)benign(0.106)TCGA-AN-A046-01Breastbreast invasive carcinomaFemale>=65I/IIUnknownUnknownSD
EXOC1SNVMissense_Mutationc.1156N>Tp.Leu386Phep.L386FQ9NV70protein_codingtolerated(0.09)probably_damaging(0.954)TCGA-AN-A0AT-01Breastbreast invasive carcinomaFemale<65I/IIUnknownUnknownSD
EXOC1SNVMissense_Mutationc.2147T>Gp.Val716Glyp.V716GQ9NV70protein_codingtolerated(0.13)possibly_damaging(0.544)TCGA-AR-A0TT-01Breastbreast invasive carcinomaFemale<65III/IVChemotherapydoxorubicinSD
EXOC1SNVMissense_Mutationrs745429232c.371G>Ap.Arg124Glnp.R124QQ9NV70protein_codingtolerated(0.57)benign(0.351)TCGA-BH-A18G-01Breastbreast invasive carcinomaFemale>=65I/IIUnknownUnknownSD
EXOC1SNVMissense_Mutationc.1148N>Cp.Arg383Thrp.R383TQ9NV70protein_codingdeleterious(0.01)possibly_damaging(0.869)TCGA-E2-A1LG-01Breastbreast invasive carcinomaFemale<65I/IIChemotherapydoxorubicinSD
EXOC1SNVMissense_Mutationc.2251G>Ap.Glu751Lysp.E751KQ9NV70protein_codingtolerated(0.28)benign(0.3)TCGA-E2-A2P6-01Breastbreast invasive carcinomaFemale>=65I/IIHormone TherapyanastrozoleSD
EXOC1SNVMissense_Mutationc.758C>Tp.Ser253Phep.S253FQ9NV70protein_codingdeleterious(0.04)probably_damaging(0.926)TCGA-DR-A0ZM-01Cervixcervical & endocervical cancerFemale<65III/IVUnspecificCisplatinSD
Page: 1 2 3 4 5 6 7 8 9 10 11 12 

Top

Related drugs of malignant transformation related genes

check buttonIdentification of chemicals and drugs interact with genes involved in malignant transfromation
(DGIdb 4.0)
Entrez IDSymbolCategoryInteraction TypesDrug Claim NameDrug NamePMIDs
Page: 1