
|
|||||
|
 | |
| |
| |
| |
| |
| |
|
Gene: EVPL |
Gene summary for EVPL |
| Gene information | Species | Human | Gene symbol | EVPL | Gene ID | 2125 |
| Gene name | envoplakin | |
| Gene Alias | EVPK | |
| Cytomap | 17q25.1 | |
| Gene Type | protein-coding | GO ID | GO:0006464 | UniProtAcc | B7ZLH8 |
Top |
Malignant transformation analysis |
| Identification of the aberrant gene expression in precancerous and cancerous lesions by comparing the gene expression of stem-like cells in diseased tissues with normal stem cells |
| Entrez ID | Symbol | Replicates | Species | Organ | Tissue | Adj P-value | Log2FC | Malignancy |
| 2125 | EVPL | LZE2T | Human | Esophagus | ESCC | 2.11e-03 | 4.67e-01 | 0.082 |
| 2125 | EVPL | LZE4T | Human | Esophagus | ESCC | 1.12e-06 | 3.24e-01 | 0.0811 |
| 2125 | EVPL | LZE7T | Human | Esophagus | ESCC | 1.15e-04 | 3.03e-01 | 0.0667 |
| 2125 | EVPL | LZE8T | Human | Esophagus | ESCC | 3.53e-02 | 9.70e-02 | 0.067 |
| 2125 | EVPL | LZE20T | Human | Esophagus | ESCC | 3.88e-08 | 4.17e-01 | 0.0662 |
| 2125 | EVPL | LZE22T | Human | Esophagus | ESCC | 2.30e-07 | 5.14e-01 | 0.068 |
| 2125 | EVPL | LZE24T | Human | Esophagus | ESCC | 4.29e-11 | 2.31e-01 | 0.0596 |
| 2125 | EVPL | LZE21T | Human | Esophagus | ESCC | 7.37e-06 | 4.22e-01 | 0.0655 |
| 2125 | EVPL | P1T-E | Human | Esophagus | ESCC | 2.31e-12 | 6.36e-01 | 0.0875 |
| 2125 | EVPL | P2T-E | Human | Esophagus | ESCC | 2.16e-11 | 8.79e-02 | 0.1177 |
| 2125 | EVPL | P4T-E | Human | Esophagus | ESCC | 9.33e-06 | 1.49e-01 | 0.1323 |
| 2125 | EVPL | P5T-E | Human | Esophagus | ESCC | 9.23e-24 | 1.47e-01 | 0.1327 |
| 2125 | EVPL | P8T-E | Human | Esophagus | ESCC | 1.04e-17 | 2.40e-01 | 0.0889 |
| 2125 | EVPL | P9T-E | Human | Esophagus | ESCC | 3.92e-11 | 1.99e-01 | 0.1131 |
| 2125 | EVPL | P10T-E | Human | Esophagus | ESCC | 7.25e-04 | 5.28e-02 | 0.116 |
| 2125 | EVPL | P11T-E | Human | Esophagus | ESCC | 3.46e-04 | 4.79e-01 | 0.1426 |
| 2125 | EVPL | P12T-E | Human | Esophagus | ESCC | 5.11e-17 | 3.12e-01 | 0.1122 |
| 2125 | EVPL | P15T-E | Human | Esophagus | ESCC | 1.02e-20 | 5.05e-01 | 0.1149 |
| 2125 | EVPL | P16T-E | Human | Esophagus | ESCC | 1.14e-04 | 2.28e-02 | 0.1153 |
| 2125 | EVPL | P20T-E | Human | Esophagus | ESCC | 6.59e-49 | 1.01e+00 | 0.1124 |
| Page: 1 2 3 4 5 |
| Tissue | Expression Dynamics | Abbreviation |
| Esophagus | 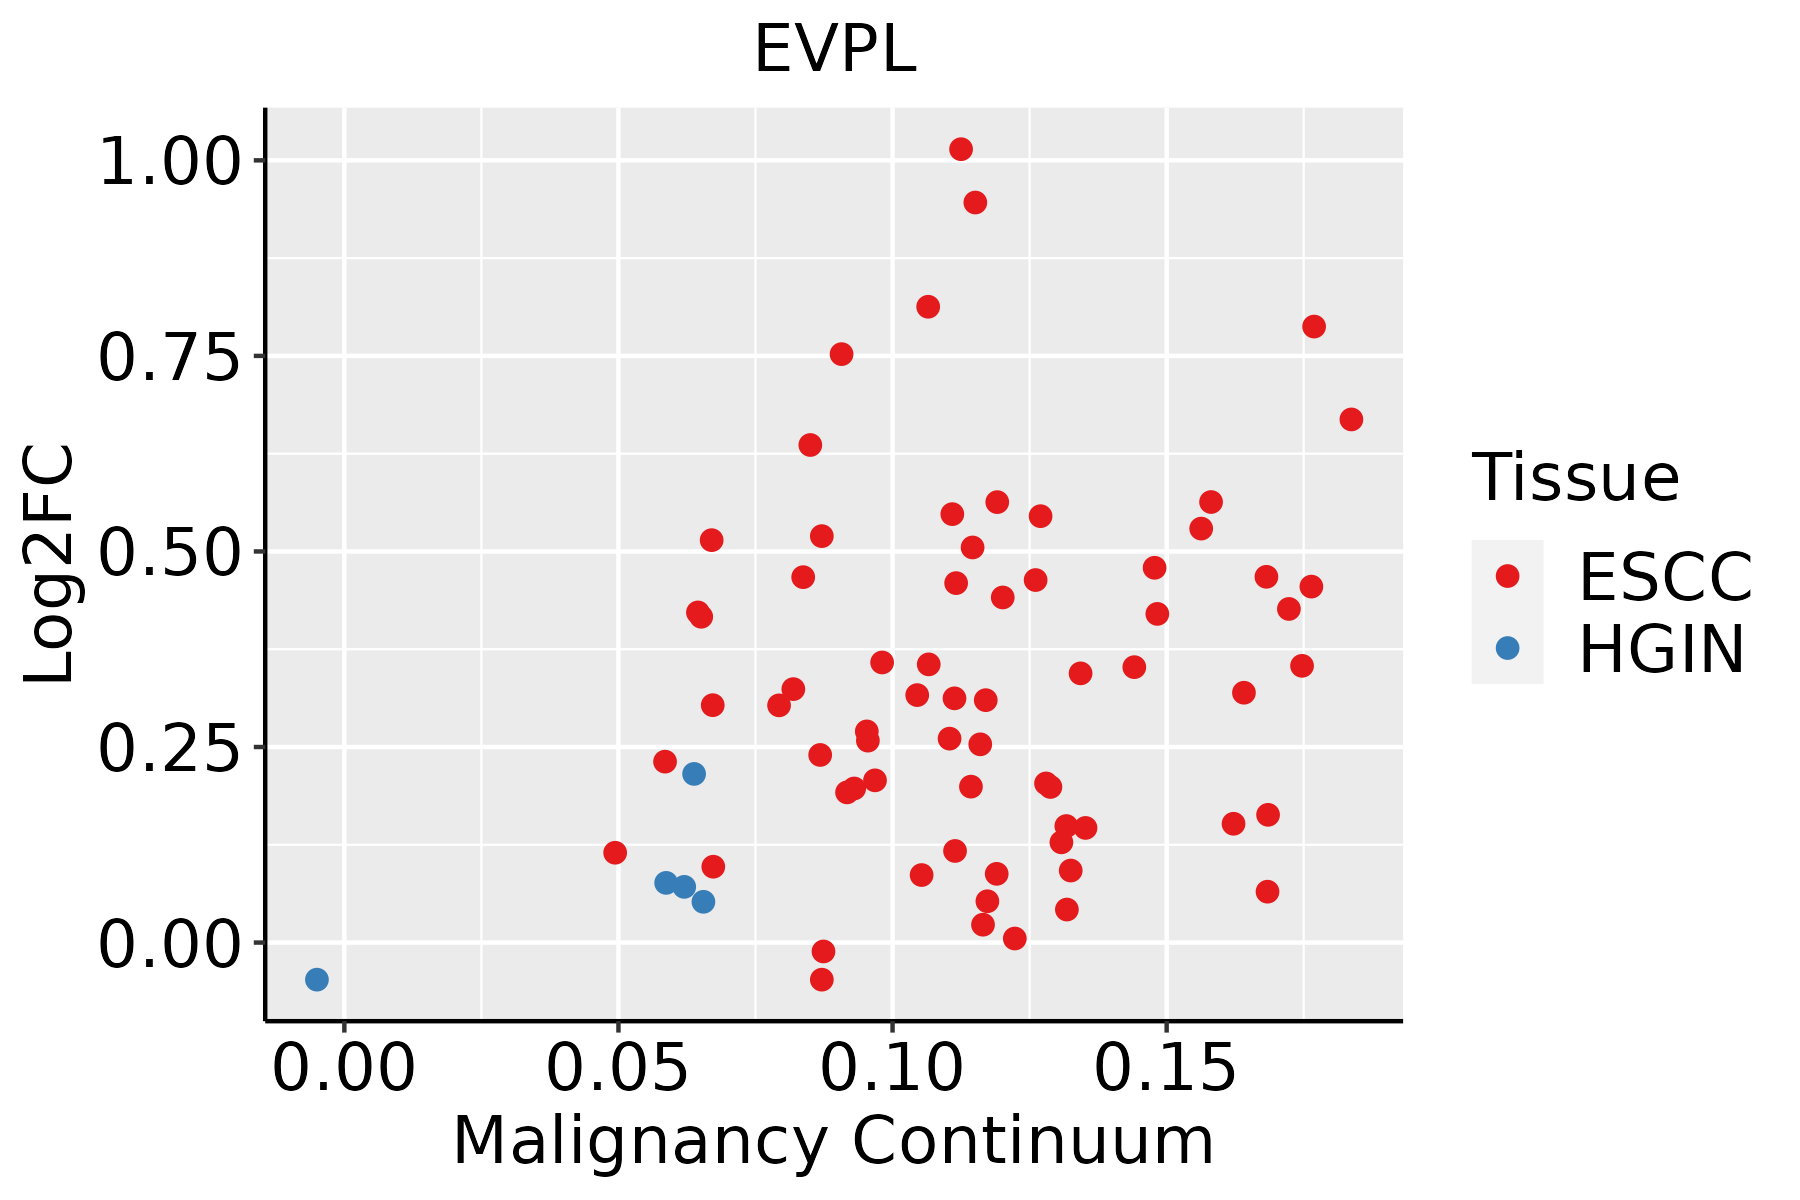 | ESCC: Esophageal squamous cell carcinoma |
| HGIN: High-grade intraepithelial neoplasias | ||
| LGIN: Low-grade intraepithelial neoplasias | ||
| Oral Cavity | 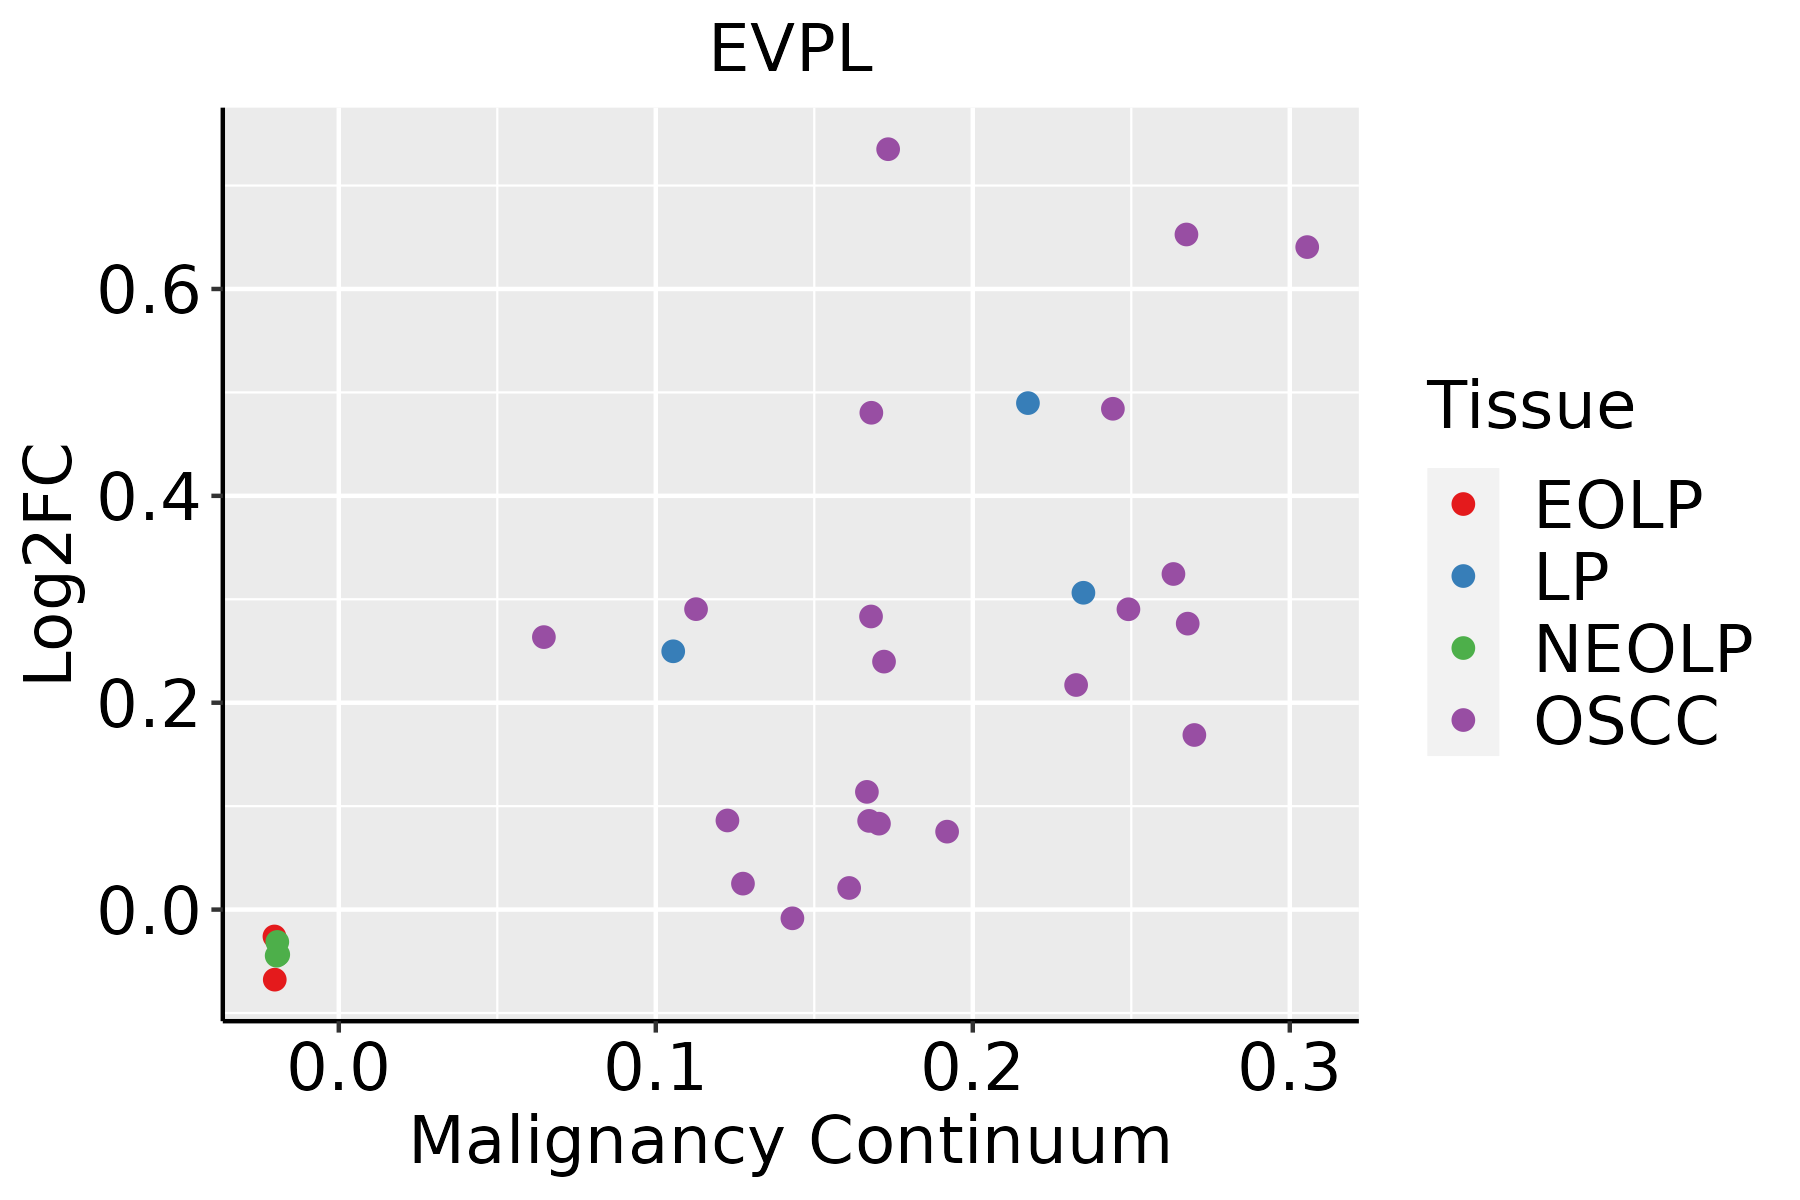 | EOLP: Erosive Oral lichen planus |
| LP: leukoplakia | ||
| NEOLP: Non-erosive oral lichen planus | ||
| OSCC: Oral squamous cell carcinoma | ||
| Skin | 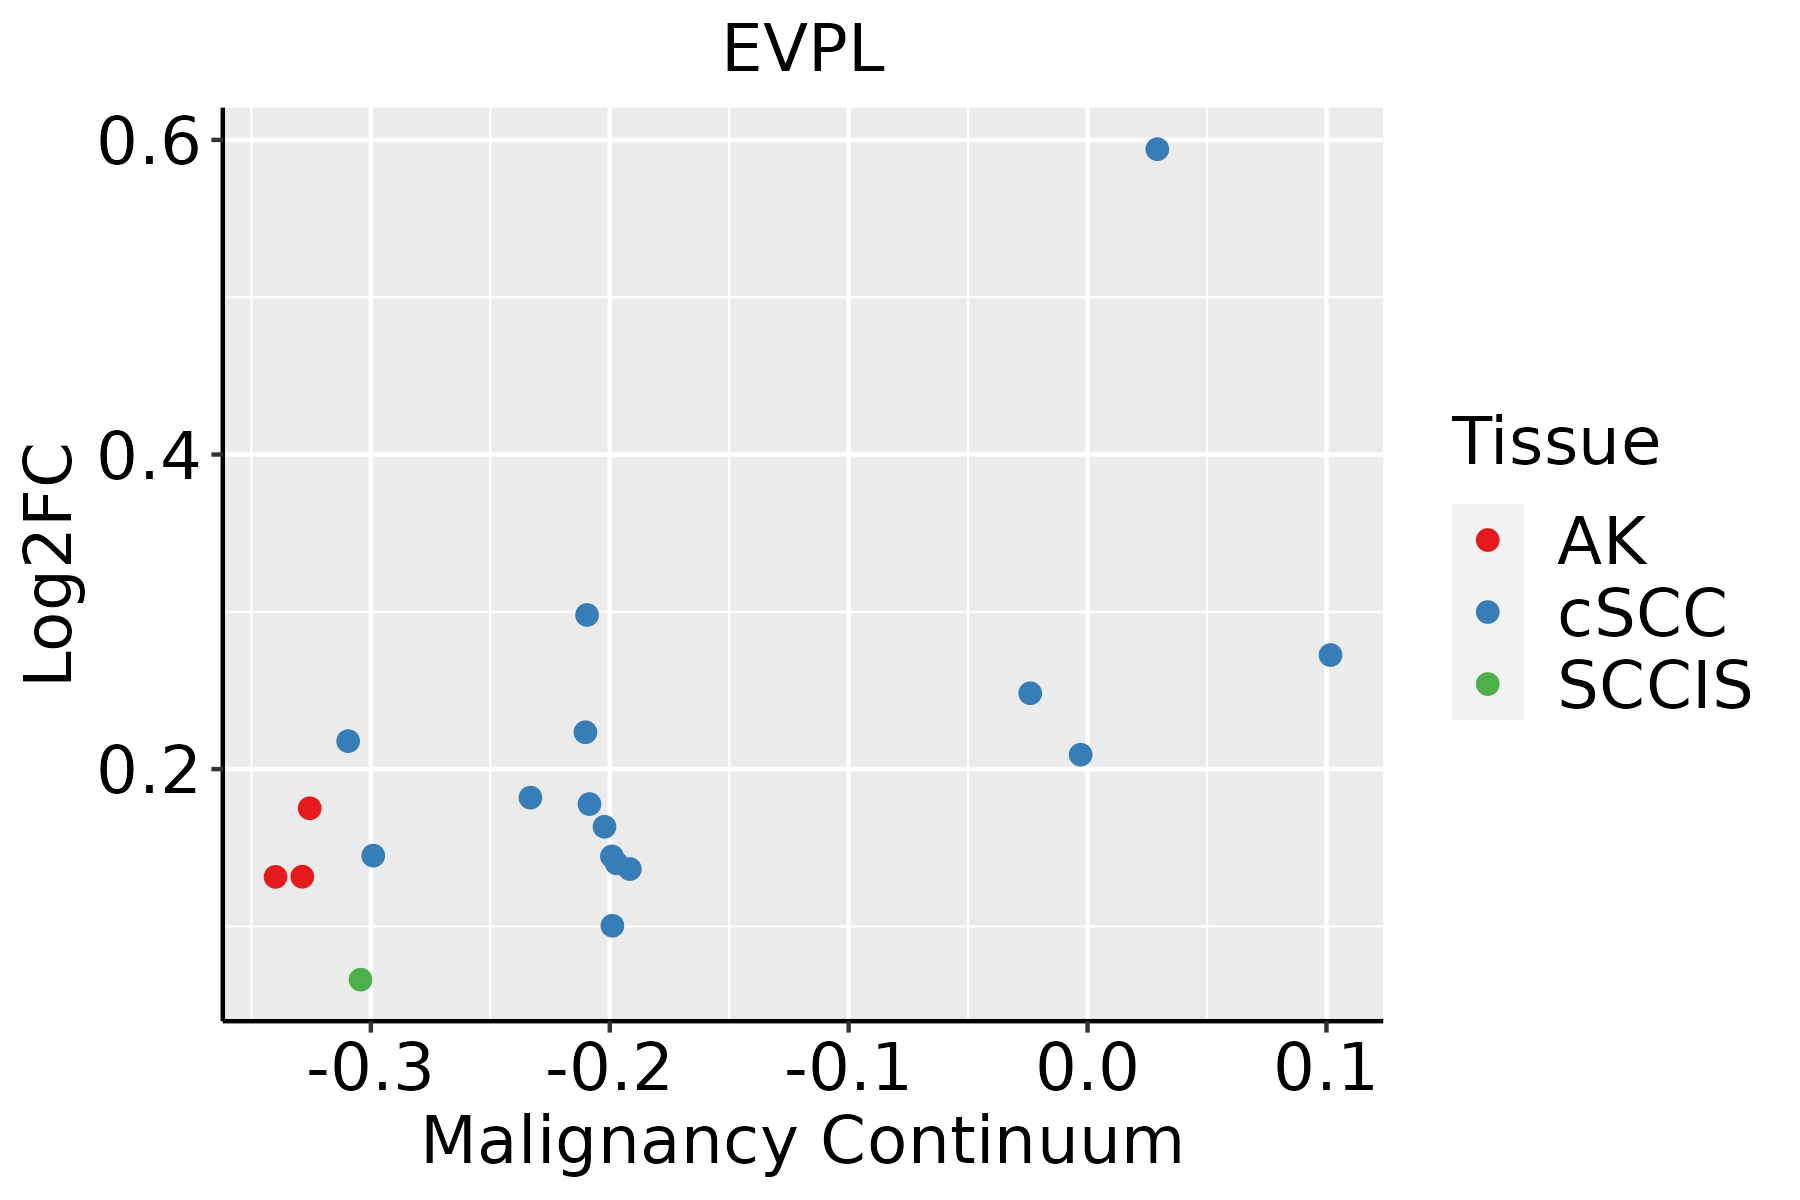 | AK: Actinic keratosis |
| cSCC: Cutaneous squamous cell carcinoma | ||
| SCCIS:squamous cell carcinoma in situ |
| ∗log2FC in expression of this searched gene in stem-like cells from each diseased tissue sample relative to stem-like cells in normal samples in each tissue plotted against the malignancy continuum. Samples are colored based on if they are from different disease stage. |
Top |
Malignant transformation related pathway analysis |
| Find out the enriched GO biological processes and KEGG pathways involved in transition from healthy to precancer to cancer |
| Tissue | Disease Stage | Enriched GO biological Processes |
| Colorectum | AD |  |
| Colorectum | SER |  |
| Colorectum | MSS |  |
| Colorectum | MSI-H |  |
| Colorectum | FAP |  |
| ∗Top 15 enriched GO BP terms are showed in the bar plot of each disease state in each tissue. Each row represents a significant GO biological process which is colored according to the -log10(p.adjust). |
| Page: 1 2 3 4 5 6 7 8 9 |
| GO ID | Tissue | Disease Stage | Description | Gene Ratio | Bg Ratio | pvalue | p.adjust | Count |
| GO:00435888 | Esophagus | ESCC | skin development | 163/8552 | 263/18723 | 6.48e-08 | 1.14e-06 | 163 |
| GO:000854410 | Esophagus | ESCC | epidermis development | 193/8552 | 324/18723 | 2.87e-07 | 4.19e-06 | 193 |
| GO:004206027 | Esophagus | ESCC | wound healing | 243/8552 | 422/18723 | 4.62e-07 | 6.25e-06 | 243 |
| GO:000991310 | Esophagus | ESCC | epidermal cell differentiation | 122/8552 | 202/18723 | 1.69e-05 | 1.51e-04 | 122 |
| GO:00302167 | Esophagus | ESCC | keratinocyte differentiation | 86/8552 | 139/18723 | 8.53e-05 | 6.19e-04 | 86 |
| GO:00451035 | Esophagus | ESCC | intermediate filament-based process | 32/8552 | 52/18723 | 1.55e-02 | 4.97e-02 | 32 |
| GO:004206020 | Oral cavity | OSCC | wound healing | 237/7305 | 422/18723 | 4.51e-13 | 2.18e-11 | 237 |
| GO:00435887 | Oral cavity | OSCC | skin development | 143/7305 | 263/18723 | 2.77e-07 | 4.27e-06 | 143 |
| GO:00085449 | Oral cavity | OSCC | epidermis development | 171/7305 | 324/18723 | 2.89e-07 | 4.43e-06 | 171 |
| GO:00302166 | Oral cavity | OSCC | keratinocyte differentiation | 81/7305 | 139/18723 | 3.16e-06 | 3.81e-05 | 81 |
| GO:00099139 | Oral cavity | OSCC | epidermal cell differentiation | 109/7305 | 202/18723 | 1.08e-05 | 1.14e-04 | 109 |
| GO:00451044 | Oral cavity | OSCC | intermediate filament cytoskeleton organization | 31/7305 | 51/18723 | 1.34e-03 | 6.62e-03 | 31 |
| GO:00451034 | Oral cavity | OSCC | intermediate filament-based process | 31/7305 | 52/18723 | 2.08e-03 | 9.59e-03 | 31 |
| GO:000854416 | Oral cavity | LP | epidermis development | 112/4623 | 324/18723 | 3.81e-05 | 5.61e-04 | 112 |
| GO:004358816 | Oral cavity | LP | skin development | 93/4623 | 263/18723 | 6.47e-05 | 8.70e-04 | 93 |
| GO:0042060110 | Oral cavity | LP | wound healing | 139/4623 | 422/18723 | 7.10e-05 | 9.48e-04 | 139 |
| GO:003021613 | Oral cavity | LP | keratinocyte differentiation | 51/4623 | 139/18723 | 1.05e-03 | 8.84e-03 | 51 |
| GO:000991315 | Oral cavity | LP | epidermal cell differentiation | 69/4623 | 202/18723 | 1.53e-03 | 1.19e-02 | 69 |
| GO:000854417 | Skin | AK | epidermis development | 79/1910 | 324/18723 | 1.04e-13 | 3.25e-11 | 79 |
| GO:00435889 | Skin | AK | skin development | 67/1910 | 263/18723 | 9.02e-13 | 2.14e-10 | 67 |
| Page: 1 2 |
| Pathway ID | Tissue | Disease Stage | Description | Gene Ratio | Bg Ratio | pvalue | p.adjust | qvalue | Count |
| Page: 1 |
Top |
Cell-cell communication analysis |
| Identification of potential cell-cell interactions between two cell types and their ligand-receptor pairs for different disease states |
| Ligand | Receptor | LRpair | Pathway | Tissue | Disease Stage |
| Page: 1 |
Top |
Single-cell gene regulatory network inference analysis |
| Find out the significant the regulons (TFs) and the target genes of each regulon across cell types for different disease states |
| TF | Cell Type | Tissue | Disease Stage | Target Gene | RSS | Regulon Activity |
| ∗The dot plots of a searched regulon are shown for all cell subpopulations in each disease state of each tissue based on the regulon specific score inferred using pySCENIC and by calculating the average expression. |
| Page: 1 |
Top |
Somatic mutation of malignant transformation related genes |
| Annotation of somatic variants for genes involved in malignant transformation |
| Hugo Symbol | Variant Class | Variant Classification | dbSNP RS | HGVSc | HGVSp | HGVSp Short | SWISSPROT | BIOTYPE | SIFT | PolyPhen | Tumor Sample Barcode | Tissue | Histology | Sex | Age | Stage | Therapy Types | Drugs | Outcome |
| EVPL | SNV | Missense_Mutation | c.3258G>C | p.Glu1086Asp | p.E1086D | protein_coding | deleterious(0.01) | possibly_damaging(0.872) | TCGA-A1-A0SO-01 | Breast | breast invasive carcinoma | Female | >=65 | I/II | Chemotherapy | SD | |||
| EVPL | SNV | Missense_Mutation | novel | c.396N>T | p.Glu132Asp | p.E132D | protein_coding | tolerated(0.2) | benign(0.104) | TCGA-A2-A0EX-01 | Breast | breast invasive carcinoma | Female | <65 | I/II | Hormone Therapy | tamoxiphen | SD | |
| EVPL | SNV | Missense_Mutation | c.5482N>G | p.Pro1828Ala | p.P1828A | protein_coding | tolerated(0.31) | benign(0.018) | TCGA-A8-A06X-01 | Breast | breast invasive carcinoma | Female | >=65 | I/II | Unknown | Unknown | SD | ||
| EVPL | SNV | Missense_Mutation | rs368923796 | c.3658N>A | p.Glu1220Lys | p.E1220K | protein_coding | deleterious(0) | possibly_damaging(0.9) | TCGA-A8-A08X-01 | Breast | breast invasive carcinoma | Female | <65 | III/IV | Chemotherapy | doxorubicin | PD | |
| EVPL | SNV | Missense_Mutation | c.3991N>C | p.Glu1331Gln | p.E1331Q | protein_coding | deleterious(0.03) | probably_damaging(0.99) | TCGA-AC-A23H-01 | Breast | breast invasive carcinoma | Female | >=65 | I/II | Unknown | Unknown | PD | ||
| EVPL | SNV | Missense_Mutation | c.2187N>C | p.Gln729His | p.Q729H | protein_coding | deleterious(0.02) | benign(0.044) | TCGA-AC-A23H-01 | Breast | breast invasive carcinoma | Female | >=65 | I/II | Unknown | Unknown | PD | ||
| EVPL | SNV | Missense_Mutation | novel | c.348N>C | p.Glu116Asp | p.E116D | protein_coding | deleterious(0.04) | benign(0.188) | TCGA-AC-A5XS-01 | Breast | breast invasive carcinoma | Female | >=65 | I/II | Hormone Therapy | femara | SD | |
| EVPL | SNV | Missense_Mutation | rs774293924 | c.4420N>T | p.Arg1474Trp | p.R1474W | protein_coding | deleterious(0.02) | probably_damaging(0.997) | TCGA-AN-A0FZ-01 | Breast | breast invasive carcinoma | Female | <65 | III/IV | Unknown | Unknown | SD | |
| EVPL | SNV | Missense_Mutation | c.5101N>C | p.Glu1701Gln | p.E1701Q | protein_coding | deleterious(0) | probably_damaging(0.999) | TCGA-AN-A0XW-01 | Breast | breast invasive carcinoma | Female | <65 | III/IV | Unknown | Unknown | SD | ||
| EVPL | SNV | Missense_Mutation | novel | c.1423N>T | p.Val475Leu | p.V475L | protein_coding | tolerated(0.68) | benign(0.024) | TCGA-AQ-A04J-01 | Breast | breast invasive carcinoma | Female | <65 | I/II | Chemotherapy | cytoxan | SD |
| Page: 1 2 3 4 5 6 7 8 9 10 11 12 13 14 15 16 17 18 |
Top |
Related drugs of malignant transformation related genes |
| Identification of chemicals and drugs interact with genes involved in malignant transfromation |
| (DGIdb 4.0) |
| Entrez ID | Symbol | Category | Interaction Types | Drug Claim Name | Drug Name | PMIDs |
| Page: 1 |

Copyright 2023-Present -The University of Texas Health Science Center at Houston |