
|
|||||
|
 | |
| |
| |
| |
| |
| |
|
Gene: EVA1C |
Gene summary for EVA1C |
| Gene information | Species | Human | Gene symbol | EVA1C | Gene ID | 59271 |
| Gene name | eva-1 homolog C | |
| Gene Alias | B18 | |
| Cytomap | 21q22.11 | |
| Gene Type | protein-coding | GO ID | GO:0008150 | UniProtAcc | P58658 |
Top |
Malignant transformation analysis |
| Identification of the aberrant gene expression in precancerous and cancerous lesions by comparing the gene expression of stem-like cells in diseased tissues with normal stem cells |
| Entrez ID | Symbol | Replicates | Species | Organ | Tissue | Adj P-value | Log2FC | Malignancy |
| 59271 | EVA1C | HTA11_3410_2000001011 | Human | Colorectum | AD | 7.42e-08 | -4.16e-01 | 0.0155 |
| 59271 | EVA1C | HTA11_99999973899_84307 | Human | Colorectum | MSS | 2.29e-02 | -4.49e-01 | 0.2585 |
| 59271 | EVA1C | F007 | Human | Colorectum | FAP | 1.43e-09 | -4.90e-01 | 0.1176 |
| 59271 | EVA1C | A002-C-010 | Human | Colorectum | FAP | 1.03e-17 | -4.31e-01 | 0.242 |
| 59271 | EVA1C | A001-C-207 | Human | Colorectum | FAP | 1.29e-10 | -4.46e-01 | 0.1278 |
| 59271 | EVA1C | A015-C-203 | Human | Colorectum | FAP | 6.48e-26 | -4.86e-01 | -0.1294 |
| 59271 | EVA1C | A015-C-204 | Human | Colorectum | FAP | 1.14e-07 | -3.20e-01 | -0.0228 |
| 59271 | EVA1C | A014-C-040 | Human | Colorectum | FAP | 9.02e-05 | -4.75e-01 | -0.1184 |
| 59271 | EVA1C | A002-C-201 | Human | Colorectum | FAP | 9.70e-19 | -4.41e-01 | 0.0324 |
| 59271 | EVA1C | A002-C-203 | Human | Colorectum | FAP | 1.51e-08 | -3.67e-01 | 0.2786 |
| 59271 | EVA1C | A001-C-119 | Human | Colorectum | FAP | 1.15e-09 | -4.14e-01 | -0.1557 |
| 59271 | EVA1C | A001-C-108 | Human | Colorectum | FAP | 2.41e-16 | -4.09e-01 | -0.0272 |
| 59271 | EVA1C | A002-C-205 | Human | Colorectum | FAP | 7.96e-21 | -4.37e-01 | -0.1236 |
| 59271 | EVA1C | A001-C-104 | Human | Colorectum | FAP | 9.37e-07 | -3.18e-01 | 0.0184 |
| 59271 | EVA1C | A015-C-005 | Human | Colorectum | FAP | 4.20e-02 | -2.25e-01 | -0.0336 |
| 59271 | EVA1C | A015-C-006 | Human | Colorectum | FAP | 1.20e-14 | -4.69e-01 | -0.0994 |
| 59271 | EVA1C | A015-C-106 | Human | Colorectum | FAP | 3.20e-12 | -3.28e-01 | -0.0511 |
| 59271 | EVA1C | A002-C-114 | Human | Colorectum | FAP | 4.73e-22 | -5.56e-01 | -0.1561 |
| 59271 | EVA1C | A015-C-104 | Human | Colorectum | FAP | 3.69e-22 | -4.24e-01 | -0.1899 |
| 59271 | EVA1C | A001-C-014 | Human | Colorectum | FAP | 5.24e-15 | -3.95e-01 | 0.0135 |
| Page: 1 2 3 4 5 6 7 |
| Tissue | Expression Dynamics | Abbreviation |
| Colorectum (GSE201348) |  | FAP: Familial adenomatous polyposis |
| CRC: Colorectal cancer | ||
| Colorectum (HTA11) |  | AD: Adenomas |
| SER: Sessile serrated lesions | ||
| MSI-H: Microsatellite-high colorectal cancer | ||
| MSS: Microsatellite stable colorectal cancer | ||
| Esophagus | 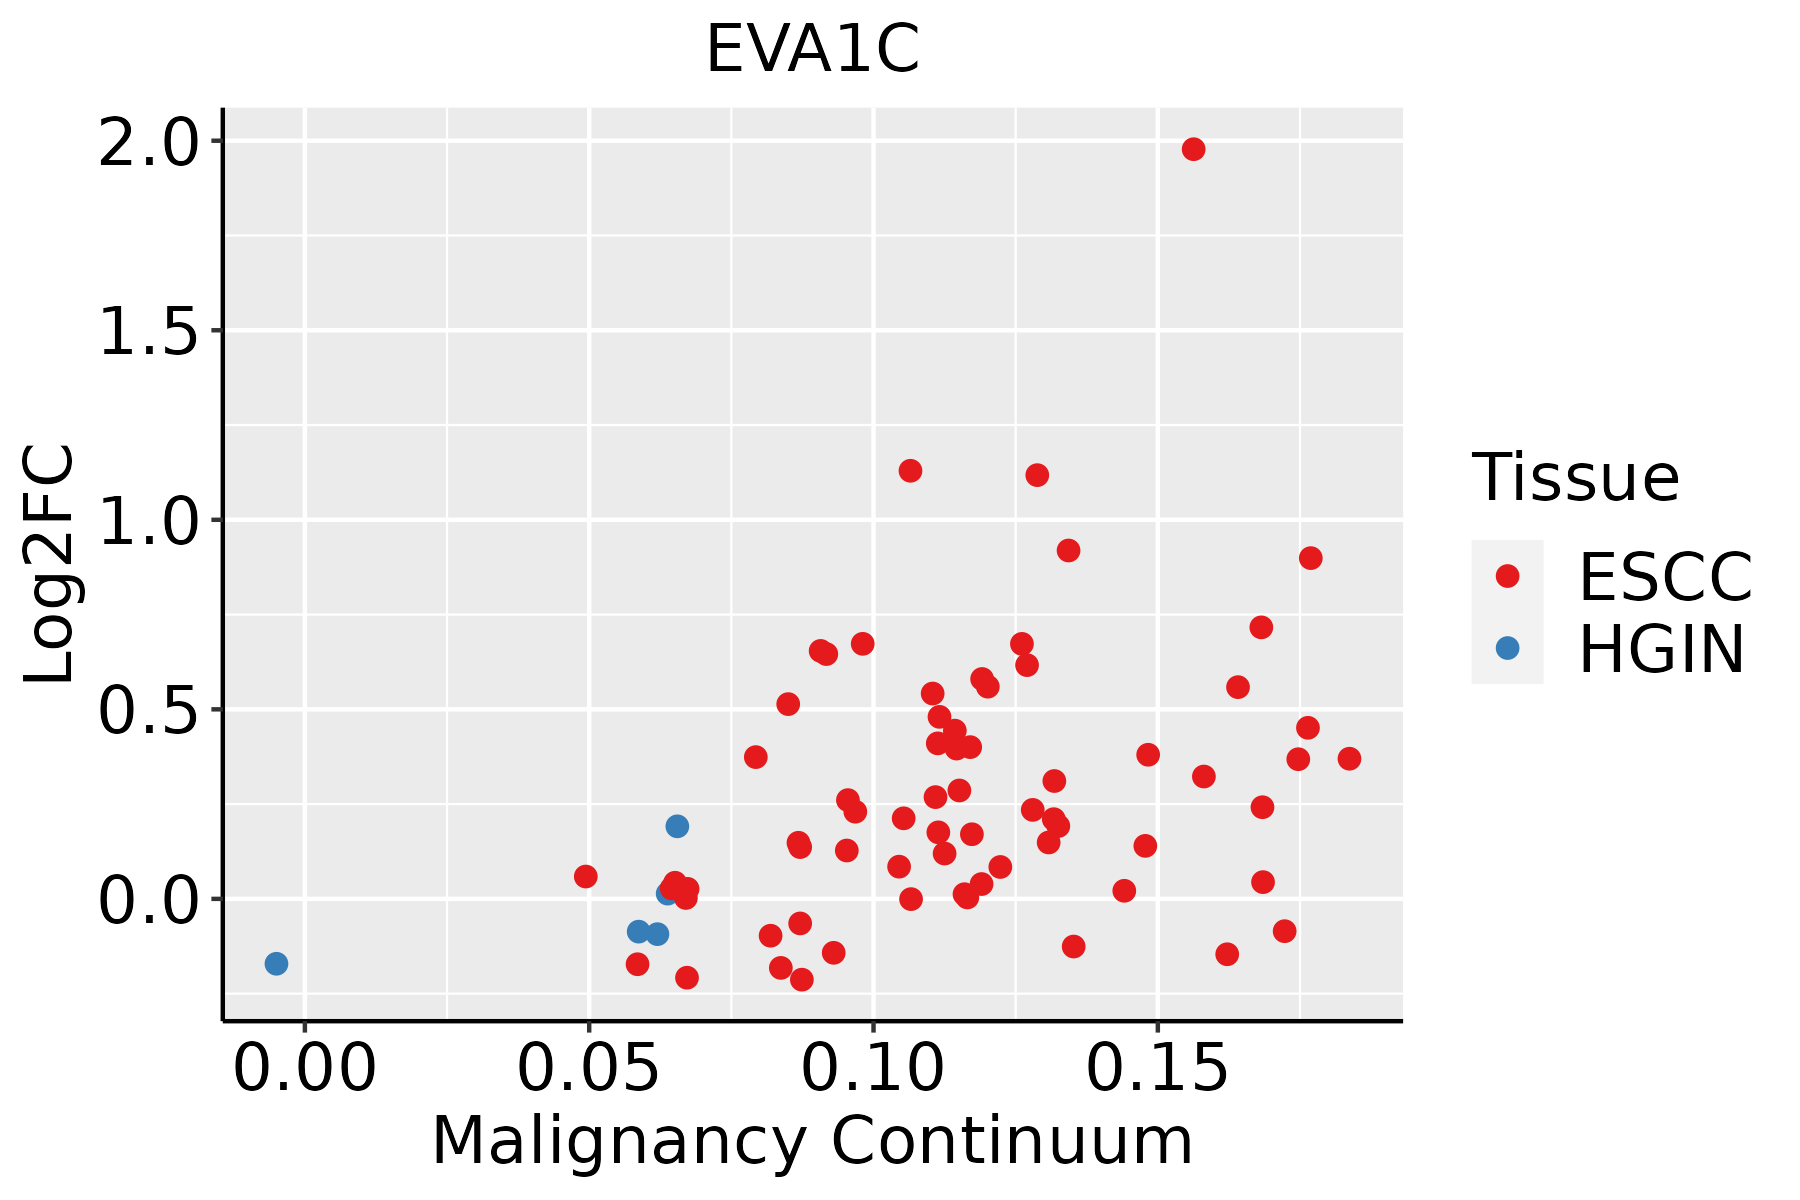 | ESCC: Esophageal squamous cell carcinoma |
| HGIN: High-grade intraepithelial neoplasias | ||
| LGIN: Low-grade intraepithelial neoplasias | ||
| Lung |  | AAH: Atypical adenomatous hyperplasia |
| AIS: Adenocarcinoma in situ | ||
| IAC: Invasive lung adenocarcinoma | ||
| MIA: Minimally invasive adenocarcinoma | ||
| Oral Cavity | 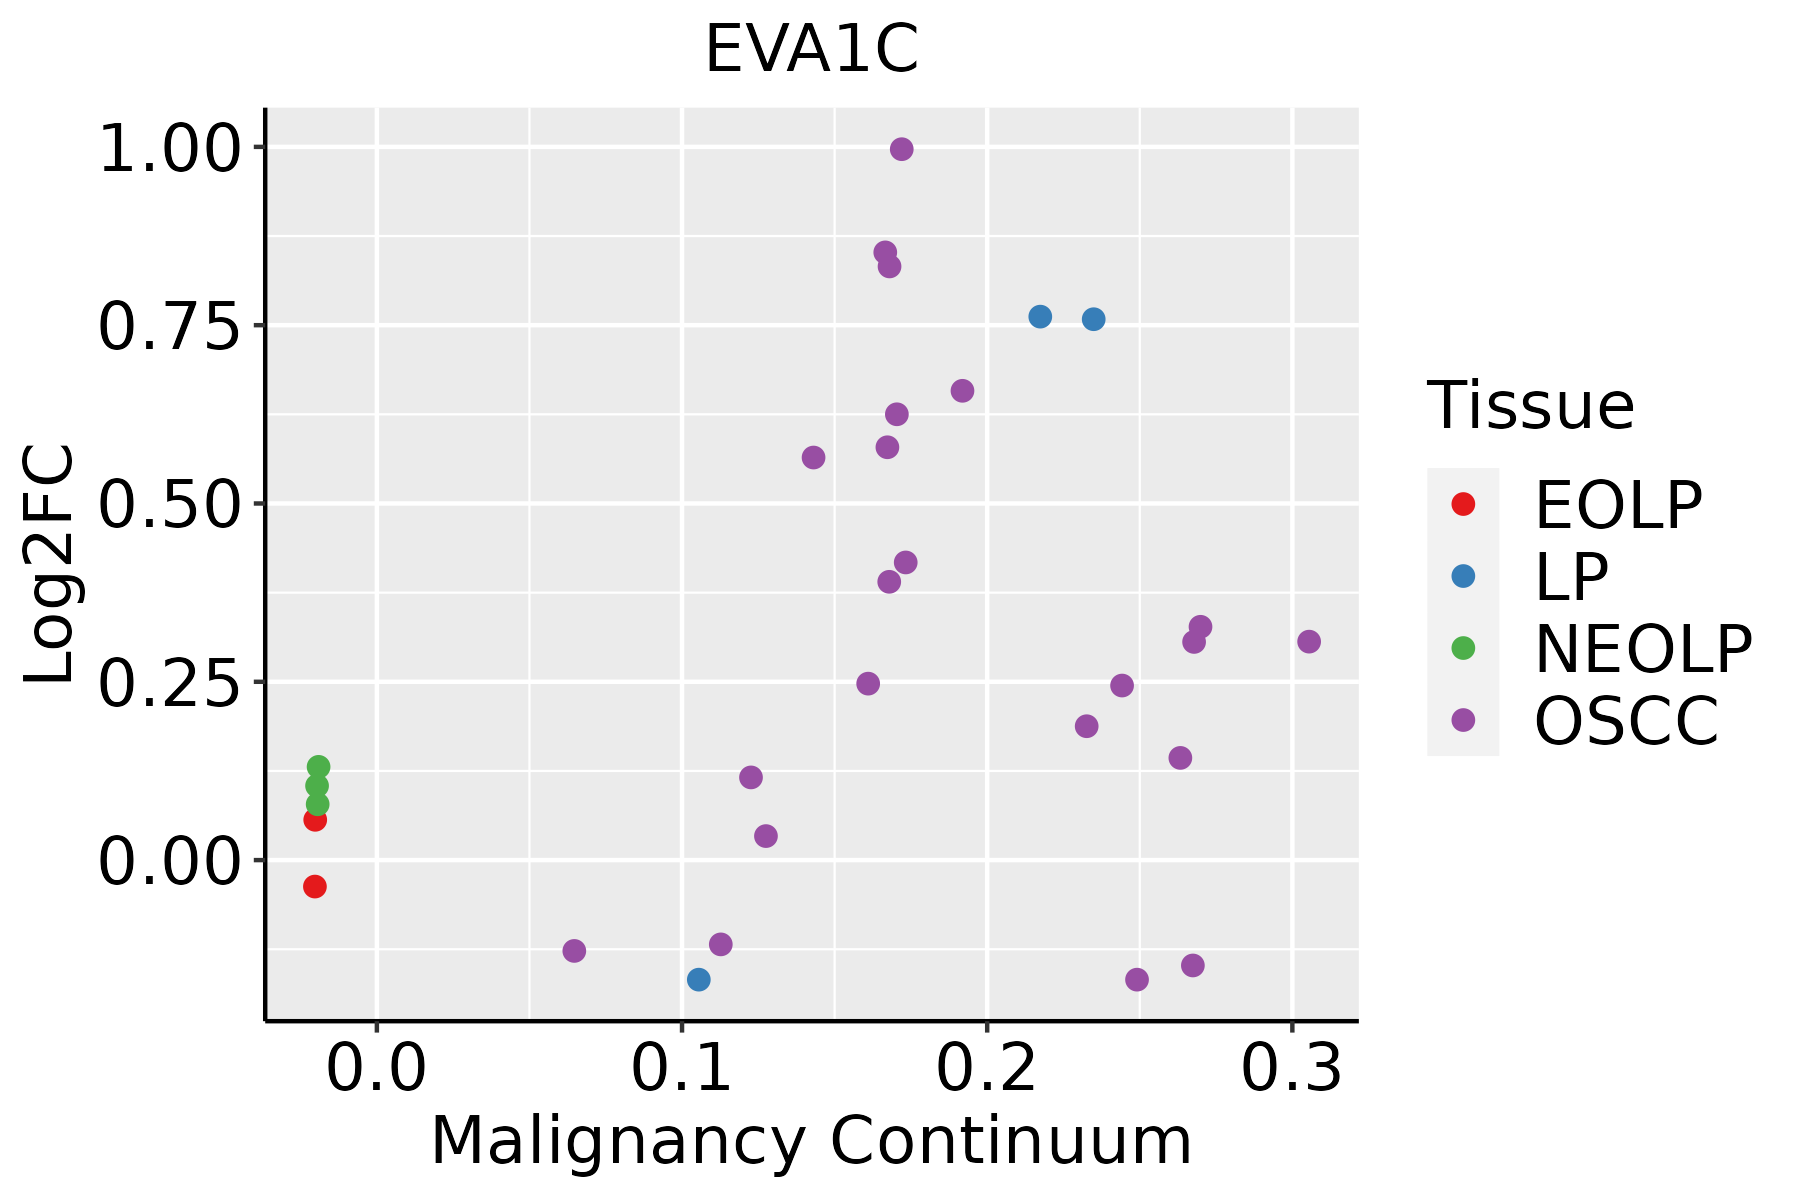 | EOLP: Erosive Oral lichen planus |
| LP: leukoplakia | ||
| NEOLP: Non-erosive oral lichen planus | ||
| OSCC: Oral squamous cell carcinoma | ||
| Prostate | 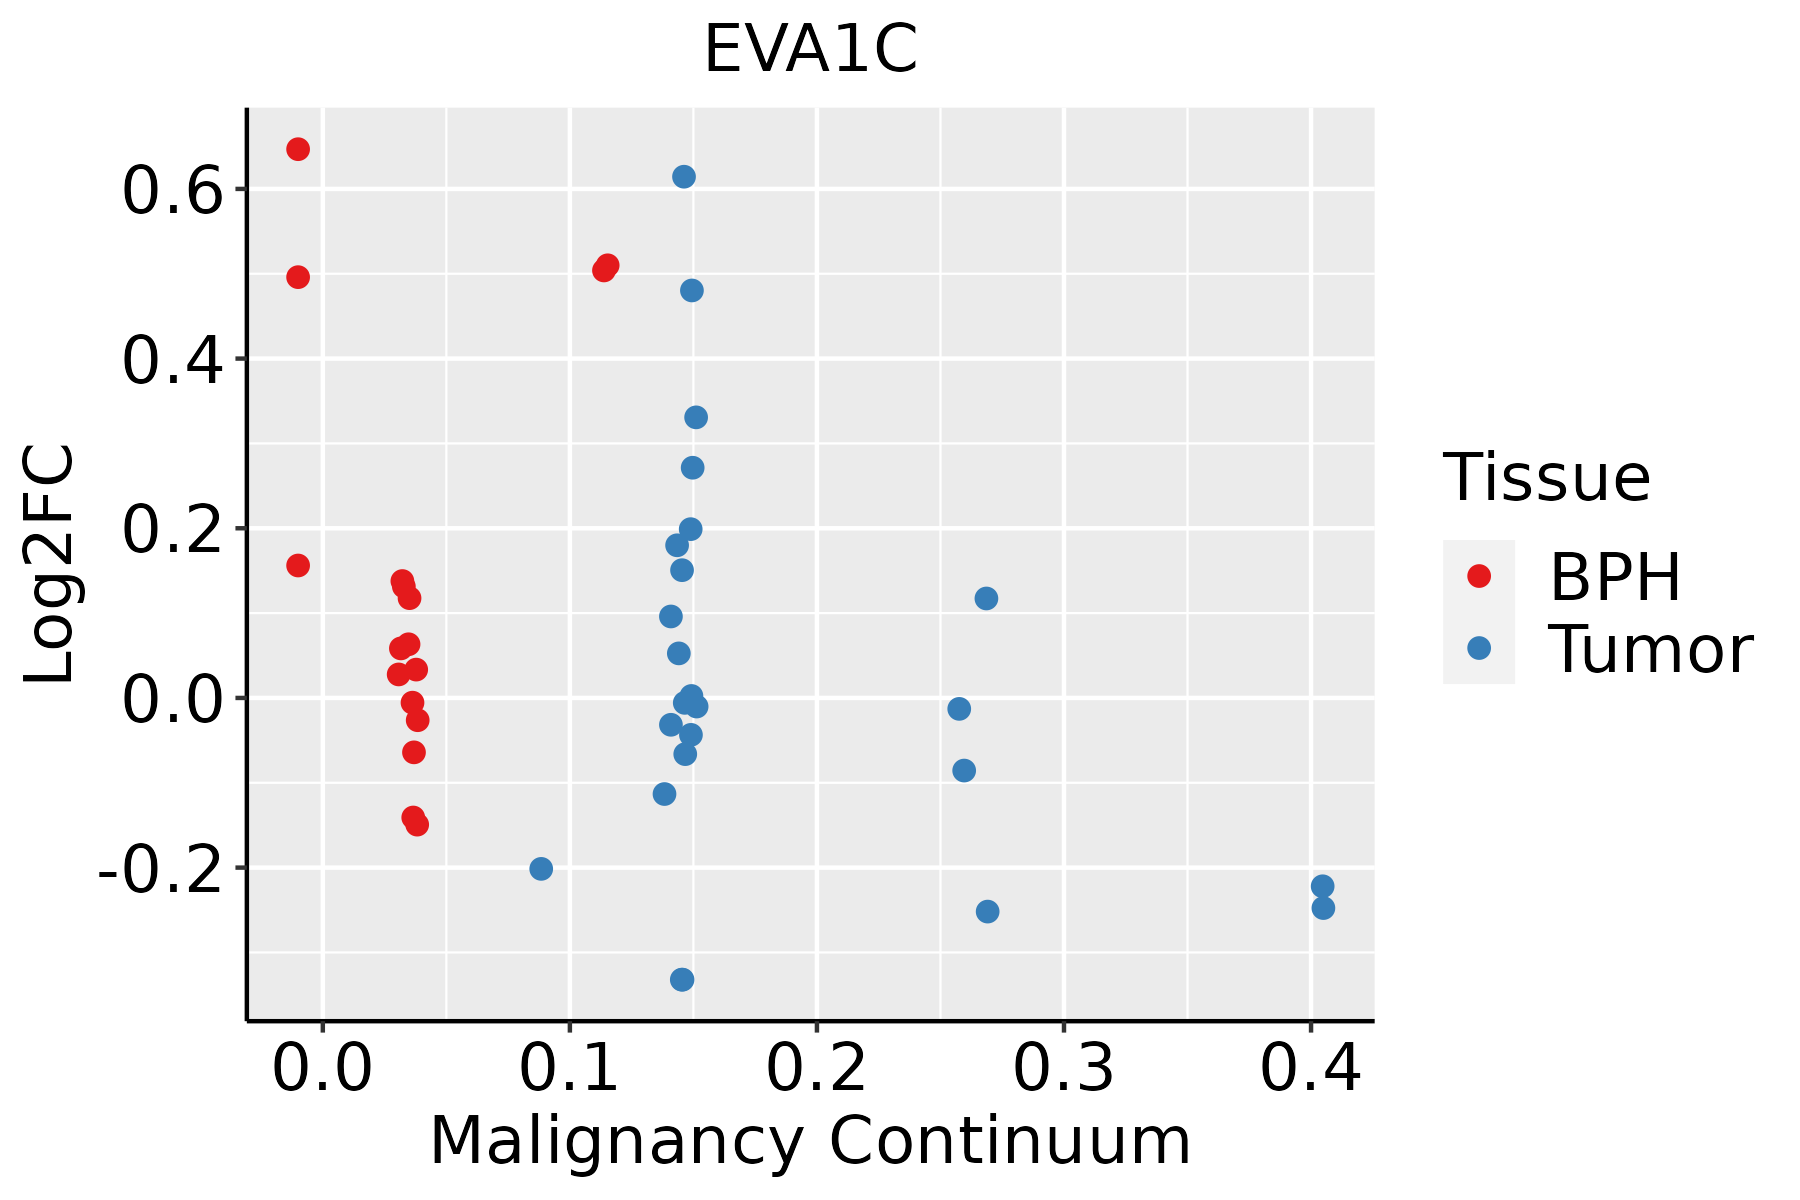 | BPH: Benign Prostatic Hyperplasia |
| Skin |  | AK: Actinic keratosis |
| cSCC: Cutaneous squamous cell carcinoma | ||
| SCCIS:squamous cell carcinoma in situ |
| ∗log2FC in expression of this searched gene in stem-like cells from each diseased tissue sample relative to stem-like cells in normal samples in each tissue plotted against the malignancy continuum. Samples are colored based on if they are from different disease stage. |
Top |
Malignant transformation related pathway analysis |
| Find out the enriched GO biological processes and KEGG pathways involved in transition from healthy to precancer to cancer |
| Tissue | Disease Stage | Enriched GO biological Processes |
| Colorectum | AD |  |
| Colorectum | SER |  |
| Colorectum | MSS |  |
| Colorectum | MSI-H |  |
| Colorectum | FAP |  |
| ∗Top 15 enriched GO BP terms are showed in the bar plot of each disease state in each tissue. Each row represents a significant GO biological process which is colored according to the -log10(p.adjust). |
| Page: 1 2 3 4 5 6 7 8 9 |
| GO ID | Tissue | Disease Stage | Description | Gene Ratio | Bg Ratio | pvalue | p.adjust | Count |
| Page: 1 |
| Pathway ID | Tissue | Disease Stage | Description | Gene Ratio | Bg Ratio | pvalue | p.adjust | qvalue | Count |
| Page: 1 |
Top |
Cell-cell communication analysis |
| Identification of potential cell-cell interactions between two cell types and their ligand-receptor pairs for different disease states |
| Ligand | Receptor | LRpair | Pathway | Tissue | Disease Stage |
| Page: 1 |
Top |
Single-cell gene regulatory network inference analysis |
| Find out the significant the regulons (TFs) and the target genes of each regulon across cell types for different disease states |
| TF | Cell Type | Tissue | Disease Stage | Target Gene | RSS | Regulon Activity |
| ∗The dot plots of a searched regulon are shown for all cell subpopulations in each disease state of each tissue based on the regulon specific score inferred using pySCENIC and by calculating the average expression. |
| Page: 1 |
Top |
Somatic mutation of malignant transformation related genes |
| Annotation of somatic variants for genes involved in malignant transformation |
| Hugo Symbol | Variant Class | Variant Classification | dbSNP RS | HGVSc | HGVSp | HGVSp Short | SWISSPROT | BIOTYPE | SIFT | PolyPhen | Tumor Sample Barcode | Tissue | Histology | Sex | Age | Stage | Therapy Types | Drugs | Outcome |
| EVA1C | SNV | Missense_Mutation | novel | c.545N>T | p.Lys182Met | p.K182M | P58658 | protein_coding | tolerated(0.06) | probably_damaging(0.941) | TCGA-A2-A0CQ-01 | Breast | breast invasive carcinoma | Female | <65 | I/II | Chemotherapy | adriamycin | SD |
| EVA1C | SNV | Missense_Mutation | c.843N>C | p.Gln281His | p.Q281H | P58658 | protein_coding | deleterious(0.01) | benign(0.332) | TCGA-A2-A0EV-01 | Breast | breast invasive carcinoma | Female | >=65 | I/II | Unknown | Unknown | SD | |
| EVA1C | SNV | Missense_Mutation | c.1220N>T | p.Ala407Val | p.A407V | P58658 | protein_coding | tolerated(0.08) | probably_damaging(0.997) | TCGA-D8-A1JK-01 | Breast | breast invasive carcinoma | Female | >=65 | I/II | Unknown | Unknown | SD | |
| EVA1C | SNV | Missense_Mutation | c.958G>A | p.Glu320Lys | p.E320K | P58658 | protein_coding | deleterious(0) | probably_damaging(0.998) | TCGA-LL-A6FP-01 | Breast | breast invasive carcinoma | Female | >=65 | I/II | Hormone Therapy | arimidex | SD | |
| EVA1C | insertion | Frame_Shift_Ins | novel | c.1264_1265insTGCTAATTACAGTATTAAAAAGTAATTCGTTAGACAT | p.Glu422ValfsTer? | p.E422Vfs*? | P58658 | protein_coding | TCGA-AO-A0J5-01 | Breast | breast invasive carcinoma | Female | <65 | III/IV | Other, specify in notesBisphosphonate | zoledronic | PD | ||
| EVA1C | SNV | Missense_Mutation | c.1106A>G | p.Glu369Gly | p.E369G | P58658 | protein_coding | tolerated(0.11) | possibly_damaging(0.559) | TCGA-AA-3977-01 | Colorectum | colon adenocarcinoma | Male | >=65 | I/II | Unknown | Unknown | SD | |
| EVA1C | SNV | Missense_Mutation | novel | c.575N>A | p.Gly192Asp | p.G192D | P58658 | protein_coding | deleterious(0) | probably_damaging(1) | TCGA-CA-6717-01 | Colorectum | colon adenocarcinoma | Male | <65 | I/II | Chemotherapy | oxaliplatin | CR |
| EVA1C | SNV | Missense_Mutation | rs779127738 | c.1172N>T | p.Ser391Leu | p.S391L | P58658 | protein_coding | tolerated(0.06) | benign(0.038) | TCGA-CM-6162-01 | Colorectum | colon adenocarcinoma | Female | <65 | III/IV | Chemotherapy | oxaliplatin | SD |
| EVA1C | SNV | Missense_Mutation | c.452N>G | p.Tyr151Cys | p.Y151C | P58658 | protein_coding | deleterious(0) | probably_damaging(0.985) | TCGA-DM-A285-01 | Colorectum | colon adenocarcinoma | Female | >=65 | III/IV | Unknown | Unknown | SD | |
| EVA1C | SNV | Missense_Mutation | novel | c.581N>T | p.Arg194Met | p.R194M | P58658 | protein_coding | tolerated(0.13) | possibly_damaging(0.663) | TCGA-AG-A002-01 | Colorectum | rectum adenocarcinoma | Male | <65 | I/II | Unknown | Unknown | SD |
| Page: 1 2 3 4 |
Top |
Related drugs of malignant transformation related genes |
| Identification of chemicals and drugs interact with genes involved in malignant transfromation |
| (DGIdb 4.0) |
| Entrez ID | Symbol | Category | Interaction Types | Drug Claim Name | Drug Name | PMIDs |
| Page: 1 |

Copyright 2023-Present -The University of Texas Health Science Center at Houston |