
|
|||||
|
 | |
| |
| |
| |
| |
| |
|
Gene: EVA1B |
Gene summary for EVA1B |
| Gene information | Species | Human | Gene symbol | EVA1B | Gene ID | 55194 |
| Gene name | eva-1 homolog B | |
| Gene Alias | C1orf78 | |
| Cytomap | 1p34.3 | |
| Gene Type | protein-coding | GO ID | GO:0005575 | UniProtAcc | Q9NVM1 |
Top |
Malignant transformation analysis |
| Identification of the aberrant gene expression in precancerous and cancerous lesions by comparing the gene expression of stem-like cells in diseased tissues with normal stem cells |
| Entrez ID | Symbol | Replicates | Species | Organ | Tissue | Adj P-value | Log2FC | Malignancy |
| 55194 | EVA1B | GSM4909296 | Human | Breast | IDC | 8.23e-05 | -2.30e-01 | 0.1524 |
| 55194 | EVA1B | GSM4909297 | Human | Breast | IDC | 2.32e-20 | 5.21e-01 | 0.1517 |
| 55194 | EVA1B | GSM4909298 | Human | Breast | IDC | 9.58e-64 | 1.04e+00 | 0.1551 |
| 55194 | EVA1B | GSM4909304 | Human | Breast | IDC | 1.23e-04 | 2.47e-01 | 0.1636 |
| 55194 | EVA1B | GSM4909306 | Human | Breast | IDC | 3.18e-04 | 2.57e-01 | 0.1564 |
| 55194 | EVA1B | GSM4909311 | Human | Breast | IDC | 3.48e-23 | 3.92e-01 | 0.1534 |
| 55194 | EVA1B | GSM4909312 | Human | Breast | IDC | 1.91e-53 | 1.05e+00 | 0.1552 |
| 55194 | EVA1B | GSM4909319 | Human | Breast | IDC | 8.26e-52 | 7.66e-01 | 0.1563 |
| 55194 | EVA1B | GSM4909321 | Human | Breast | IDC | 1.08e-07 | 2.31e-01 | 0.1559 |
| 55194 | EVA1B | NCCBC2 | Human | Breast | DCIS | 2.85e-04 | 2.94e-01 | 0.1554 |
| 55194 | EVA1B | NCCBC5 | Human | Breast | DCIS | 1.69e-02 | -6.34e-02 | 0.2046 |
| 55194 | EVA1B | P1 | Human | Breast | IDC | 2.49e-08 | -5.96e-02 | 0.1527 |
| 55194 | EVA1B | DCIS2 | Human | Breast | DCIS | 4.04e-36 | 7.87e-02 | 0.0085 |
| 55194 | EVA1B | HCC1_Meng | Human | Liver | HCC | 6.48e-45 | 1.28e-01 | 0.0246 |
| 55194 | EVA1B | HCC2_Meng | Human | Liver | HCC | 2.15e-08 | 4.03e-02 | 0.0107 |
| 55194 | EVA1B | cirrhotic3 | Human | Liver | Cirrhotic | 2.61e-12 | 2.93e-01 | 0.0215 |
| 55194 | EVA1B | HCC2 | Human | Liver | HCC | 3.35e-02 | 1.88e+00 | 0.5341 |
| 55194 | EVA1B | Pt13.b | Human | Liver | HCC | 3.67e-15 | 3.07e-01 | 0.0251 |
| 55194 | EVA1B | S014 | Human | Liver | HCC | 2.02e-27 | 9.84e-01 | 0.2254 |
| 55194 | EVA1B | S015 | Human | Liver | HCC | 5.27e-26 | 9.42e-01 | 0.2375 |
| Page: 1 2 3 |
| Tissue | Expression Dynamics | Abbreviation |
| Breast | 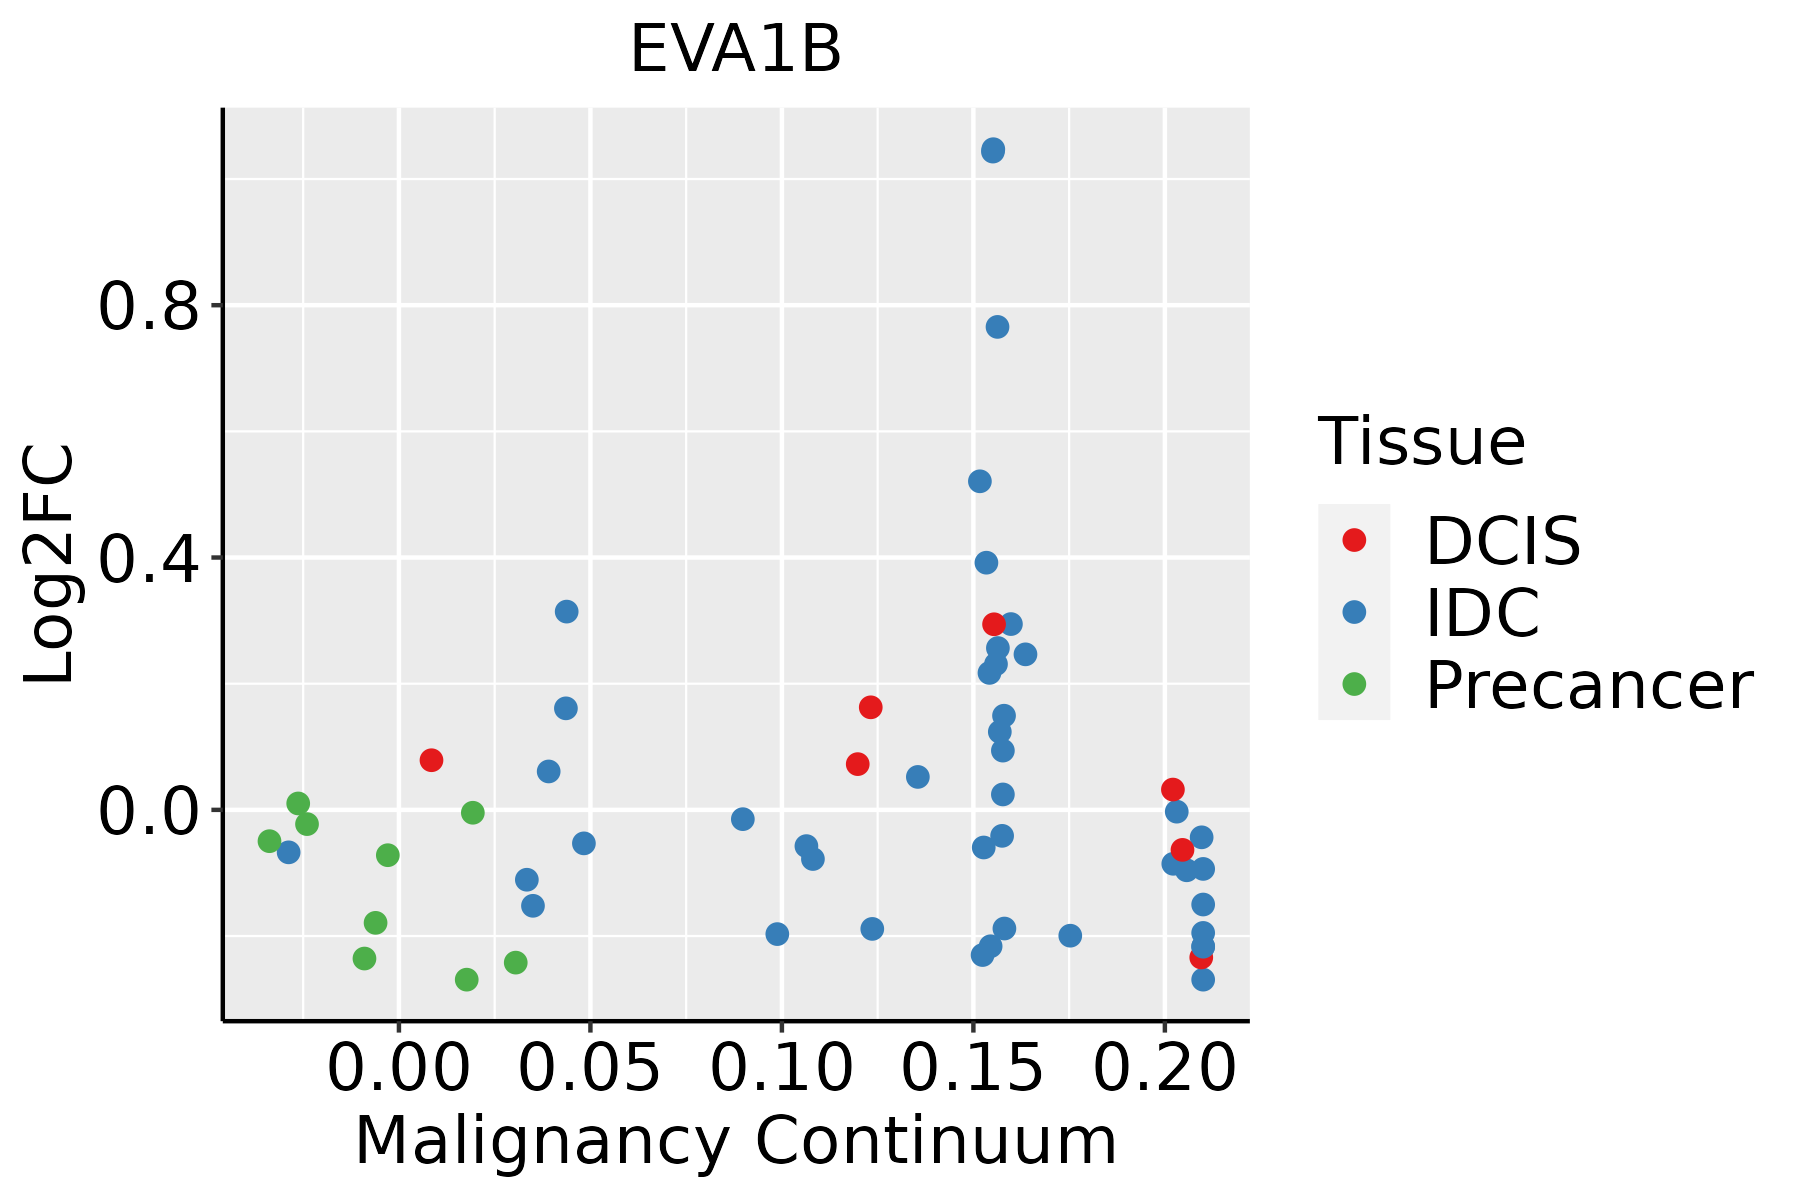 | IDC: Invasive ductal carcinoma |
| DCIS: Ductal carcinoma in situ | ||
| Precancer(BRCA1-mut): Precancerous lesion from BRCA1 mutation carriers | ||
| Liver | 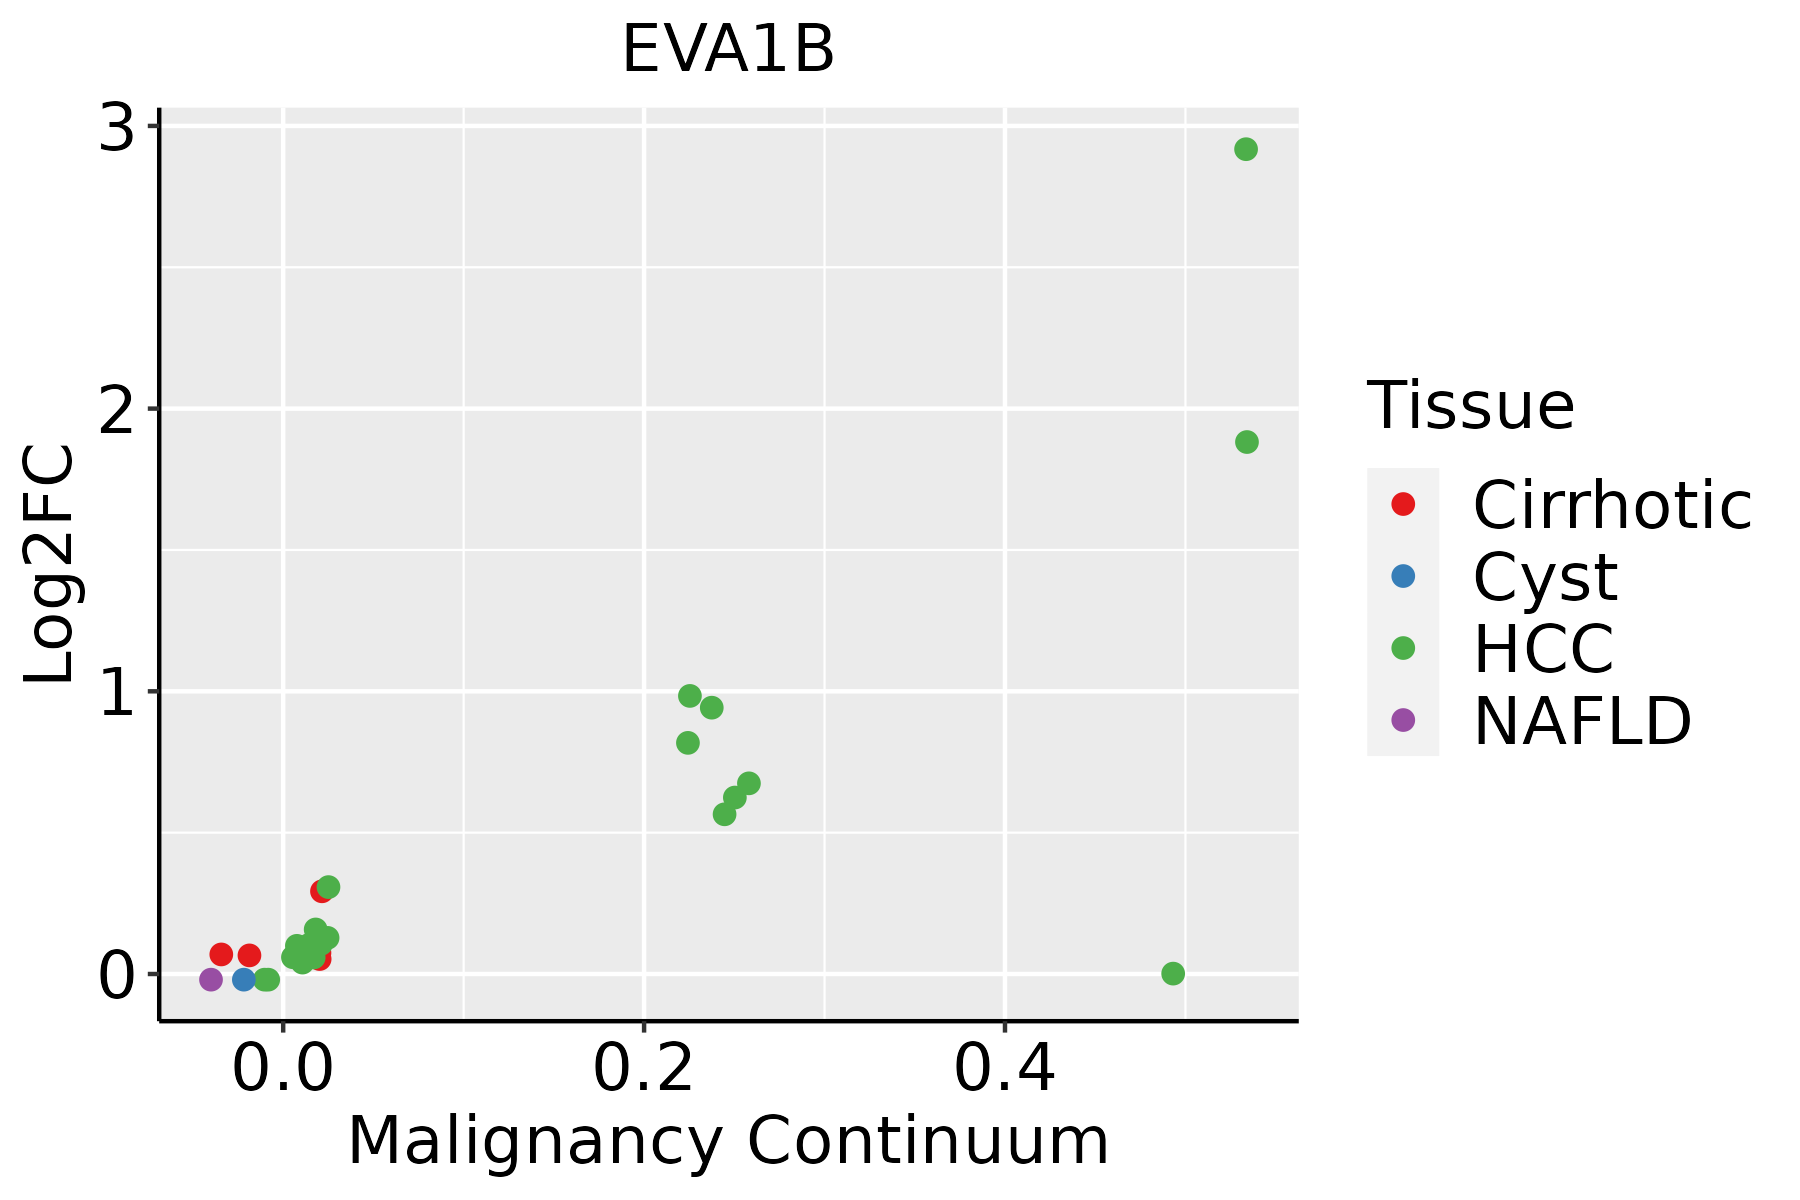 | HCC: Hepatocellular carcinoma |
| NAFLD: Non-alcoholic fatty liver disease | ||
| Oral Cavity | 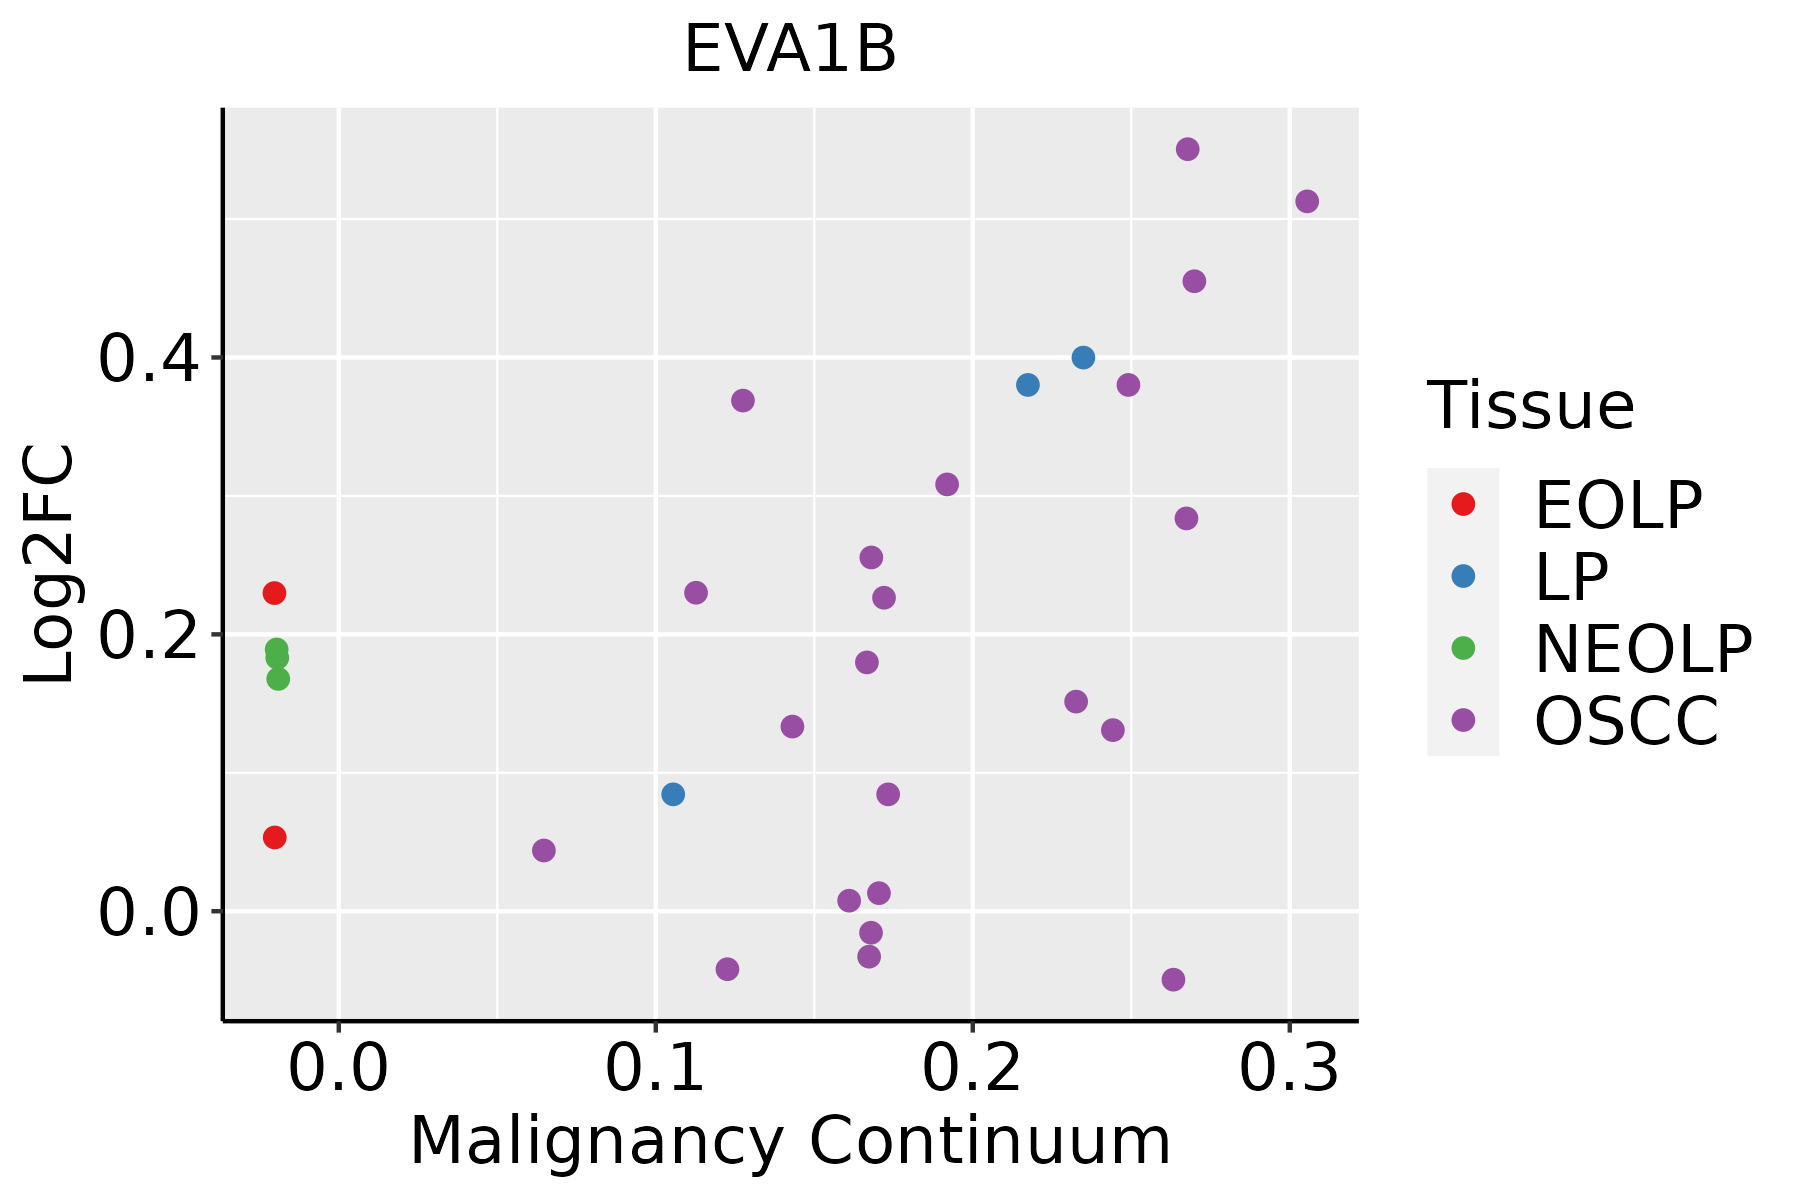 | EOLP: Erosive Oral lichen planus |
| LP: leukoplakia | ||
| NEOLP: Non-erosive oral lichen planus | ||
| OSCC: Oral squamous cell carcinoma | ||
| Thyroid | 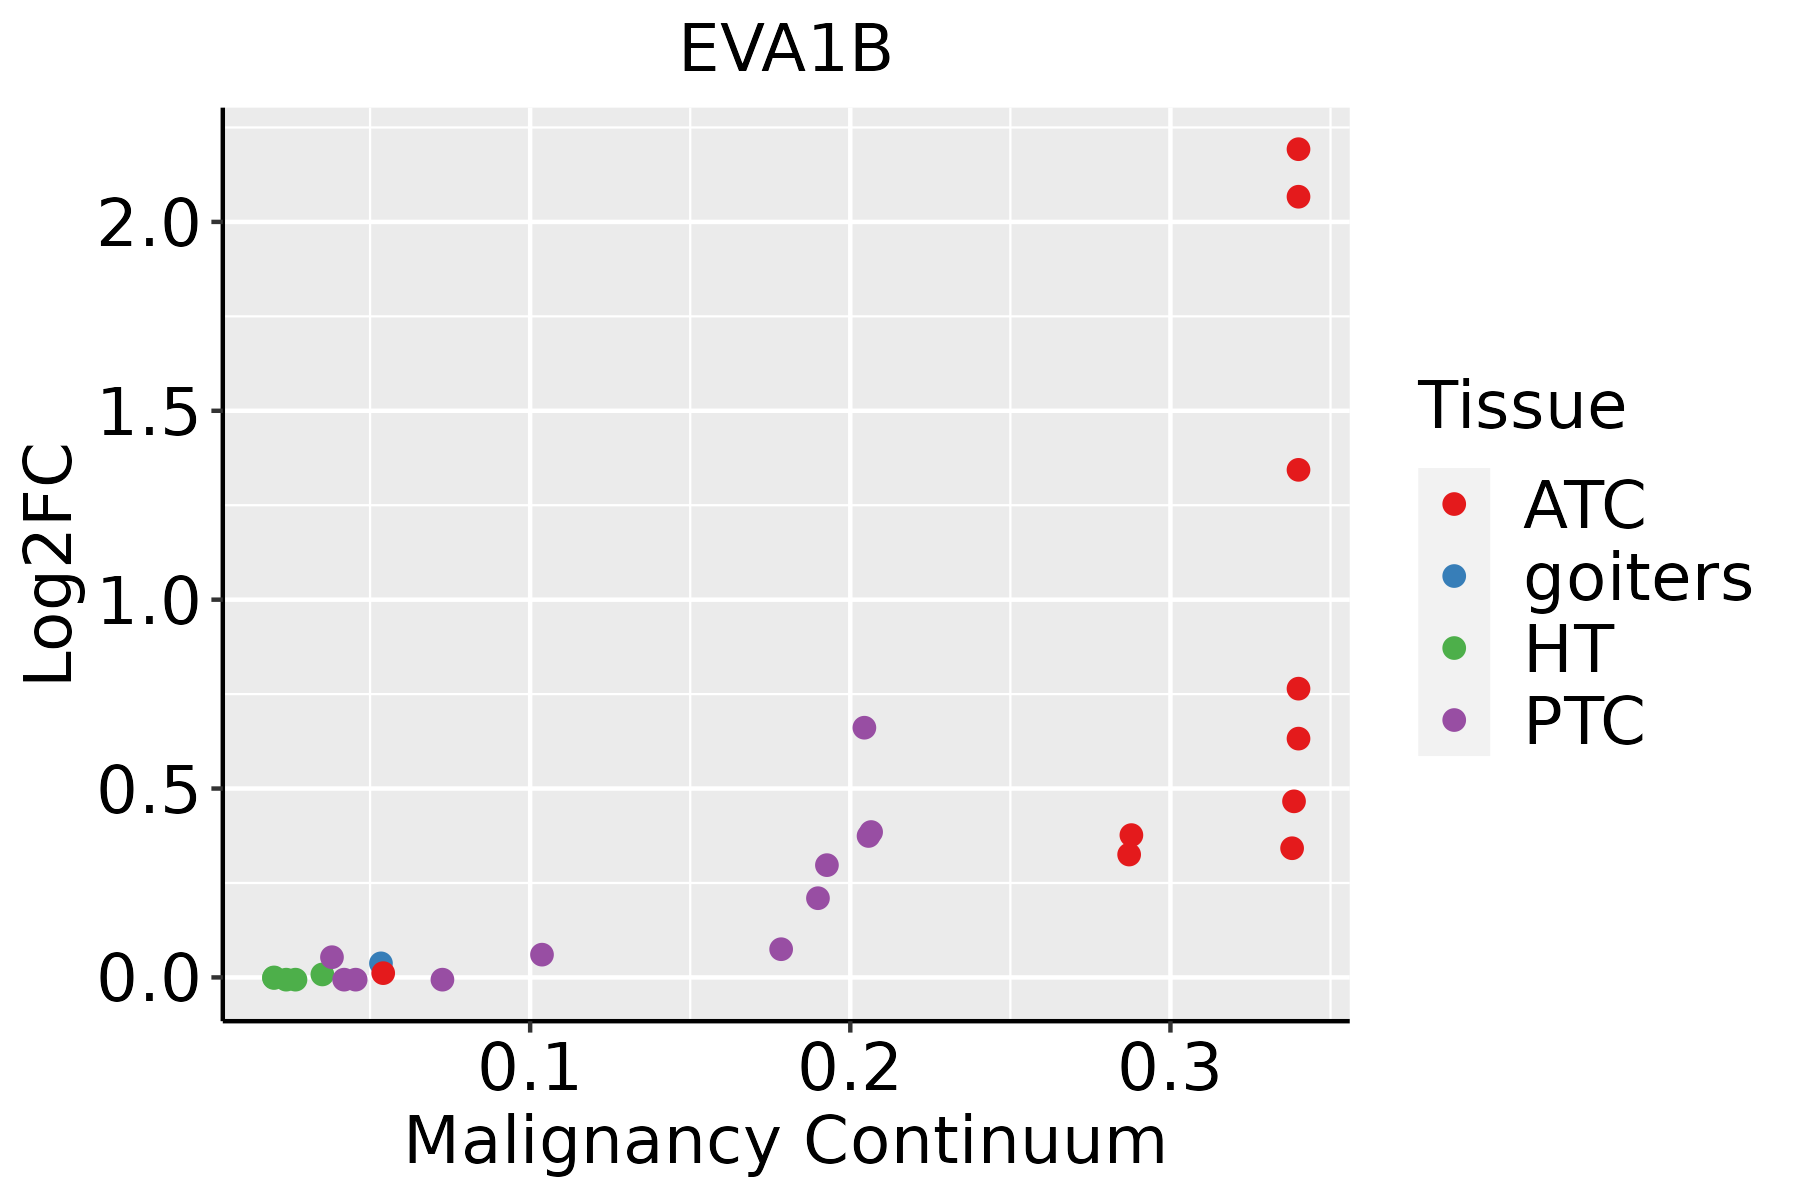 | ATC: Anaplastic thyroid cancer |
| HT: Hashimoto's thyroiditis | ||
| PTC: Papillary thyroid cancer |
| ∗log2FC in expression of this searched gene in stem-like cells from each diseased tissue sample relative to stem-like cells in normal samples in each tissue plotted against the malignancy continuum. Samples are colored based on if they are from different disease stage. |
Top |
Malignant transformation related pathway analysis |
| Find out the enriched GO biological processes and KEGG pathways involved in transition from healthy to precancer to cancer |
| Tissue | Disease Stage | Enriched GO biological Processes |
| Colorectum | AD |  |
| Colorectum | SER |  |
| Colorectum | MSS |  |
| Colorectum | MSI-H |  |
| Colorectum | FAP |  |
| ∗Top 15 enriched GO BP terms are showed in the bar plot of each disease state in each tissue. Each row represents a significant GO biological process which is colored according to the -log10(p.adjust). |
| Page: 1 2 3 4 5 6 7 8 9 |
| GO ID | Tissue | Disease Stage | Description | Gene Ratio | Bg Ratio | pvalue | p.adjust | Count |
| Page: 1 |
| Pathway ID | Tissue | Disease Stage | Description | Gene Ratio | Bg Ratio | pvalue | p.adjust | qvalue | Count |
| Page: 1 |
Top |
Cell-cell communication analysis |
| Identification of potential cell-cell interactions between two cell types and their ligand-receptor pairs for different disease states |
| Ligand | Receptor | LRpair | Pathway | Tissue | Disease Stage |
| Page: 1 |
Top |
Single-cell gene regulatory network inference analysis |
| Find out the significant the regulons (TFs) and the target genes of each regulon across cell types for different disease states |
| TF | Cell Type | Tissue | Disease Stage | Target Gene | RSS | Regulon Activity |
| ∗The dot plots of a searched regulon are shown for all cell subpopulations in each disease state of each tissue based on the regulon specific score inferred using pySCENIC and by calculating the average expression. |
| Page: 1 |
Top |
Somatic mutation of malignant transformation related genes |
| Annotation of somatic variants for genes involved in malignant transformation |
| Hugo Symbol | Variant Class | Variant Classification | dbSNP RS | HGVSc | HGVSp | HGVSp Short | SWISSPROT | BIOTYPE | SIFT | PolyPhen | Tumor Sample Barcode | Tissue | Histology | Sex | Age | Stage | Therapy Types | Drugs | Outcome |
| EVA1B | SNV | Missense_Mutation | novel | c.389N>T | p.Arg130Leu | p.R130L | Q9NVM1 | protein_coding | deleterious(0) | possibly_damaging(0.446) | TCGA-VS-A9UJ-01 | Cervix | cervical & endocervical cancer | Female | <65 | I/II | Unknown | Unknown | PD |
| EVA1B | SNV | Missense_Mutation | c.76N>A | p.Glu26Lys | p.E26K | Q9NVM1 | protein_coding | deleterious(0.01) | probably_damaging(0.922) | TCGA-AZ-6598-01 | Colorectum | colon adenocarcinoma | Female | >=65 | I/II | Unknown | Unknown | SD | |
| EVA1B | SNV | Missense_Mutation | c.56C>T | p.Ala19Val | p.A19V | Q9NVM1 | protein_coding | deleterious(0.01) | benign(0.415) | TCGA-CM-4746-01 | Colorectum | colon adenocarcinoma | Male | <65 | I/II | Unknown | Unknown | SD | |
| EVA1B | SNV | Missense_Mutation | novel | c.119T>C | p.Leu40Pro | p.L40P | Q9NVM1 | protein_coding | deleterious(0) | probably_damaging(0.999) | TCGA-CM-5861-01 | Colorectum | colon adenocarcinoma | Female | <65 | I/II | Unknown | Unknown | PD |
| EVA1B | SNV | Missense_Mutation | rs748202520 | c.64N>G | p.Arg22Gly | p.R22G | Q9NVM1 | protein_coding | tolerated(0.18) | possibly_damaging(0.556) | TCGA-DD-A1EE-01 | Liver | liver hepatocellular carcinoma | Male | >=65 | III/IV | Unknown | Unknown | PD |
| EVA1B | SNV | Missense_Mutation | c.365N>T | p.Ala122Val | p.A122V | Q9NVM1 | protein_coding | deleterious(0) | probably_damaging(0.998) | TCGA-86-A4JF-01 | Lung | lung adenocarcinoma | Male | <65 | I/II | Chemotherapy | unknown | PD | |
| EVA1B | SNV | Missense_Mutation | rs759982436 | c.14N>A | p.Arg5Gln | p.R5Q | Q9NVM1 | protein_coding | deleterious(0.04) | benign(0) | TCGA-97-8176-01 | Lung | lung adenocarcinoma | Male | <65 | III/IV | Chemotherapy | carboplatin | PR |
| EVA1B | SNV | Missense_Mutation | c.365N>T | p.Ala122Val | p.A122V | Q9NVM1 | protein_coding | deleterious(0) | probably_damaging(0.998) | TCGA-63-A5MM-01 | Lung | lung squamous cell carcinoma | Female | >=65 | I/II | Chemotherapy | cisplatin | PD | |
| EVA1B | SNV | Missense_Mutation | c.37N>C | p.Asn13His | p.N13H | Q9NVM1 | protein_coding | deleterious(0.04) | benign(0.347) | TCGA-66-2771-01 | Lung | lung squamous cell carcinoma | Male | <65 | I/II | Chemotherapy | carboplatin | CR |
| Page: 1 |
Top |
Related drugs of malignant transformation related genes |
| Identification of chemicals and drugs interact with genes involved in malignant transfromation |
| (DGIdb 4.0) |
| Entrez ID | Symbol | Category | Interaction Types | Drug Claim Name | Drug Name | PMIDs |
| Page: 1 |

Copyright 2023-Present -The University of Texas Health Science Center at Houston |