
|
|||||
|
 | |
| |
| |
| |
| |
| |
|
Gene: ETV7 |
Gene summary for ETV7 |
| Gene information | Species | Human | Gene symbol | ETV7 | Gene ID | 51513 |
| Gene name | ETS variant transcription factor 7 | |
| Gene Alias | TEL-2 | |
| Cytomap | 6p21.31 | |
| Gene Type | protein-coding | GO ID | GO:0000122 | UniProtAcc | Q9Y603 |
Top |
Malignant transformation analysis |
| Identification of the aberrant gene expression in precancerous and cancerous lesions by comparing the gene expression of stem-like cells in diseased tissues with normal stem cells |
| Entrez ID | Symbol | Replicates | Species | Organ | Tissue | Adj P-value | Log2FC | Malignancy |
| 51513 | ETV7 | LZE8T | Human | Esophagus | ESCC | 1.11e-02 | 1.50e-01 | 0.067 |
| 51513 | ETV7 | LZE20T | Human | Esophagus | ESCC | 1.59e-05 | 2.75e-01 | 0.0662 |
| 51513 | ETV7 | LZE24T | Human | Esophagus | ESCC | 3.10e-12 | 4.21e-01 | 0.0596 |
| 51513 | ETV7 | P2T-E | Human | Esophagus | ESCC | 9.86e-34 | 5.95e-01 | 0.1177 |
| 51513 | ETV7 | P4T-E | Human | Esophagus | ESCC | 3.74e-11 | 3.04e-01 | 0.1323 |
| 51513 | ETV7 | P5T-E | Human | Esophagus | ESCC | 2.06e-08 | 2.03e-01 | 0.1327 |
| 51513 | ETV7 | P8T-E | Human | Esophagus | ESCC | 1.00e-24 | 4.63e-01 | 0.0889 |
| 51513 | ETV7 | P9T-E | Human | Esophagus | ESCC | 2.17e-27 | 6.30e-01 | 0.1131 |
| 51513 | ETV7 | P11T-E | Human | Esophagus | ESCC | 2.55e-10 | 4.72e-01 | 0.1426 |
| 51513 | ETV7 | P12T-E | Human | Esophagus | ESCC | 1.97e-10 | 2.57e-01 | 0.1122 |
| 51513 | ETV7 | P15T-E | Human | Esophagus | ESCC | 5.50e-14 | 4.14e-01 | 0.1149 |
| 51513 | ETV7 | P16T-E | Human | Esophagus | ESCC | 1.96e-05 | 7.80e-02 | 0.1153 |
| 51513 | ETV7 | P17T-E | Human | Esophagus | ESCC | 1.22e-09 | 4.23e-01 | 0.1278 |
| 51513 | ETV7 | P21T-E | Human | Esophagus | ESCC | 9.53e-09 | 2.34e-01 | 0.1617 |
| 51513 | ETV7 | P22T-E | Human | Esophagus | ESCC | 3.97e-04 | 1.13e-01 | 0.1236 |
| 51513 | ETV7 | P23T-E | Human | Esophagus | ESCC | 2.59e-18 | 5.65e-01 | 0.108 |
| 51513 | ETV7 | P24T-E | Human | Esophagus | ESCC | 3.02e-26 | 5.69e-01 | 0.1287 |
| 51513 | ETV7 | P26T-E | Human | Esophagus | ESCC | 9.02e-11 | 2.22e-01 | 0.1276 |
| 51513 | ETV7 | P27T-E | Human | Esophagus | ESCC | 2.39e-24 | 4.14e-01 | 0.1055 |
| 51513 | ETV7 | P28T-E | Human | Esophagus | ESCC | 2.27e-21 | 4.08e-01 | 0.1149 |
| Page: 1 2 3 4 |
| Tissue | Expression Dynamics | Abbreviation |
| Esophagus | 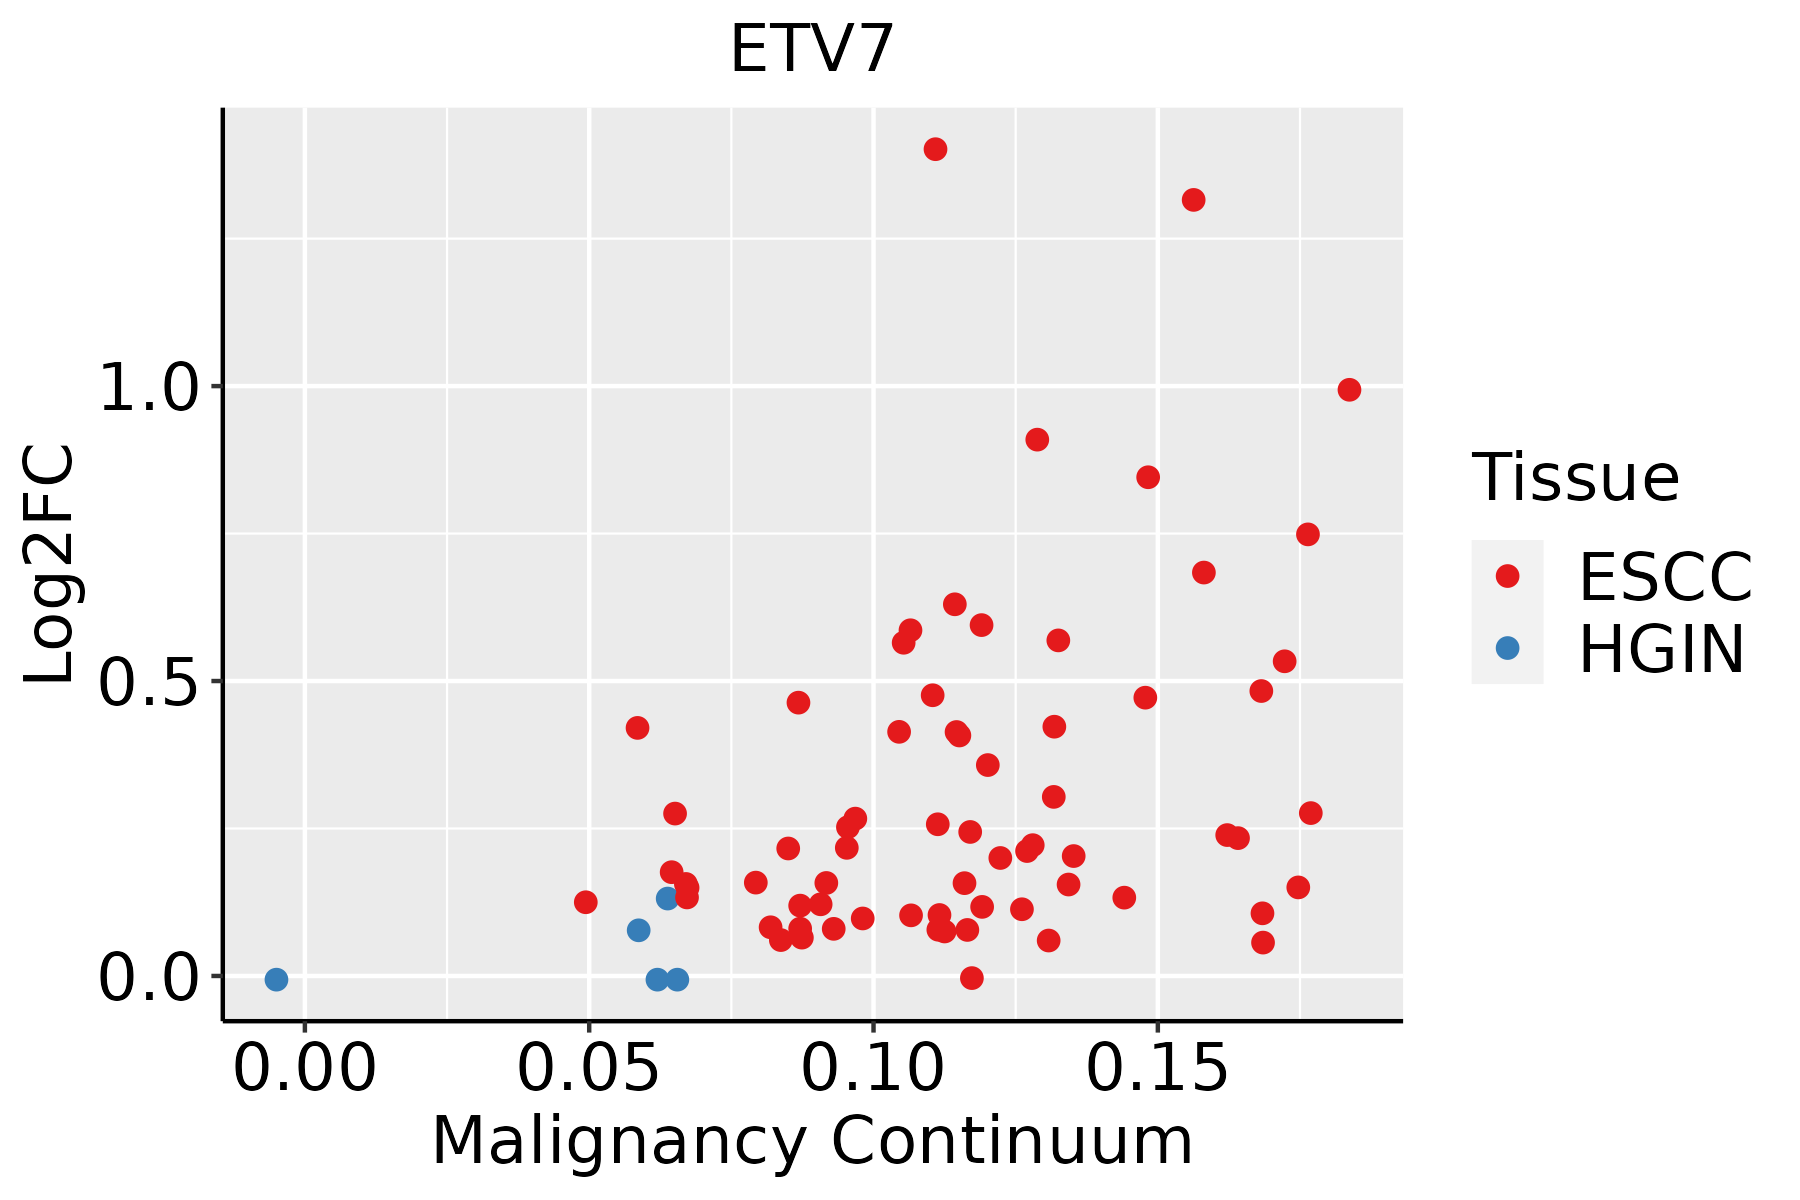 | ESCC: Esophageal squamous cell carcinoma |
| HGIN: High-grade intraepithelial neoplasias | ||
| LGIN: Low-grade intraepithelial neoplasias | ||
| Liver | 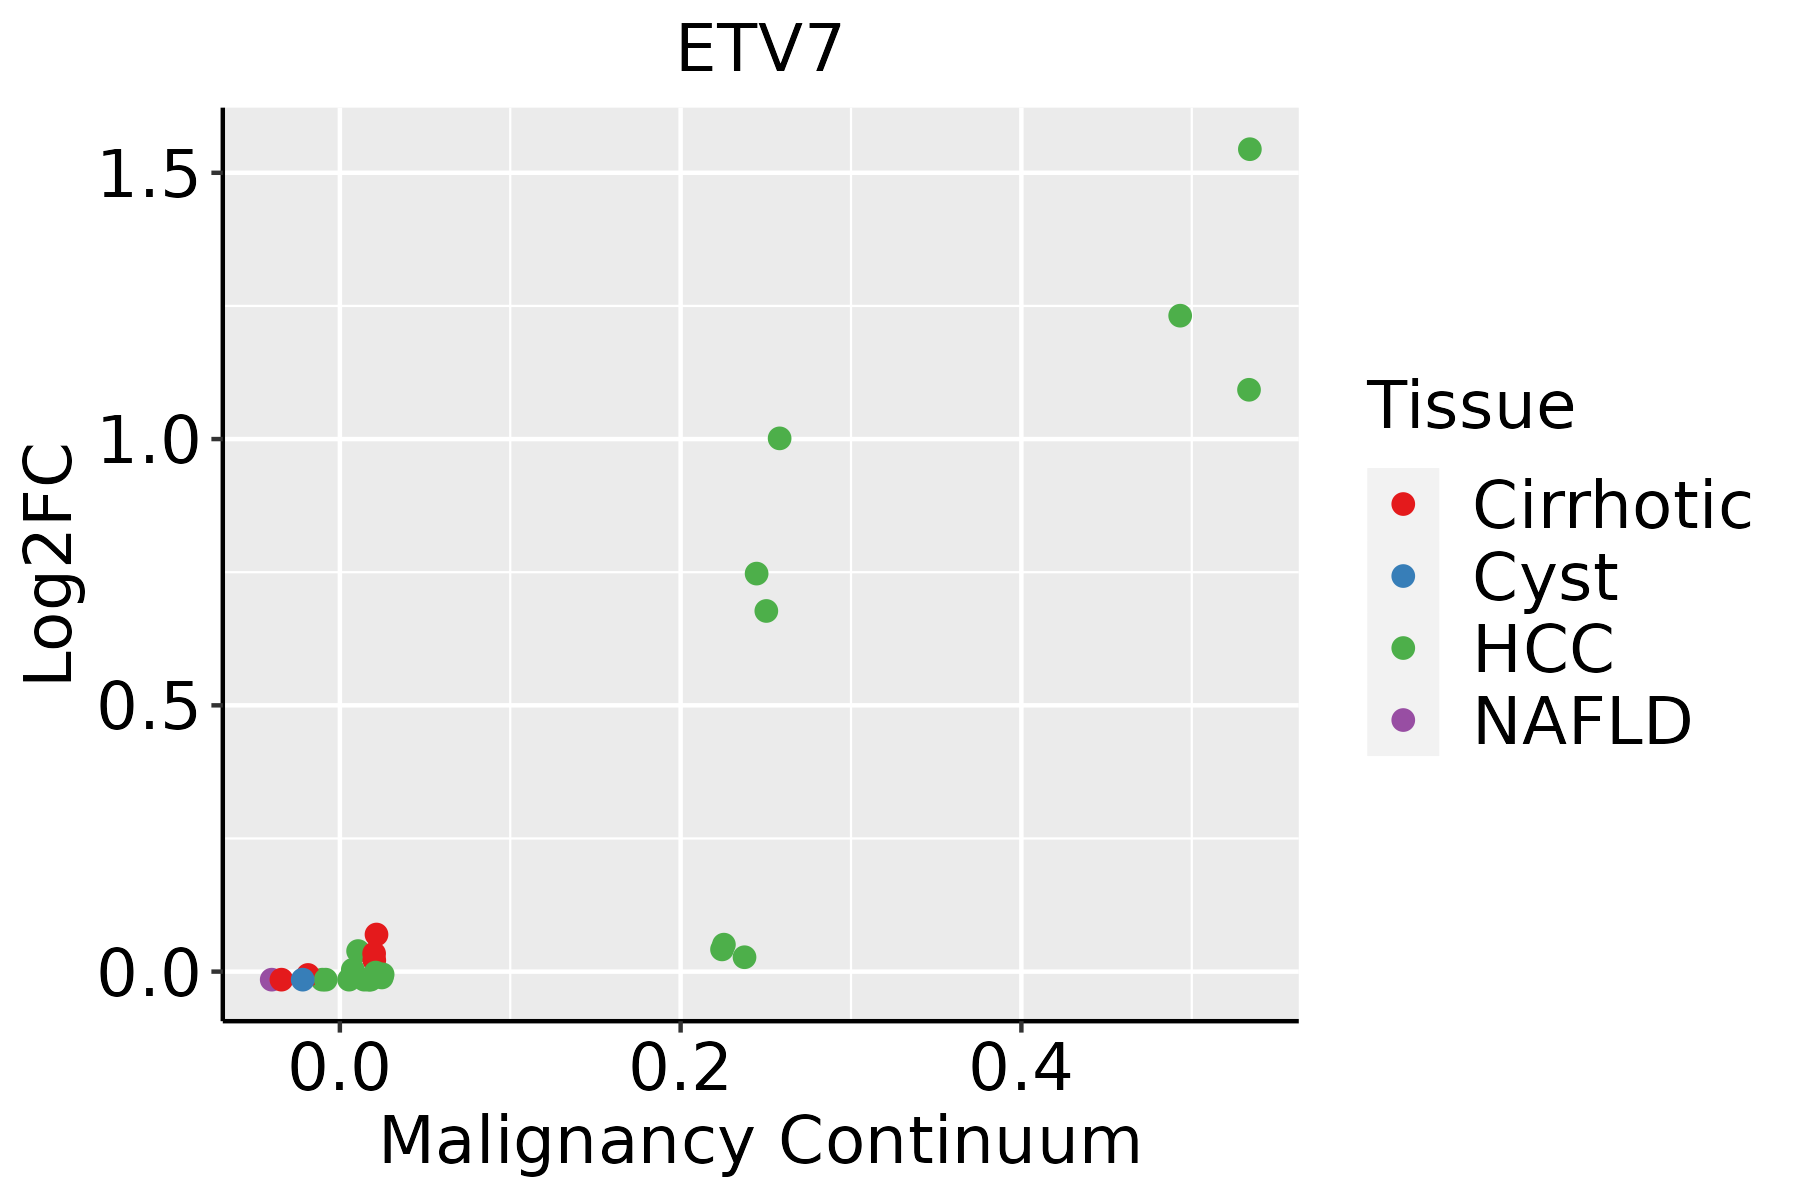 | HCC: Hepatocellular carcinoma |
| NAFLD: Non-alcoholic fatty liver disease | ||
| Oral Cavity |  | EOLP: Erosive Oral lichen planus |
| LP: leukoplakia | ||
| NEOLP: Non-erosive oral lichen planus | ||
| OSCC: Oral squamous cell carcinoma | ||
| Thyroid | 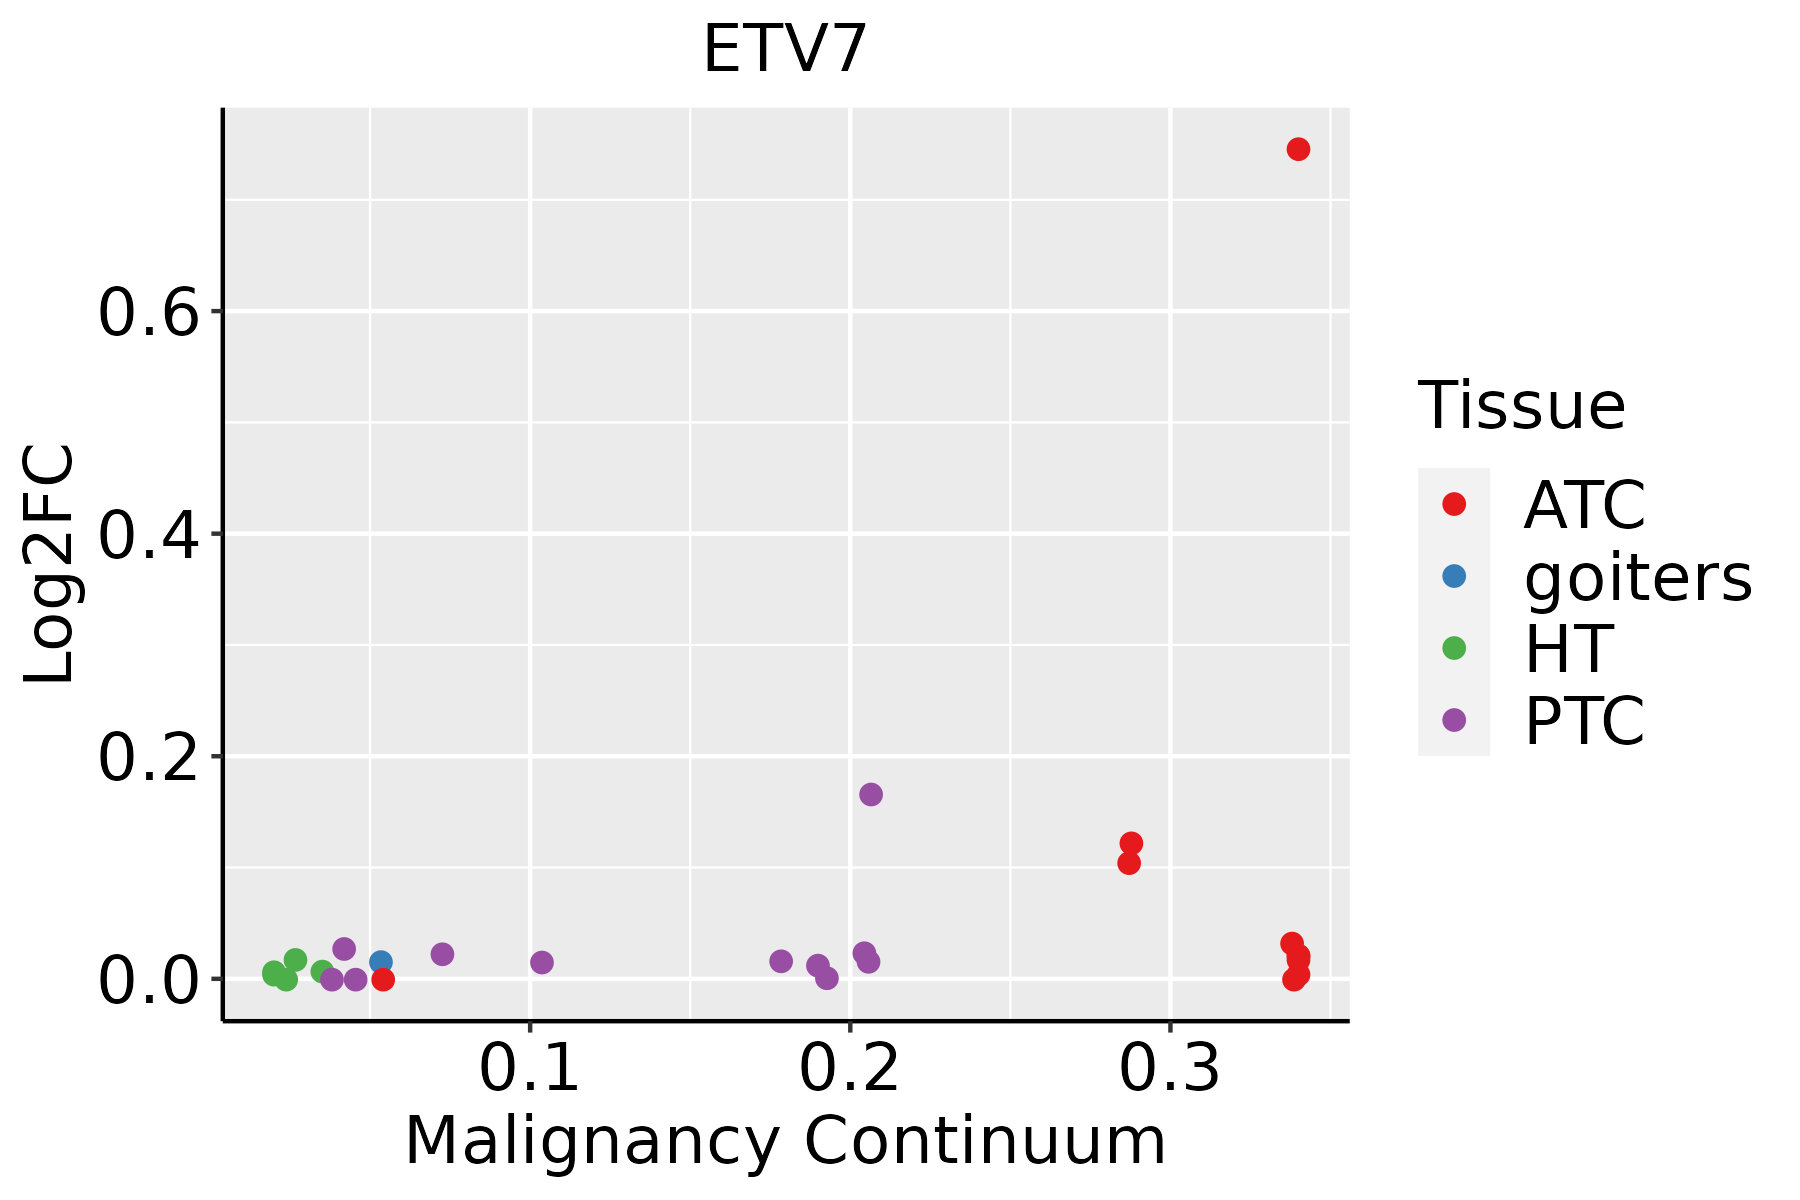 | ATC: Anaplastic thyroid cancer |
| HT: Hashimoto's thyroiditis | ||
| PTC: Papillary thyroid cancer |
| ∗log2FC in expression of this searched gene in stem-like cells from each diseased tissue sample relative to stem-like cells in normal samples in each tissue plotted against the malignancy continuum. Samples are colored based on if they are from different disease stage. |
Top |
Malignant transformation related pathway analysis |
| Find out the enriched GO biological processes and KEGG pathways involved in transition from healthy to precancer to cancer |
| Tissue | Disease Stage | Enriched GO biological Processes |
| Colorectum | AD |  |
| Colorectum | SER |  |
| Colorectum | MSS |  |
| Colorectum | MSI-H |  |
| Colorectum | FAP |  |
| ∗Top 15 enriched GO BP terms are showed in the bar plot of each disease state in each tissue. Each row represents a significant GO biological process which is colored according to the -log10(p.adjust). |
| Page: 1 2 3 4 5 6 7 8 9 |
| GO ID | Tissue | Disease Stage | Description | Gene Ratio | Bg Ratio | pvalue | p.adjust | Count |
| Page: 1 |
| Pathway ID | Tissue | Disease Stage | Description | Gene Ratio | Bg Ratio | pvalue | p.adjust | qvalue | Count |
| hsa052028 | Esophagus | ESCC | Transcriptional misregulation in cancer | 116/4205 | 193/8465 | 2.08e-03 | 5.95e-03 | 3.05e-03 | 116 |
| hsa0520213 | Esophagus | ESCC | Transcriptional misregulation in cancer | 116/4205 | 193/8465 | 2.08e-03 | 5.95e-03 | 3.05e-03 | 116 |
| Page: 1 |
Top |
Cell-cell communication analysis |
| Identification of potential cell-cell interactions between two cell types and their ligand-receptor pairs for different disease states |
| Ligand | Receptor | LRpair | Pathway | Tissue | Disease Stage |
| Page: 1 |
Top |
Single-cell gene regulatory network inference analysis |
| Find out the significant the regulons (TFs) and the target genes of each regulon across cell types for different disease states |
| TF | Cell Type | Tissue | Disease Stage | Target Gene | RSS | Regulon Activity |
| ETV7 | IMENT | Colorectum | MSS | GBP4,BATF2,STAT1, etc. | 4.42e-02 |  |
| ETV7 | NKT | Pancreas | ADJ | AC025171.3,IL12RB2,GBP5, etc. | 4.03e-01 |  |
| ETV7 | NKT | Pancreas | PanIN | AC025171.3,IL12RB2,GBP5, etc. | 1.10e-01 |  |
| ETV7 | TREG | Pancreas | PDAC | AC025171.3,IL12RB2,GBP5, etc. | 1.53e-01 |  |
| ETV7 | NKT | Pancreas | PDAC | AC025171.3,IL12RB2,GBP5, etc. | 9.87e-02 | |
| ETV7 | APCAF | Pancreas | ADJ | PLCG2,GBP1,PLAAT4, etc. | 2.36e-02 | |
| ETV7 | MSC | Pancreas | Healthy | PLCG2,GBP1,PLAAT4, etc. | 3.23e-02 |  |
| ETV7 | PTC | Thyroid | ATC | C1orf167,RARRES3,NPTX2, etc. | 3.59e-01 |  |
| ∗The dot plots of a searched regulon are shown for all cell subpopulations in each disease state of each tissue based on the regulon specific score inferred using pySCENIC and by calculating the average expression. |
| Page: 1 |
Top |
Somatic mutation of malignant transformation related genes |
| Annotation of somatic variants for genes involved in malignant transformation |
| Hugo Symbol | Variant Class | Variant Classification | dbSNP RS | HGVSc | HGVSp | HGVSp Short | SWISSPROT | BIOTYPE | SIFT | PolyPhen | Tumor Sample Barcode | Tissue | Histology | Sex | Age | Stage | Therapy Types | Drugs | Outcome |
| ETV7 | SNV | Missense_Mutation | novel | c.755N>C | p.Ile252Thr | p.I252T | Q9Y603 | protein_coding | deleterious(0) | probably_damaging(0.937) | TCGA-D8-A1XK-01 | Breast | breast invasive carcinoma | Female | <65 | I/II | Chemotherapy | doxorubicine+cyclophosphamide | SD |
| ETV7 | insertion | Frame_Shift_Ins | novel | c.710_711insGGGATGTGGT | p.Arg238GlyfsTer6 | p.R238Gfs*6 | Q9Y603 | protein_coding | TCGA-BH-A0BR-01 | Breast | breast invasive carcinoma | Female | <65 | I/II | Unknown | Unknown | SD | ||
| ETV7 | SNV | Missense_Mutation | novel | c.773C>T | p.Pro258Leu | p.P258L | Q9Y603 | protein_coding | deleterious(0) | probably_damaging(1) | TCGA-AA-A029-01 | Colorectum | colon adenocarcinoma | Male | >=65 | I/II | Unknown | Unknown | SD |
| ETV7 | SNV | Missense_Mutation | novel | c.38N>A | p.Pro13His | p.P13H | Q9Y603 | protein_coding | deleterious(0.02) | possibly_damaging(0.62) | TCGA-D5-6928-01 | Colorectum | colon adenocarcinoma | Male | >=65 | I/II | Unknown | Unknown | SD |
| ETV7 | SNV | Missense_Mutation | rs768642185 | c.851N>A | p.Arg284His | p.R284H | Q9Y603 | protein_coding | deleterious(0) | probably_damaging(1) | TCGA-A5-A0G2-01 | Endometrium | uterine corpus endometrioid carcinoma | Female | <65 | III/IV | Unknown | Unknown | SD |
| ETV7 | SNV | Missense_Mutation | novel | c.827N>G | p.Tyr276Cys | p.Y276C | Q9Y603 | protein_coding | deleterious(0) | probably_damaging(1) | TCGA-A5-A1OF-01 | Endometrium | uterine corpus endometrioid carcinoma | Female | <65 | I/II | Unknown | Unknown | SD |
| ETV7 | SNV | Missense_Mutation | novel | c.370N>G | p.Pro124Ala | p.P124A | Q9Y603 | protein_coding | deleterious(0.04) | benign(0.03) | TCGA-A5-A1OF-01 | Endometrium | uterine corpus endometrioid carcinoma | Female | <65 | I/II | Unknown | Unknown | SD |
| ETV7 | SNV | Missense_Mutation | novel | c.913C>A | p.Leu305Ile | p.L305I | Q9Y603 | protein_coding | deleterious(0.01) | probably_damaging(0.966) | TCGA-AJ-A3EL-01 | Endometrium | uterine corpus endometrioid carcinoma | Female | <65 | I/II | Unknown | Unknown | SD |
| ETV7 | SNV | Missense_Mutation | novel | c.143G>A | p.Arg48His | p.R48H | Q9Y603 | protein_coding | deleterious(0) | probably_damaging(1) | TCGA-AP-A1DV-01 | Endometrium | uterine corpus endometrioid carcinoma | Female | <65 | I/II | Unknown | Unknown | SD |
| ETV7 | SNV | Missense_Mutation | rs750289065 | c.661N>A | p.Ala221Thr | p.A221T | Q9Y603 | protein_coding | deleterious(0.05) | possibly_damaging(0.449) | TCGA-AX-A1CE-01 | Endometrium | uterine corpus endometrioid carcinoma | Female | <65 | I/II | Unspecific | Paclitaxel | SD |
| Page: 1 2 3 4 |
Top |
Related drugs of malignant transformation related genes |
| Identification of chemicals and drugs interact with genes involved in malignant transfromation |
| (DGIdb 4.0) |
| Entrez ID | Symbol | Category | Interaction Types | Drug Claim Name | Drug Name | PMIDs |
| Page: 1 |

Copyright 2023-Present -The University of Texas Health Science Center at Houston |