
|
|||||
|
 | |
| |
| |
| |
| |
| |
|
Gene: ETV6 |
Gene summary for ETV6 |
| Gene information | Species | Human | Gene symbol | ETV6 | Gene ID | 2120 |
| Gene name | ETS variant transcription factor 6 | |
| Gene Alias | TEL | |
| Cytomap | 12p13.2 | |
| Gene Type | protein-coding | GO ID | GO:0000003 | UniProtAcc | A0A0S2Z3C9 |
Top |
Malignant transformation analysis |
| Identification of the aberrant gene expression in precancerous and cancerous lesions by comparing the gene expression of stem-like cells in diseased tissues with normal stem cells |
| Entrez ID | Symbol | Replicates | Species | Organ | Tissue | Adj P-value | Log2FC | Malignancy |
| 2120 | ETV6 | CA_HPV_1 | Human | Cervix | CC | 8.38e-06 | 1.29e-01 | 0.0264 |
| 2120 | ETV6 | CCI_1 | Human | Cervix | CC | 2.72e-05 | 9.89e-01 | 0.528 |
| 2120 | ETV6 | CCI_2 | Human | Cervix | CC | 3.33e-15 | 1.86e+00 | 0.5249 |
| 2120 | ETV6 | CCI_3 | Human | Cervix | CC | 1.52e-24 | 2.30e+00 | 0.516 |
| 2120 | ETV6 | HTA11_347_2000001011 | Human | Colorectum | AD | 8.91e-13 | 6.01e-01 | -0.1954 |
| 2120 | ETV6 | HTA11_411_2000001011 | Human | Colorectum | SER | 6.70e-08 | 8.03e-01 | -0.2602 |
| 2120 | ETV6 | HTA11_866_2000001011 | Human | Colorectum | AD | 1.23e-06 | 4.86e-01 | -0.1001 |
| 2120 | ETV6 | HTA11_1391_2000001011 | Human | Colorectum | AD | 5.54e-03 | 4.12e-01 | -0.059 |
| 2120 | ETV6 | HTA11_99999965062_69753 | Human | Colorectum | MSI-H | 1.73e-24 | 1.72e+00 | 0.3487 |
| 2120 | ETV6 | HTA11_99999965104_69814 | Human | Colorectum | MSS | 1.80e-05 | 6.08e-01 | 0.281 |
| 2120 | ETV6 | HTA11_99999974143_84620 | Human | Colorectum | MSS | 1.06e-15 | -6.26e-01 | 0.3005 |
| 2120 | ETV6 | A015-C-203 | Human | Colorectum | FAP | 3.04e-28 | -5.14e-01 | -0.1294 |
| 2120 | ETV6 | A015-C-204 | Human | Colorectum | FAP | 2.77e-06 | -3.68e-01 | -0.0228 |
| 2120 | ETV6 | A014-C-040 | Human | Colorectum | FAP | 3.53e-04 | -3.21e-01 | -0.1184 |
| 2120 | ETV6 | A002-C-201 | Human | Colorectum | FAP | 2.34e-11 | -2.71e-01 | 0.0324 |
| 2120 | ETV6 | A001-C-119 | Human | Colorectum | FAP | 8.25e-09 | -4.89e-01 | -0.1557 |
| 2120 | ETV6 | A001-C-108 | Human | Colorectum | FAP | 3.61e-12 | -3.11e-01 | -0.0272 |
| 2120 | ETV6 | A002-C-205 | Human | Colorectum | FAP | 3.64e-28 | -5.85e-01 | -0.1236 |
| 2120 | ETV6 | A015-C-005 | Human | Colorectum | FAP | 3.38e-02 | -1.16e-01 | -0.0336 |
| 2120 | ETV6 | A015-C-006 | Human | Colorectum | FAP | 3.65e-20 | -6.04e-01 | -0.0994 |
| Page: 1 2 3 4 5 6 7 8 9 10 11 |
| Tissue | Expression Dynamics | Abbreviation |
| Cervix |  | CC: Cervix cancer |
| HSIL_HPV: HPV-infected high-grade squamous intraepithelial lesions | ||
| N_HPV: HPV-infected normal cervix | ||
| Colorectum (GSE201348) |  | FAP: Familial adenomatous polyposis |
| CRC: Colorectal cancer | ||
| Colorectum (HTA11) |  | AD: Adenomas |
| SER: Sessile serrated lesions | ||
| MSI-H: Microsatellite-high colorectal cancer | ||
| MSS: Microsatellite stable colorectal cancer | ||
| Endometrium | 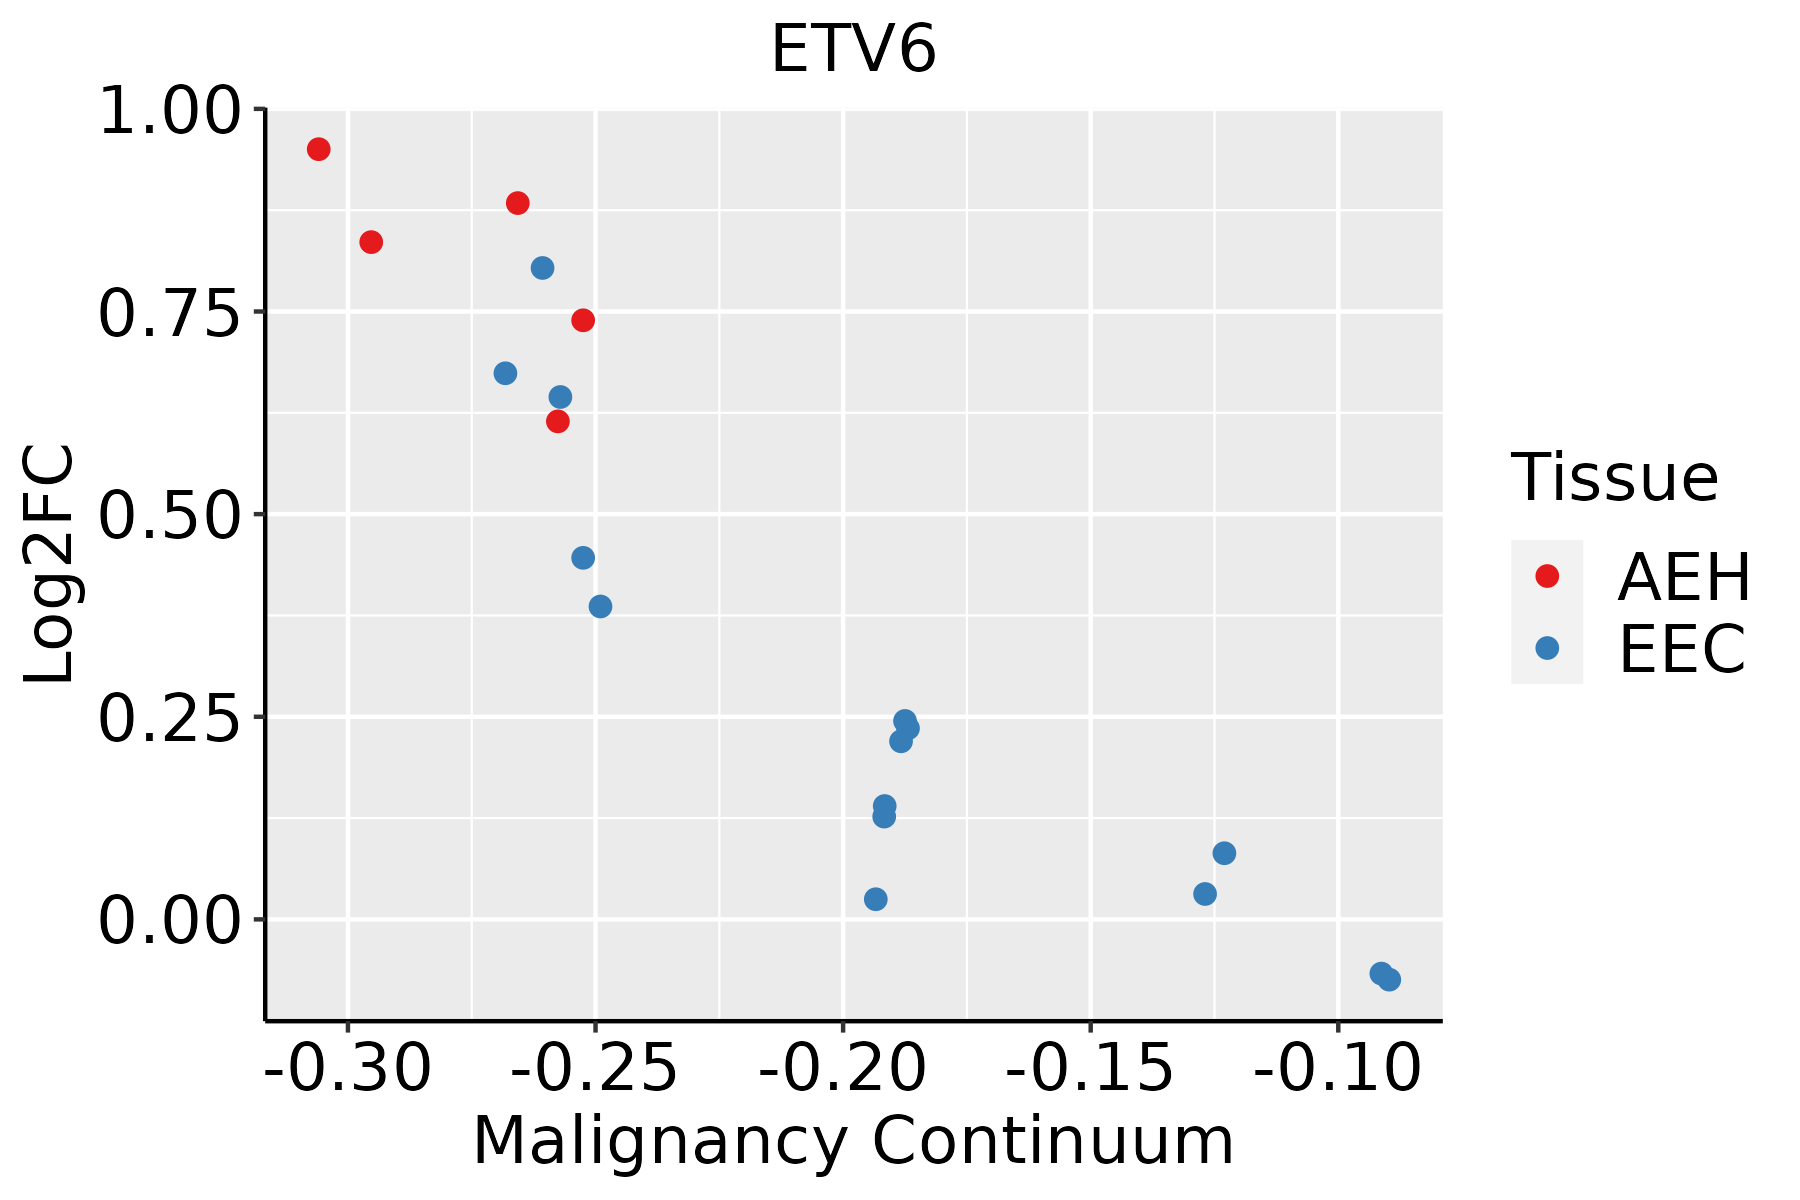 | AEH: Atypical endometrial hyperplasia |
| EEC: Endometrioid Cancer | ||
| Esophagus | 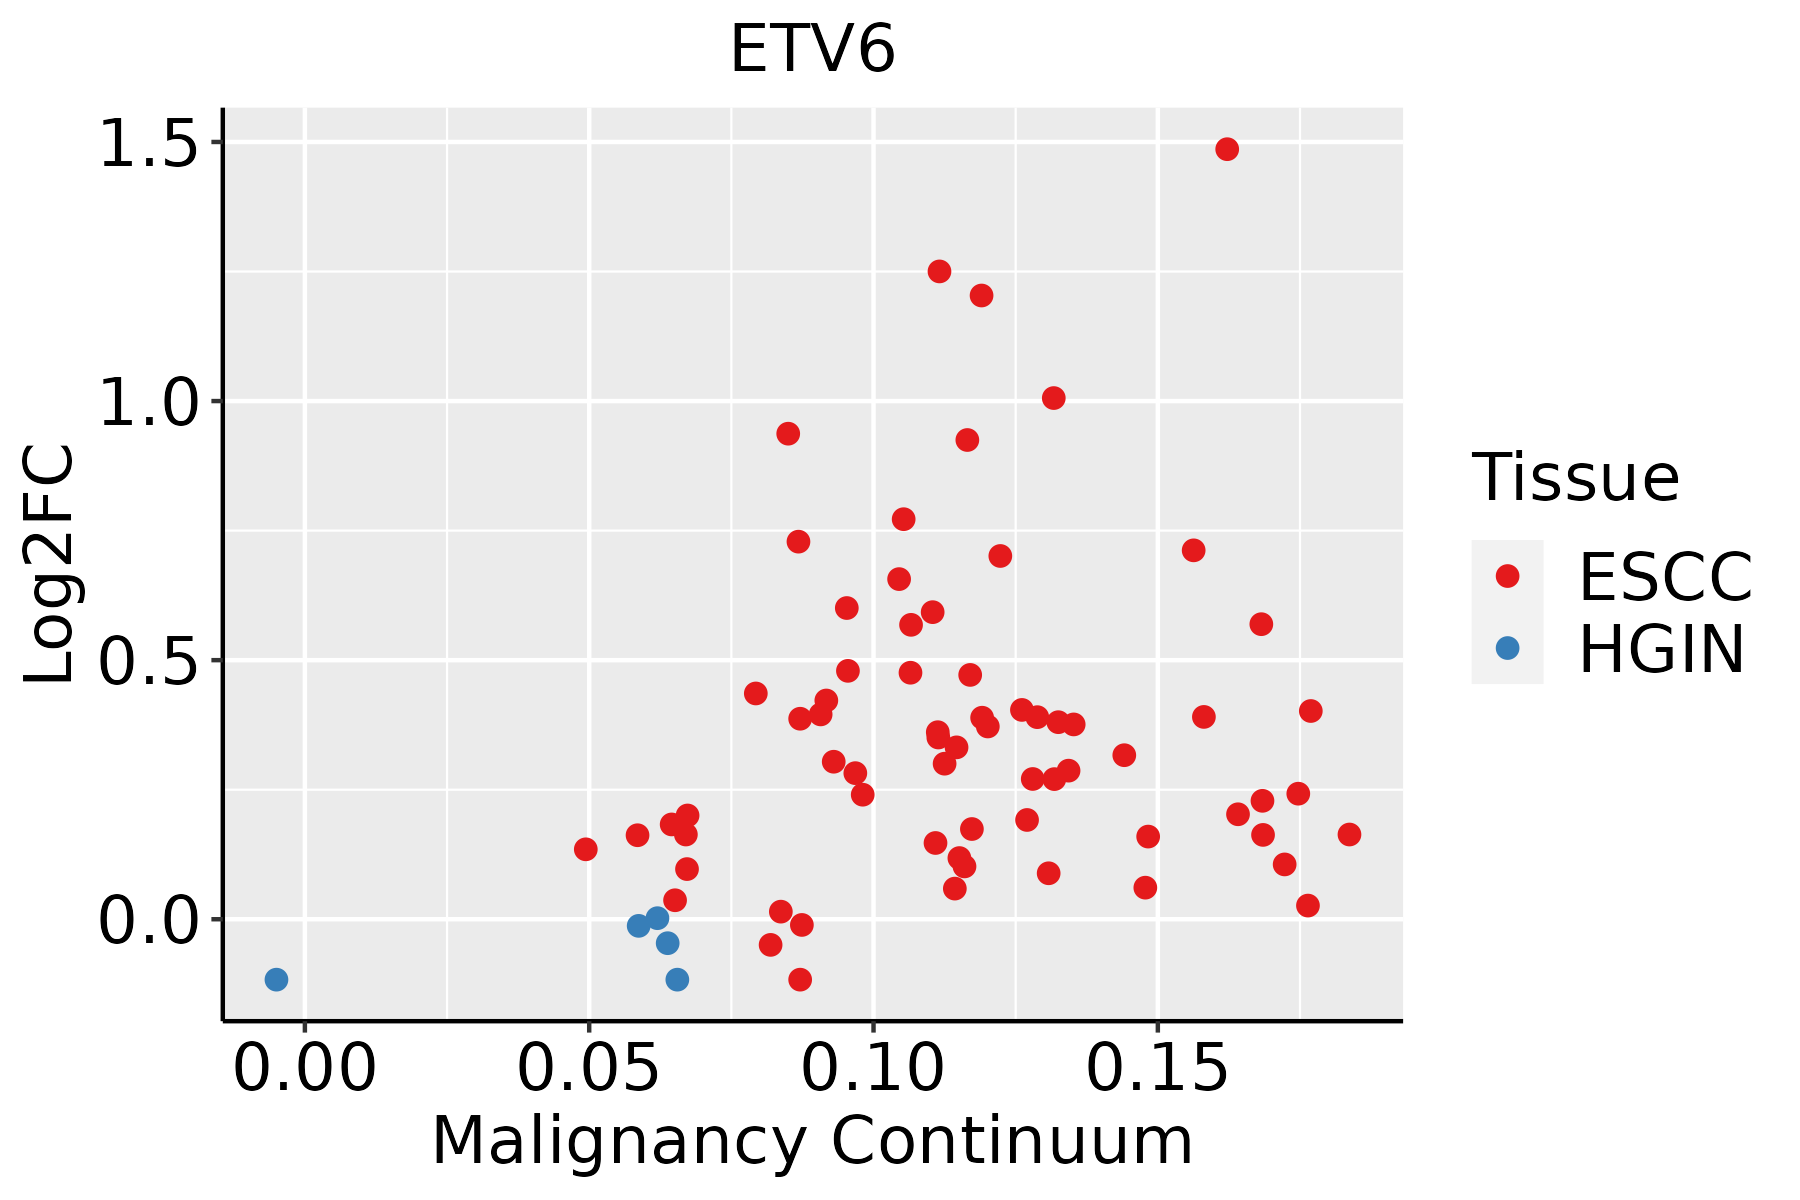 | ESCC: Esophageal squamous cell carcinoma |
| HGIN: High-grade intraepithelial neoplasias | ||
| LGIN: Low-grade intraepithelial neoplasias | ||
| GC | 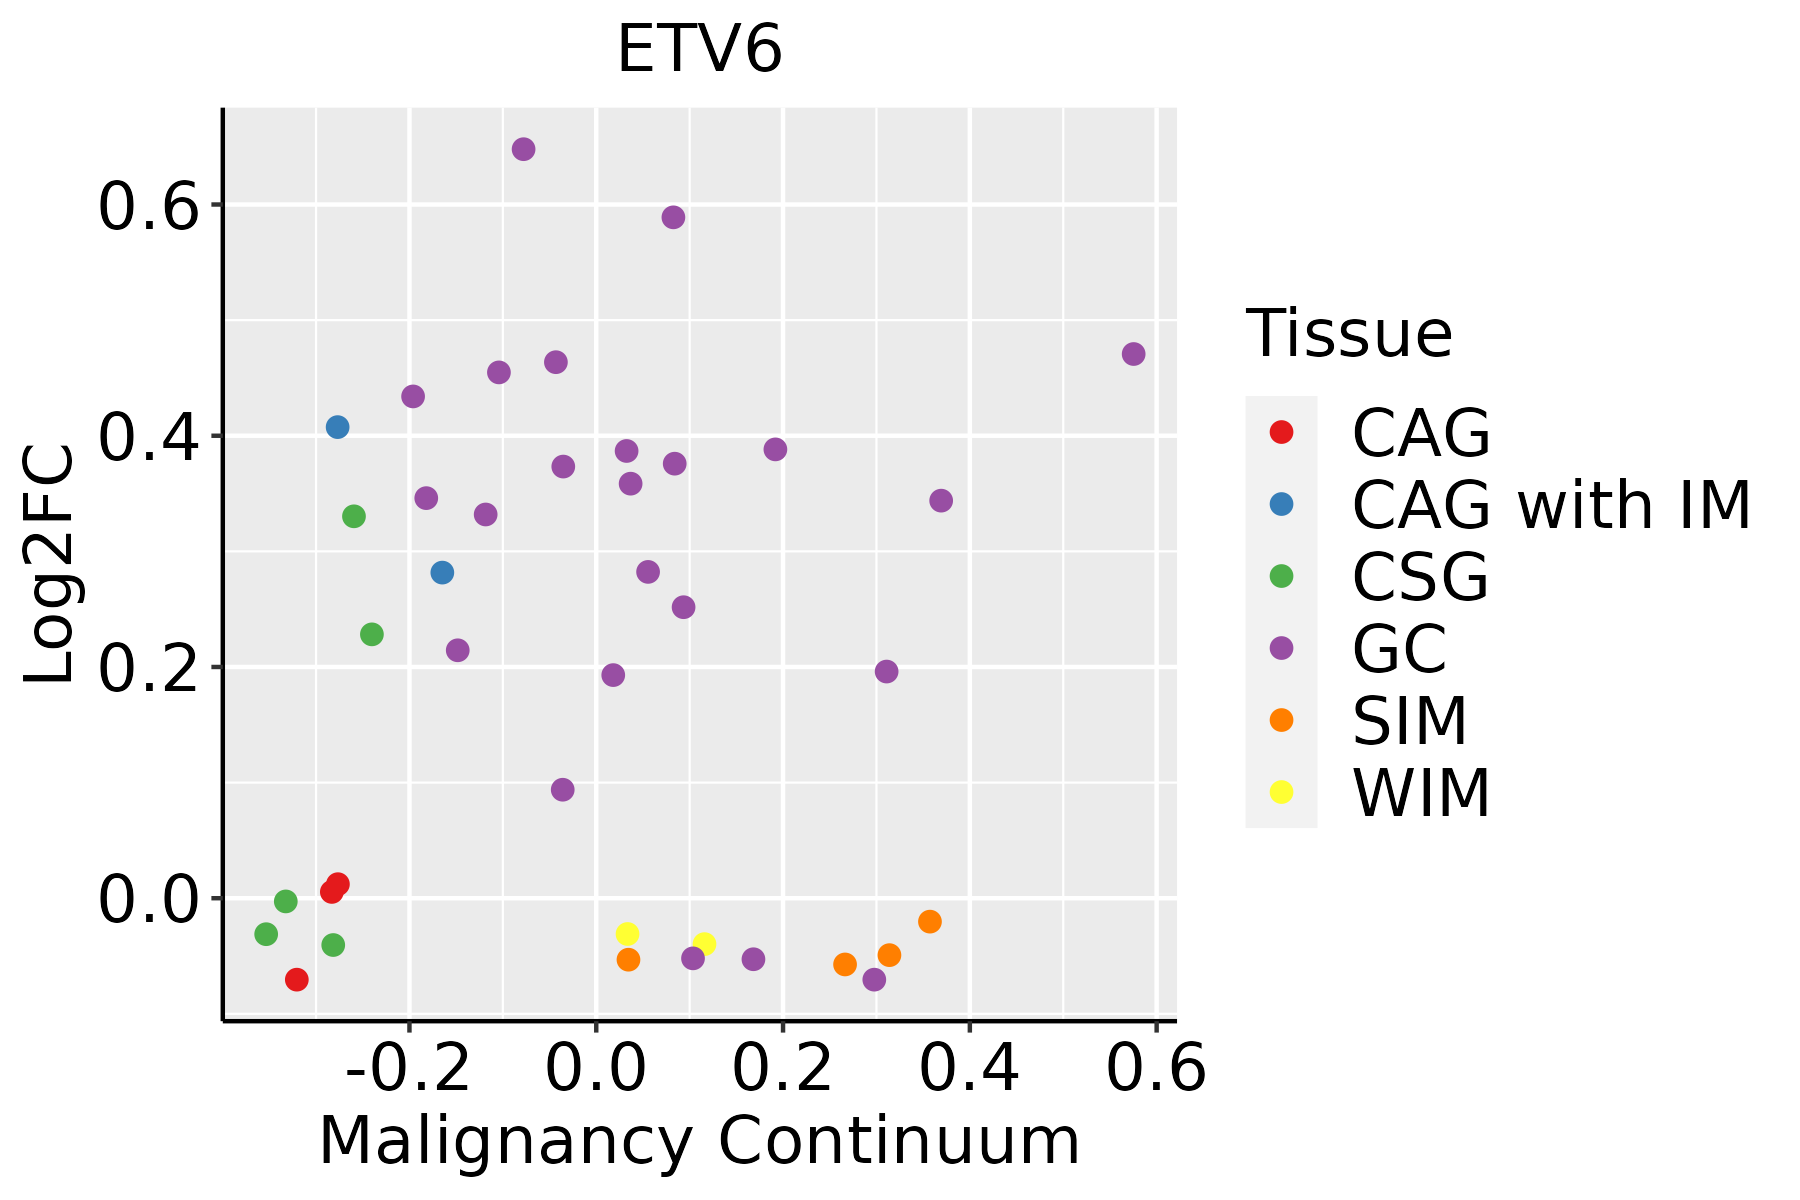 | CAG: Chronic atrophic gastritis |
| CAG with IM: Chronic atrophic gastritis with intestinal metaplasia | ||
| CSG: Chronic superficial gastritis | ||
| GC: Gastric cancer | ||
| SIM: Severe intestinal metaplasia | ||
| WIM: Wild intestinal metaplasia | ||
| Liver | 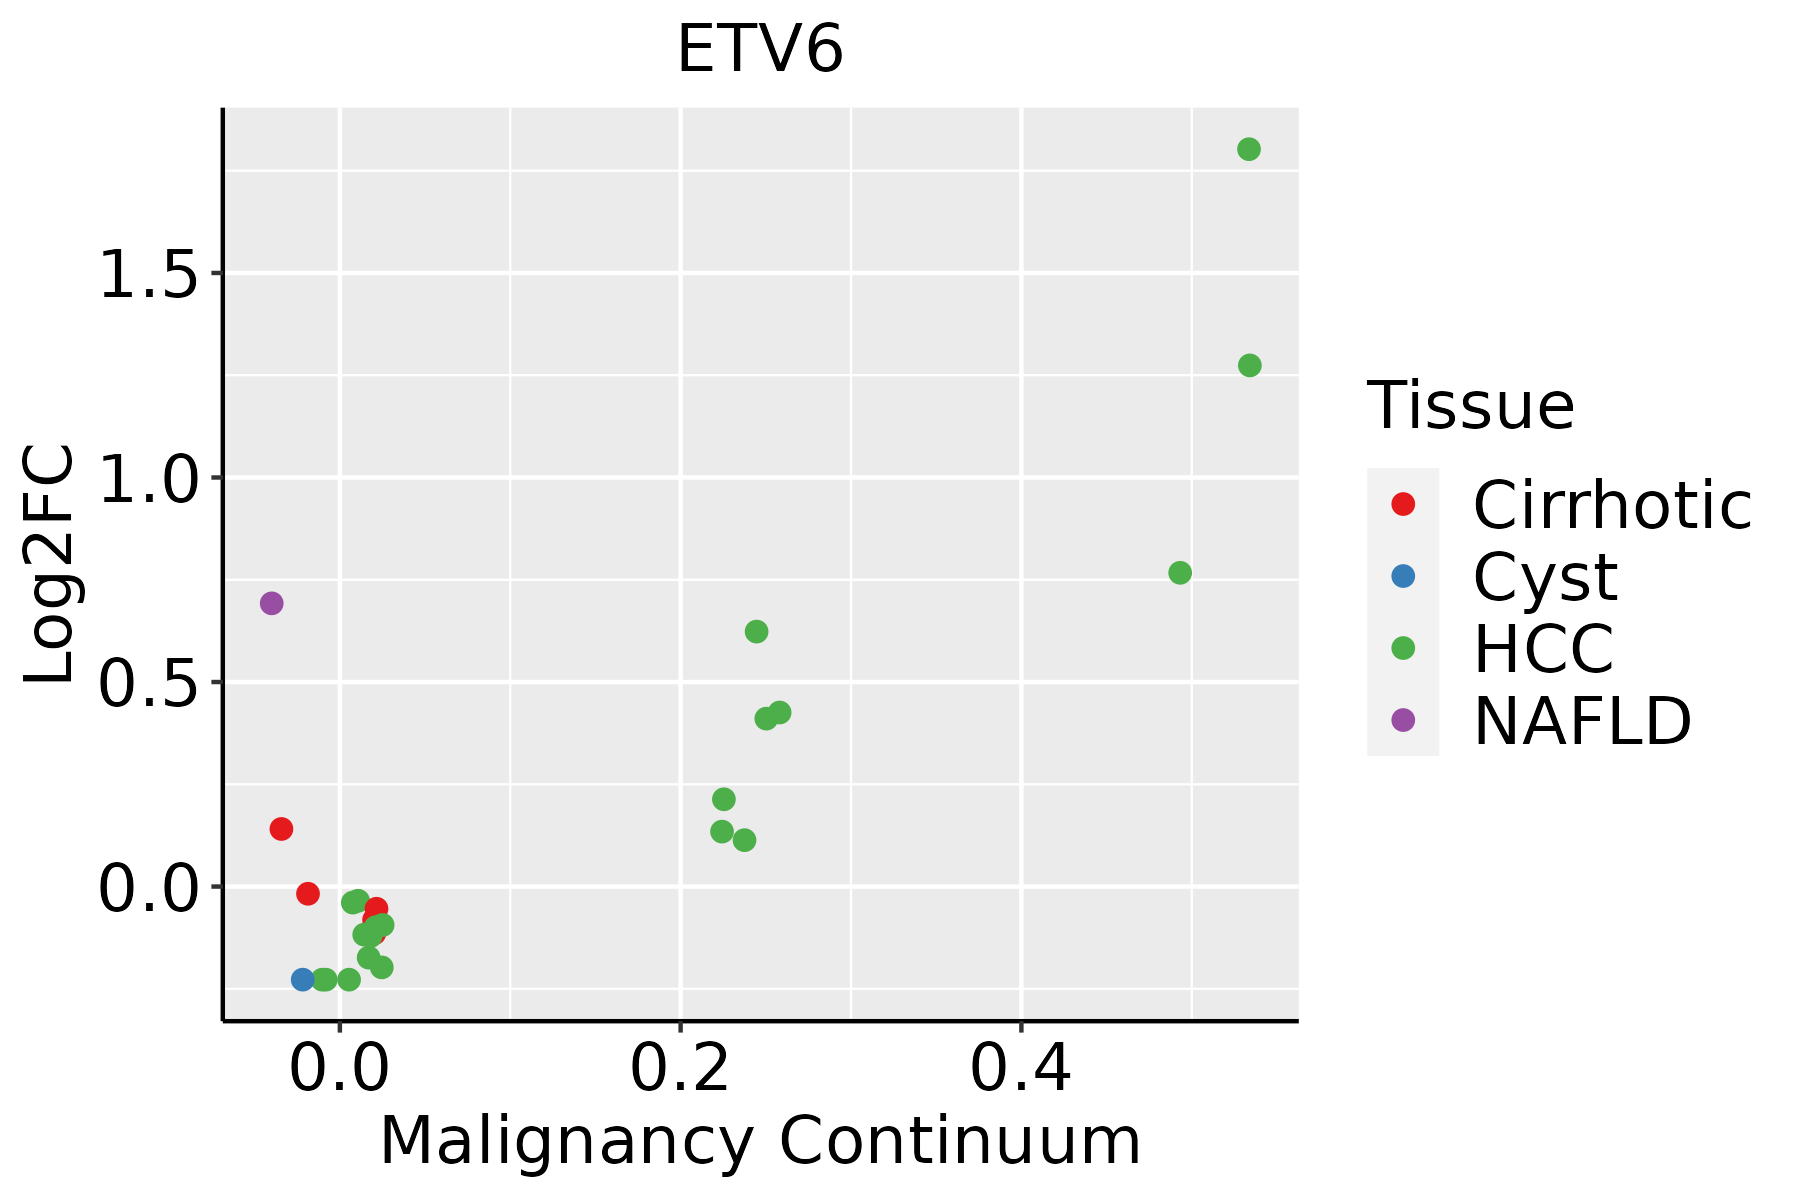 | HCC: Hepatocellular carcinoma |
| NAFLD: Non-alcoholic fatty liver disease | ||
| Lung |  | AAH: Atypical adenomatous hyperplasia |
| AIS: Adenocarcinoma in situ | ||
| IAC: Invasive lung adenocarcinoma | ||
| MIA: Minimally invasive adenocarcinoma | ||
| Oral Cavity | 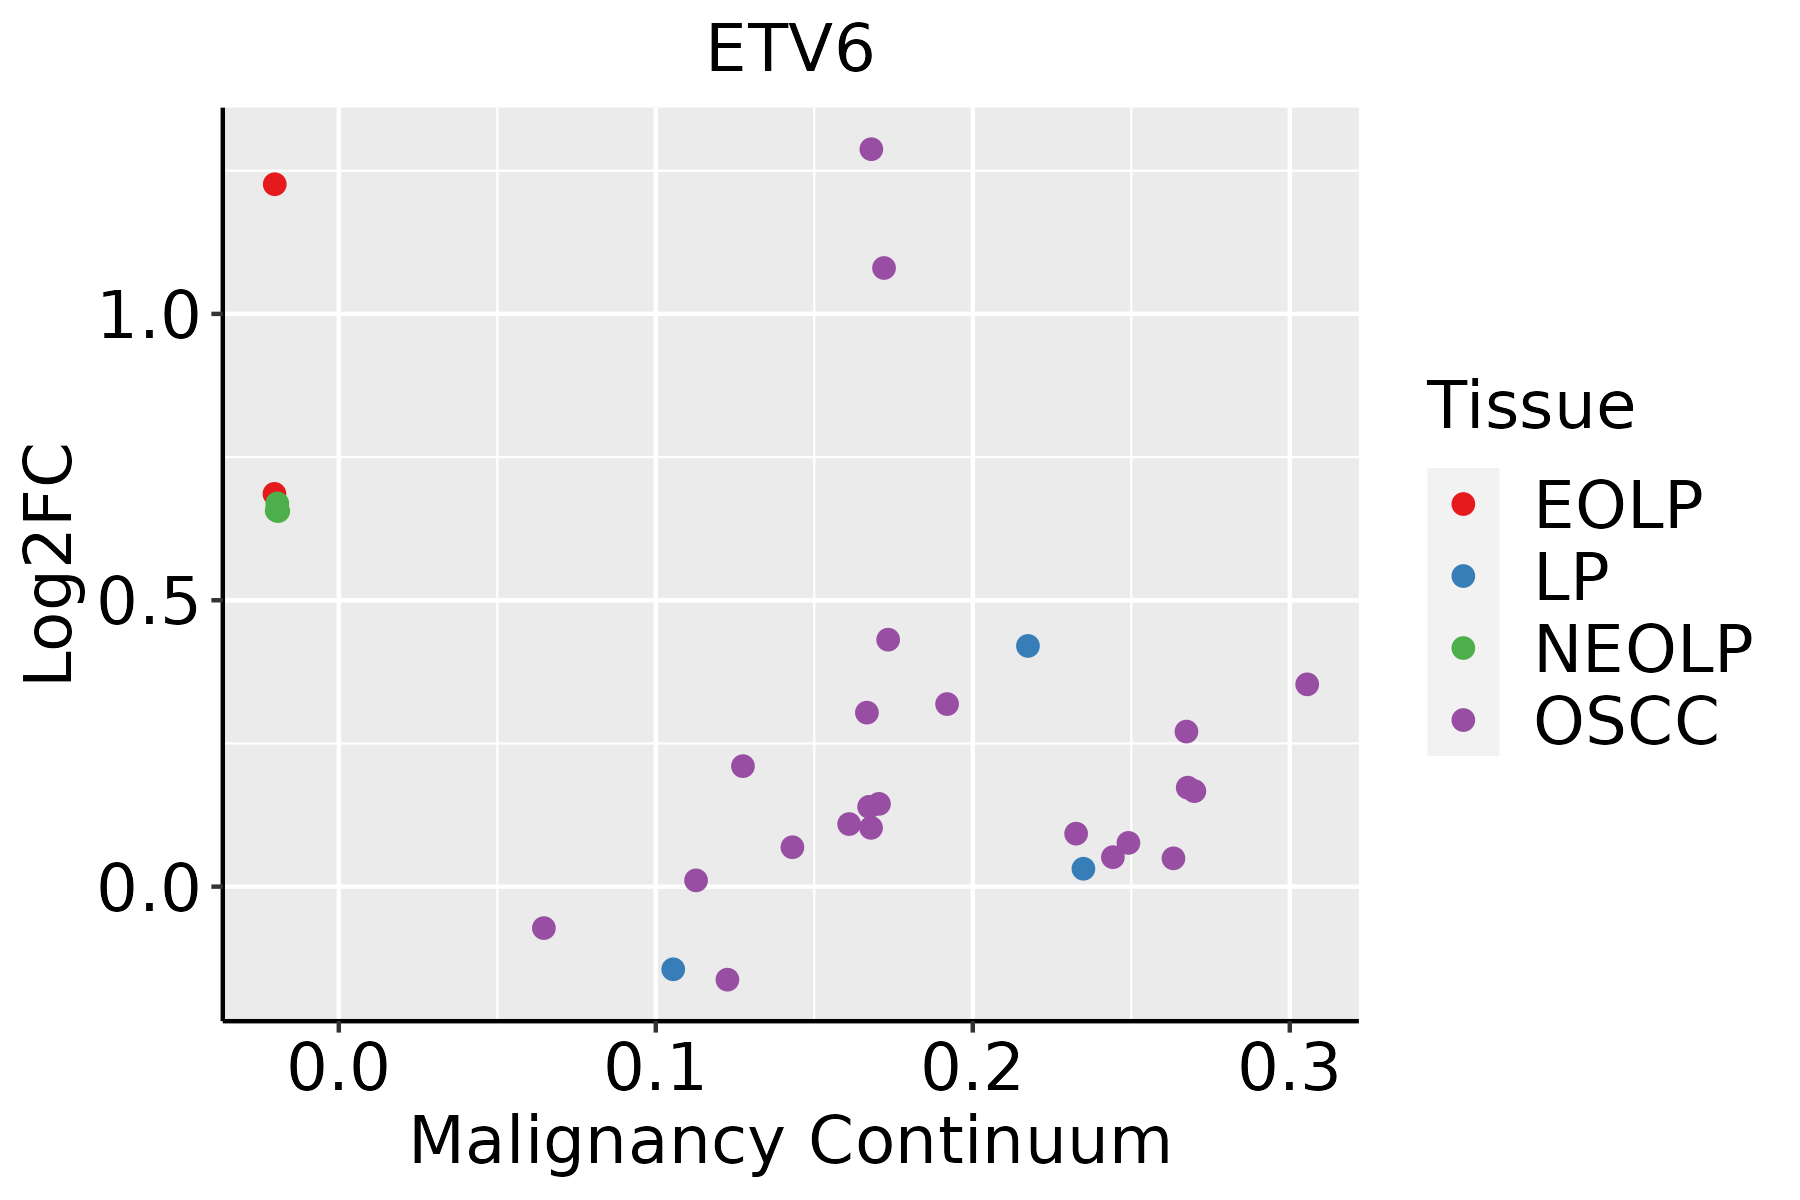 | EOLP: Erosive Oral lichen planus |
| LP: leukoplakia | ||
| NEOLP: Non-erosive oral lichen planus | ||
| OSCC: Oral squamous cell carcinoma | ||
| Prostate | 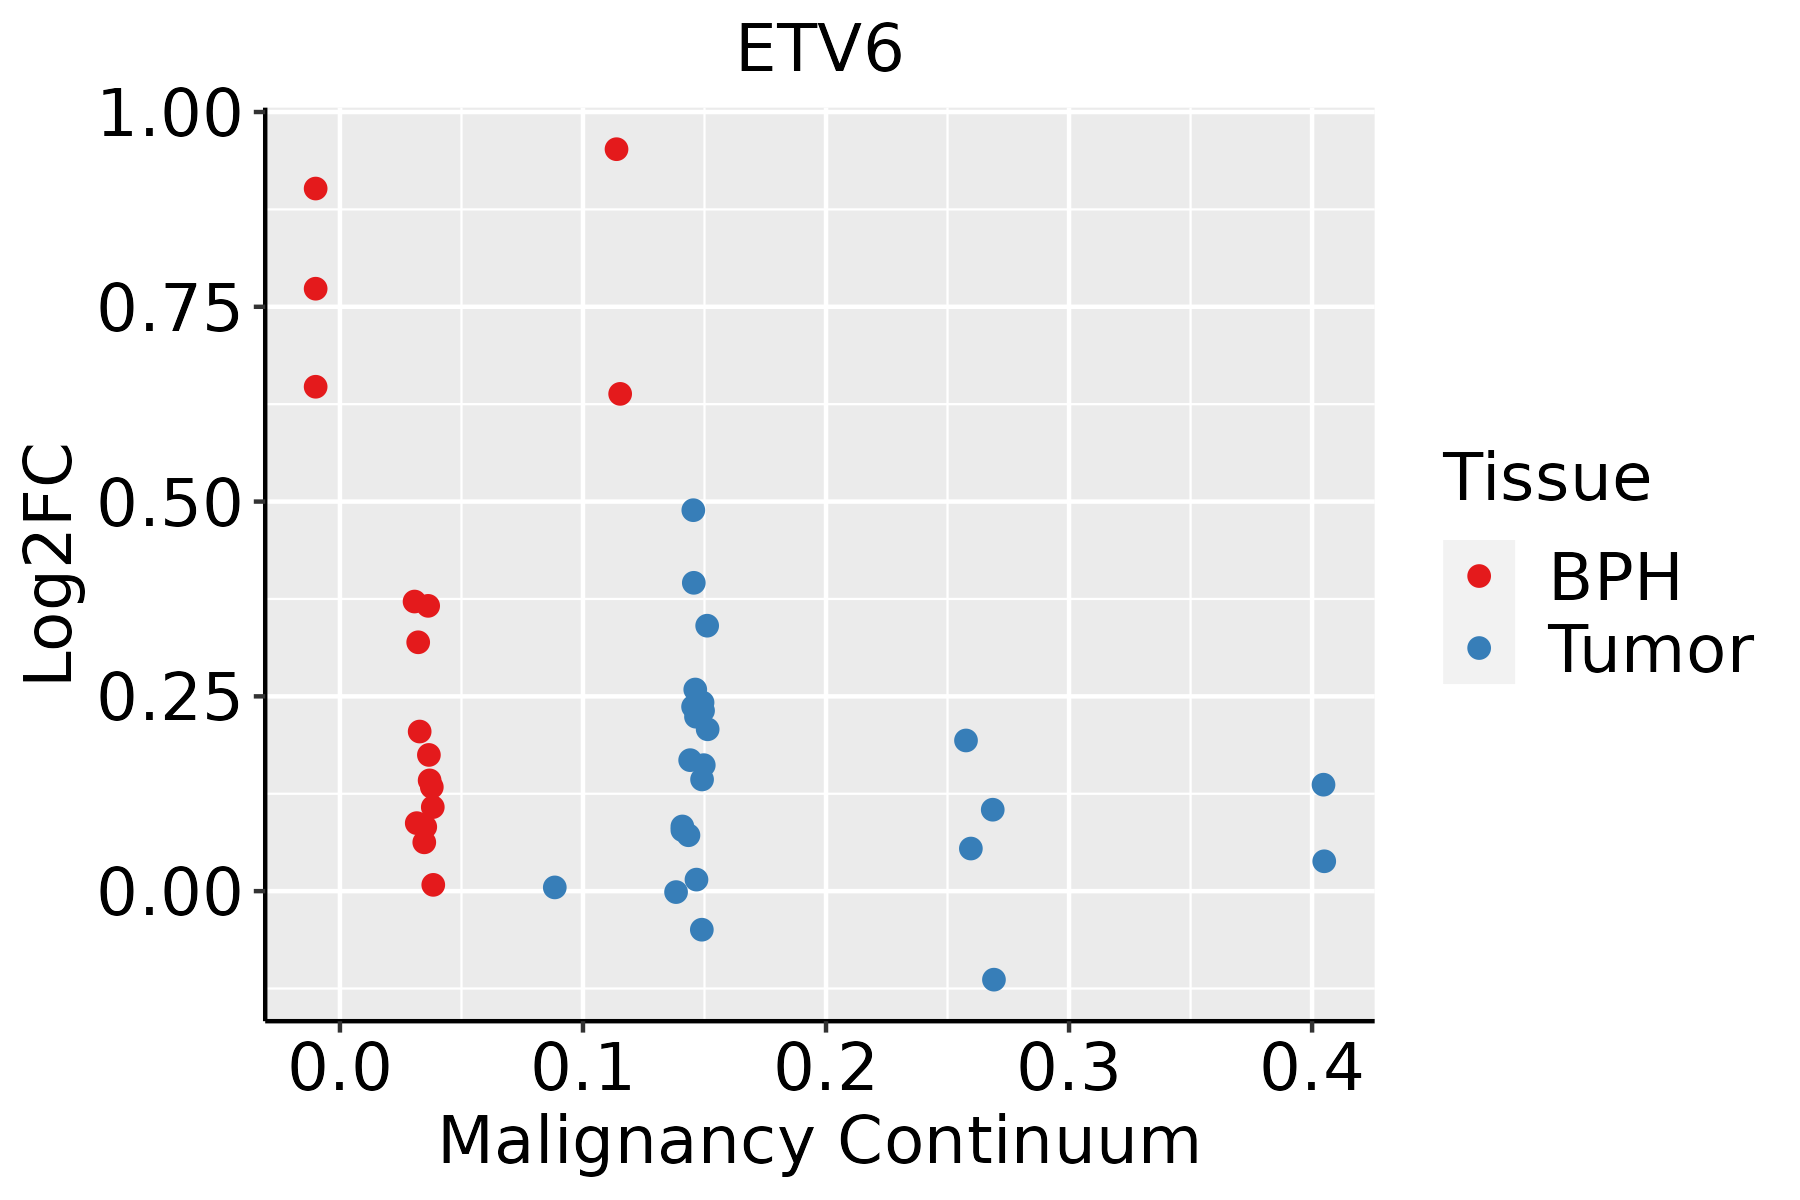 | BPH: Benign Prostatic Hyperplasia |
| Skin | 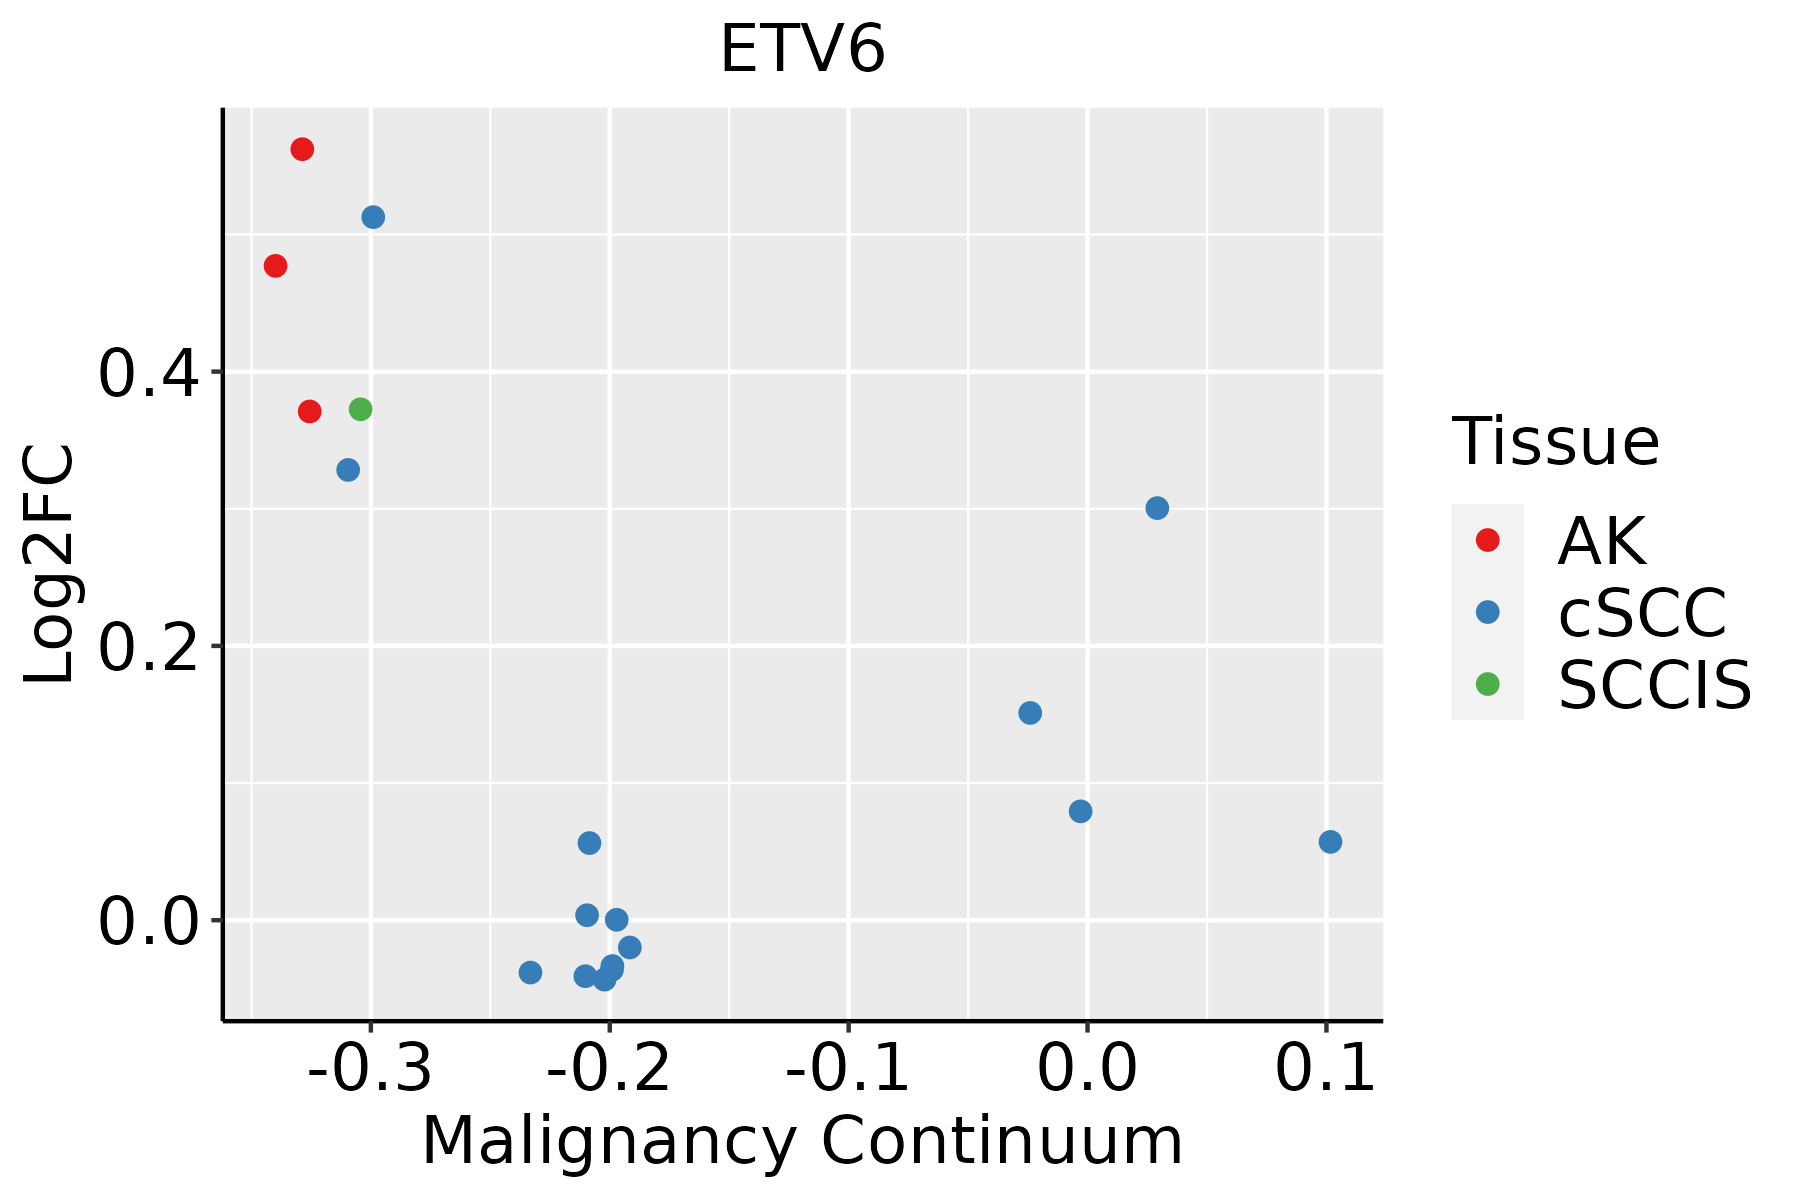 | AK: Actinic keratosis |
| cSCC: Cutaneous squamous cell carcinoma | ||
| SCCIS:squamous cell carcinoma in situ | ||
| Thyroid |  | ATC: Anaplastic thyroid cancer |
| HT: Hashimoto's thyroiditis | ||
| PTC: Papillary thyroid cancer |
| ∗log2FC in expression of this searched gene in stem-like cells from each diseased tissue sample relative to stem-like cells in normal samples in each tissue plotted against the malignancy continuum. Samples are colored based on if they are from different disease stage. |
Top |
Malignant transformation related pathway analysis |
| Find out the enriched GO biological processes and KEGG pathways involved in transition from healthy to precancer to cancer |
| Tissue | Disease Stage | Enriched GO biological Processes |
| Colorectum | AD |  |
| Colorectum | SER |  |
| Colorectum | MSS |  |
| Colorectum | MSI-H |  |
| Colorectum | FAP |  |
| ∗Top 15 enriched GO BP terms are showed in the bar plot of each disease state in each tissue. Each row represents a significant GO biological process which is colored according to the -log10(p.adjust). |
| Page: 1 2 3 4 5 6 7 8 9 |
| GO ID | Tissue | Disease Stage | Description | Gene Ratio | Bg Ratio | pvalue | p.adjust | Count |
| GO:0007028 | Colorectum | FAP | cytoplasm organization | 5/2622 | 10/18723 | 7.32e-03 | 4.38e-02 | 5 |
| GO:00070281 | Colorectum | CRC | cytoplasm organization | 5/2078 | 10/18723 | 2.61e-03 | 2.40e-02 | 5 |
| GO:00070282 | Skin | AK | cytoplasm organization | 5/1910 | 10/18723 | 1.78e-03 | 1.24e-02 | 5 |
| Page: 1 |
| Pathway ID | Tissue | Disease Stage | Description | Gene Ratio | Bg Ratio | pvalue | p.adjust | qvalue | Count |
| hsa05202 | Colorectum | FAP | Transcriptional misregulation in cancer | 45/1404 | 193/8465 | 9.19e-03 | 3.33e-02 | 2.03e-02 | 45 |
| hsa052021 | Colorectum | FAP | Transcriptional misregulation in cancer | 45/1404 | 193/8465 | 9.19e-03 | 3.33e-02 | 2.03e-02 | 45 |
| hsa052028 | Esophagus | ESCC | Transcriptional misregulation in cancer | 116/4205 | 193/8465 | 2.08e-03 | 5.95e-03 | 3.05e-03 | 116 |
| hsa0520213 | Esophagus | ESCC | Transcriptional misregulation in cancer | 116/4205 | 193/8465 | 2.08e-03 | 5.95e-03 | 3.05e-03 | 116 |
| hsa052026 | Lung | IAC | Transcriptional misregulation in cancer | 40/1053 | 193/8465 | 6.90e-04 | 5.90e-03 | 3.92e-03 | 40 |
| hsa0520211 | Lung | IAC | Transcriptional misregulation in cancer | 40/1053 | 193/8465 | 6.90e-04 | 5.90e-03 | 3.92e-03 | 40 |
| hsa052022 | Lung | AIS | Transcriptional misregulation in cancer | 39/961 | 193/8465 | 2.15e-04 | 2.41e-03 | 1.54e-03 | 39 |
| hsa052023 | Lung | AIS | Transcriptional misregulation in cancer | 39/961 | 193/8465 | 2.15e-04 | 2.41e-03 | 1.54e-03 | 39 |
| hsa052027 | Prostate | BPH | Transcriptional misregulation in cancer | 53/1718 | 193/8465 | 9.56e-03 | 2.92e-02 | 1.81e-02 | 53 |
| hsa0520212 | Prostate | BPH | Transcriptional misregulation in cancer | 53/1718 | 193/8465 | 9.56e-03 | 2.92e-02 | 1.81e-02 | 53 |
| hsa0520221 | Prostate | Tumor | Transcriptional misregulation in cancer | 59/1791 | 193/8465 | 1.22e-03 | 5.26e-03 | 3.26e-03 | 59 |
| hsa0520231 | Prostate | Tumor | Transcriptional misregulation in cancer | 59/1791 | 193/8465 | 1.22e-03 | 5.26e-03 | 3.26e-03 | 59 |
| Page: 1 |
Top |
Cell-cell communication analysis |
| Identification of potential cell-cell interactions between two cell types and their ligand-receptor pairs for different disease states |
| Ligand | Receptor | LRpair | Pathway | Tissue | Disease Stage |
| Page: 1 |
Top |
Single-cell gene regulatory network inference analysis |
| Find out the significant the regulons (TFs) and the target genes of each regulon across cell types for different disease states |
| TF | Cell Type | Tissue | Disease Stage | Target Gene | RSS | Regulon Activity |
| ETV6 | MLUM | Breast | ADJ | ELF5,PDLIM5,NCOA7, etc. | 3.28e-01 |  |
| ETV6 | MLUM | Breast | Precancer | ELF5,PDLIM5,NCOA7, etc. | 3.30e-01 |  |
| ETV6 | KER | Cervix | Healthy | UXS1,ENOPH1,LRRC8D, etc. | 2.61e-01 |  |
| ∗The dot plots of a searched regulon are shown for all cell subpopulations in each disease state of each tissue based on the regulon specific score inferred using pySCENIC and by calculating the average expression. |
| Page: 1 |
Top |
Somatic mutation of malignant transformation related genes |
| Annotation of somatic variants for genes involved in malignant transformation |
| Hugo Symbol | Variant Class | Variant Classification | dbSNP RS | HGVSc | HGVSp | HGVSp Short | SWISSPROT | BIOTYPE | SIFT | PolyPhen | Tumor Sample Barcode | Tissue | Histology | Sex | Age | Stage | Therapy Types | Drugs | Outcome |
| ETV6 | SNV | Missense_Mutation | c.58N>T | p.Pro20Ser | p.P20S | P41212 | protein_coding | tolerated(0.97) | benign(0.001) | TCGA-A2-A0CX-01 | Breast | breast invasive carcinoma | Female | <65 | I/II | Chemotherapy | adriamycin | SD | |
| ETV6 | SNV | Missense_Mutation | novel | c.1133N>C | p.Arg378Pro | p.R378P | P41212 | protein_coding | deleterious(0) | probably_damaging(0.998) | TCGA-A2-A0T0-01 | Breast | breast invasive carcinoma | Female | <65 | I/II | Chemotherapy | taxotere | SD |
| ETV6 | SNV | Missense_Mutation | c.319C>T | p.Pro107Ser | p.P107S | P41212 | protein_coding | tolerated(0.07) | probably_damaging(0.982) | TCGA-A8-A076-01 | Breast | breast invasive carcinoma | Female | >=65 | I/II | Hormone Therapy | anastrozole | SD | |
| ETV6 | SNV | Missense_Mutation | novel | c.1144N>G | p.Asn382Asp | p.N382D | P41212 | protein_coding | deleterious(0.01) | probably_damaging(0.991) | TCGA-BH-A18G-01 | Breast | breast invasive carcinoma | Female | >=65 | I/II | Unknown | Unknown | SD |
| ETV6 | SNV | Missense_Mutation | c.641N>A | p.Pro214Gln | p.P214Q | P41212 | protein_coding | tolerated(0.15) | possibly_damaging(0.579) | TCGA-EW-A6S9-01 | Breast | breast invasive carcinoma | Female | <65 | I/II | Unknown | Unknown | SD | |
| ETV6 | SNV | Missense_Mutation | c.1049N>T | p.Ser350Phe | p.S350F | P41212 | protein_coding | deleterious(0) | probably_damaging(0.985) | TCGA-GM-A2D9-01 | Breast | breast invasive carcinoma | Female | >=65 | I/II | Hormone Therapy | arimidex | SD | |
| ETV6 | SNV | Missense_Mutation | c.1114N>C | p.Asp372His | p.D372H | P41212 | protein_coding | deleterious(0) | probably_damaging(0.999) | TCGA-C5-A7UC-01 | Cervix | cervical & endocervical cancer | Female | <65 | I/II | Unknown | Unknown | SD | |
| ETV6 | SNV | Missense_Mutation | c.136N>C | p.Asp46His | p.D46H | P41212 | protein_coding | deleterious(0.01) | possibly_damaging(0.601) | TCGA-IR-A3LA-01 | Cervix | cervical & endocervical cancer | Female | <65 | I/II | Chemotherapy | cisplatin | CR | |
| ETV6 | SNV | Missense_Mutation | c.1105C>T | p.Arg369Trp | p.R369W | P41212 | protein_coding | deleterious(0) | probably_damaging(1) | TCGA-AA-3845-01 | Colorectum | colon adenocarcinoma | Female | >=65 | I/II | Unknown | Unknown | PD | |
| ETV6 | SNV | Missense_Mutation | rs745867456 | c.790N>T | p.Arg264Cys | p.R264C | P41212 | protein_coding | deleterious(0) | probably_damaging(0.927) | TCGA-AA-3966-01 | Colorectum | colon adenocarcinoma | Female | >=65 | I/II | Unknown | Unknown | SD |
| Page: 1 2 3 4 5 6 7 |
Top |
Related drugs of malignant transformation related genes |
| Identification of chemicals and drugs interact with genes involved in malignant transfromation |
| (DGIdb 4.0) |
| Entrez ID | Symbol | Category | Interaction Types | Drug Claim Name | Drug Name | PMIDs |
| 2120 | ETV6 | TRANSCRIPTION FACTOR, CLINICALLY ACTIONABLE | AZD4547 | 27401245 | ||
| 2120 | ETV6 | TRANSCRIPTION FACTOR, CLINICALLY ACTIONABLE | Lestaurtinib | LESTAURTINIB | 16258068 | |
| 2120 | ETV6 | TRANSCRIPTION FACTOR, CLINICALLY ACTIONABLE | N/A | 26711002,10086740,26102509,26606880,9462753,26522332,21714648,26769228,25807284,8609706,21877899,11432885,24517889,15704129 | ||
| 2120 | ETV6 | TRANSCRIPTION FACTOR, CLINICALLY ACTIONABLE | Crizotinib | CRIZOTINIB | 23811600 | |
| 2120 | ETV6 | TRANSCRIPTION FACTOR, CLINICALLY ACTIONABLE | Pyridone 6 | 22916261 | ||
| 2120 | ETV6 | TRANSCRIPTION FACTOR, CLINICALLY ACTIONABLE | BMS-754807 | BMS-754807 | 21148487 | |
| 2120 | ETV6 | TRANSCRIPTION FACTOR, CLINICALLY ACTIONABLE | LOXO-101 | LAROTRECTINIB | 28578312,26216294,27093299 | |
| 2120 | ETV6 | TRANSCRIPTION FACTOR, CLINICALLY ACTIONABLE | Entrectinib | ENTRECTINIB | 26884591,26939704 | |
| 2120 | ETV6 | TRANSCRIPTION FACTOR, CLINICALLY ACTIONABLE | BMS-536924 | CHEMBL401930 | 21804605 | |
| 2120 | ETV6 | TRANSCRIPTION FACTOR, CLINICALLY ACTIONABLE | HMPL-523 | HMPL-523 |
| Page: 1 2 |

Copyright 2023-Present -The University of Texas Health Science Center at Houston |