
|
|||||
|
 | |
| |
| |
| |
| |
| |
|
Gene: ETV5 |
Gene summary for ETV5 |
| Gene information | Species | Human | Gene symbol | ETV5 | Gene ID | 2119 |
| Gene name | ETS variant transcription factor 5 | |
| Gene Alias | ERM | |
| Cytomap | 3q27.2 | |
| Gene Type | protein-coding | GO ID | GO:0000003 | UniProtAcc | P41161 |
Top |
Malignant transformation analysis |
| Identification of the aberrant gene expression in precancerous and cancerous lesions by comparing the gene expression of stem-like cells in diseased tissues with normal stem cells |
| Entrez ID | Symbol | Replicates | Species | Organ | Tissue | Adj P-value | Log2FC | Malignancy |
| 2119 | ETV5 | LZE4T | Human | Esophagus | ESCC | 2.70e-12 | 4.91e-01 | 0.0811 |
| 2119 | ETV5 | LZE7T | Human | Esophagus | ESCC | 1.61e-07 | 4.81e-01 | 0.0667 |
| 2119 | ETV5 | LZE21T | Human | Esophagus | ESCC | 3.56e-05 | 5.82e-01 | 0.0655 |
| 2119 | ETV5 | P2T-E | Human | Esophagus | ESCC | 2.05e-114 | 2.11e+00 | 0.1177 |
| 2119 | ETV5 | P4T-E | Human | Esophagus | ESCC | 3.90e-17 | 5.85e-01 | 0.1323 |
| 2119 | ETV5 | P5T-E | Human | Esophagus | ESCC | 3.99e-06 | 1.42e-01 | 0.1327 |
| 2119 | ETV5 | P8T-E | Human | Esophagus | ESCC | 1.38e-12 | 2.62e-01 | 0.0889 |
| 2119 | ETV5 | P9T-E | Human | Esophagus | ESCC | 1.00e-09 | 2.87e-01 | 0.1131 |
| 2119 | ETV5 | P10T-E | Human | Esophagus | ESCC | 1.75e-69 | 1.38e+00 | 0.116 |
| 2119 | ETV5 | P11T-E | Human | Esophagus | ESCC | 1.96e-10 | 4.63e-01 | 0.1426 |
| 2119 | ETV5 | P12T-E | Human | Esophagus | ESCC | 3.38e-12 | 4.00e-01 | 0.1122 |
| 2119 | ETV5 | P15T-E | Human | Esophagus | ESCC | 2.61e-41 | 1.06e+00 | 0.1149 |
| 2119 | ETV5 | P16T-E | Human | Esophagus | ESCC | 1.53e-89 | 1.49e+00 | 0.1153 |
| 2119 | ETV5 | P19T-E | Human | Esophagus | ESCC | 4.94e-03 | 4.79e-01 | 0.1662 |
| 2119 | ETV5 | P20T-E | Human | Esophagus | ESCC | 6.12e-06 | 2.40e-01 | 0.1124 |
| 2119 | ETV5 | P21T-E | Human | Esophagus | ESCC | 1.76e-24 | 4.18e-01 | 0.1617 |
| 2119 | ETV5 | P22T-E | Human | Esophagus | ESCC | 2.24e-42 | 9.16e-01 | 0.1236 |
| 2119 | ETV5 | P23T-E | Human | Esophagus | ESCC | 7.85e-13 | 3.79e-01 | 0.108 |
| 2119 | ETV5 | P24T-E | Human | Esophagus | ESCC | 1.06e-09 | 3.13e-01 | 0.1287 |
| 2119 | ETV5 | P26T-E | Human | Esophagus | ESCC | 1.03e-60 | 1.12e+00 | 0.1276 |
| Page: 1 2 3 4 5 |
| Tissue | Expression Dynamics | Abbreviation |
| Esophagus | 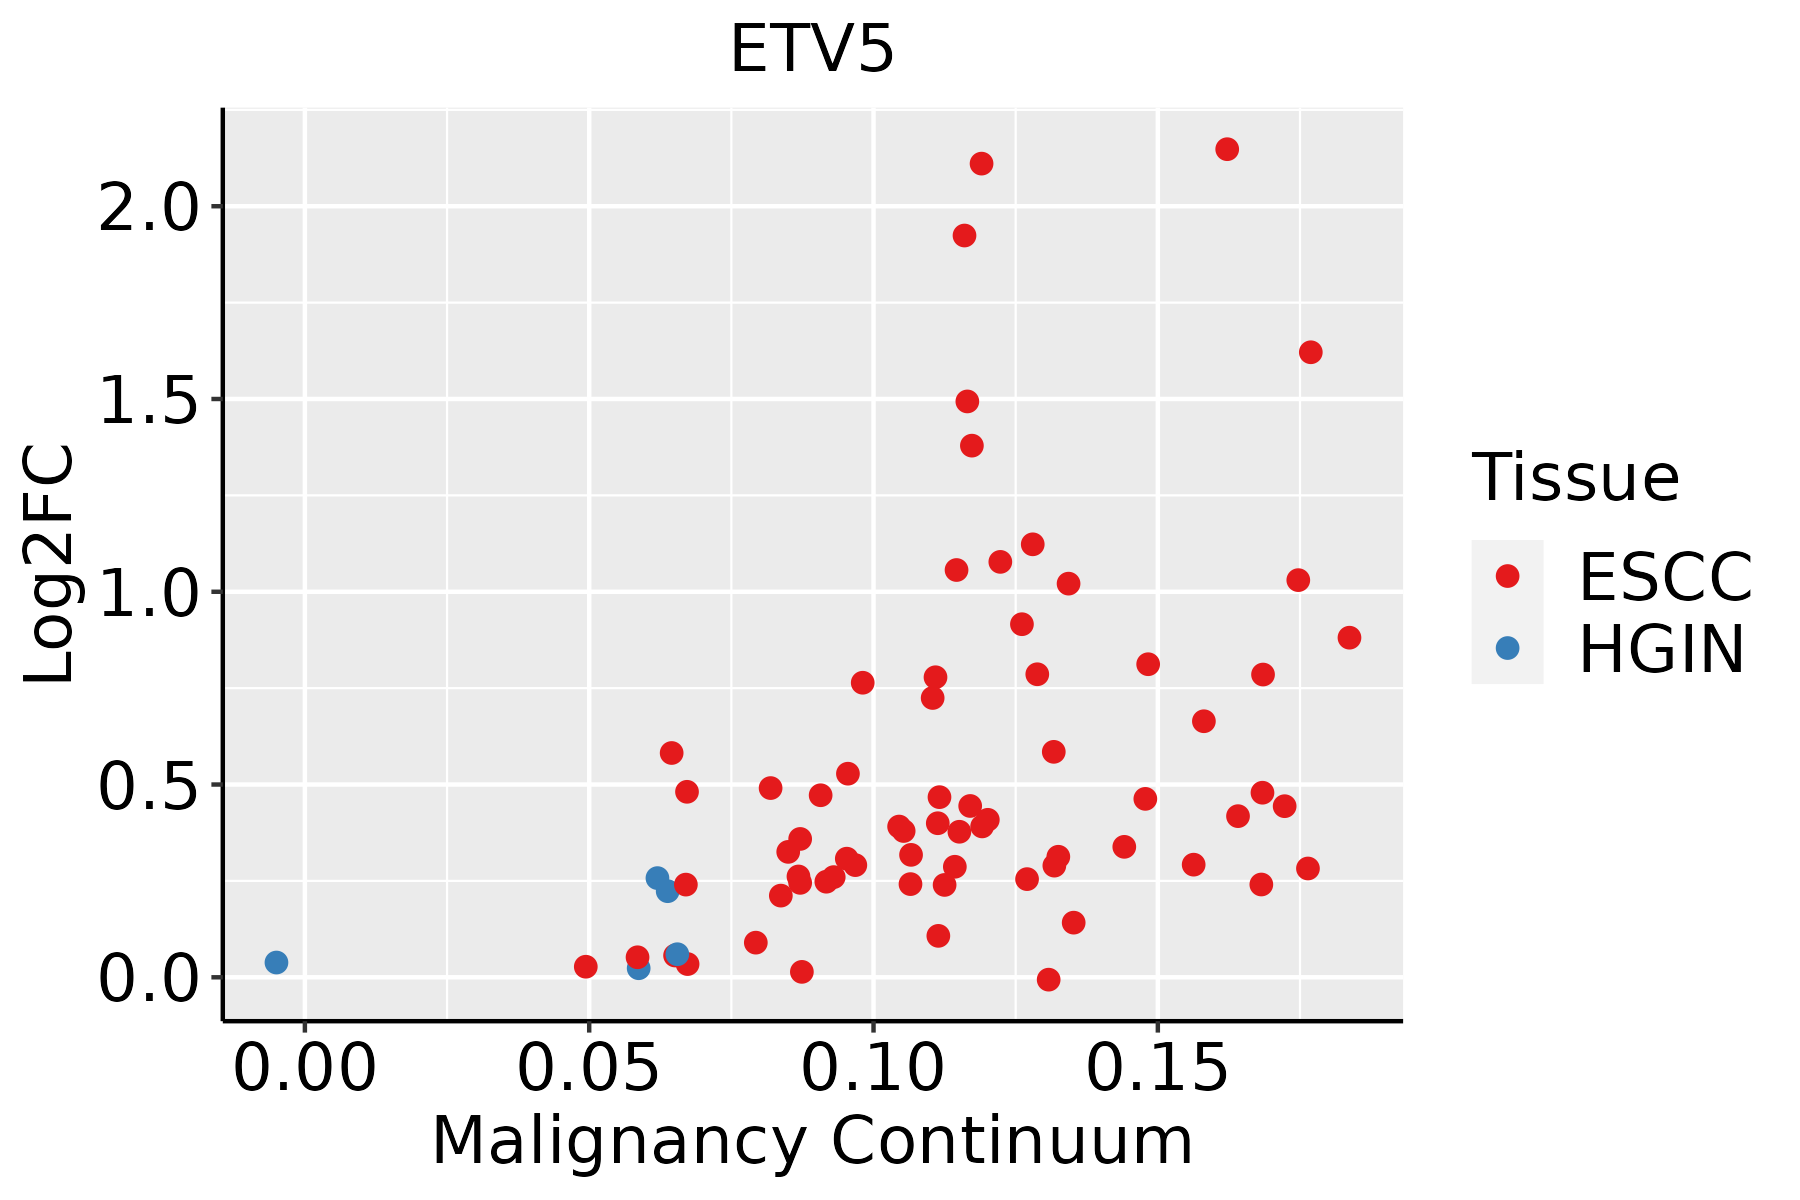 | ESCC: Esophageal squamous cell carcinoma |
| HGIN: High-grade intraepithelial neoplasias | ||
| LGIN: Low-grade intraepithelial neoplasias | ||
| Liver | 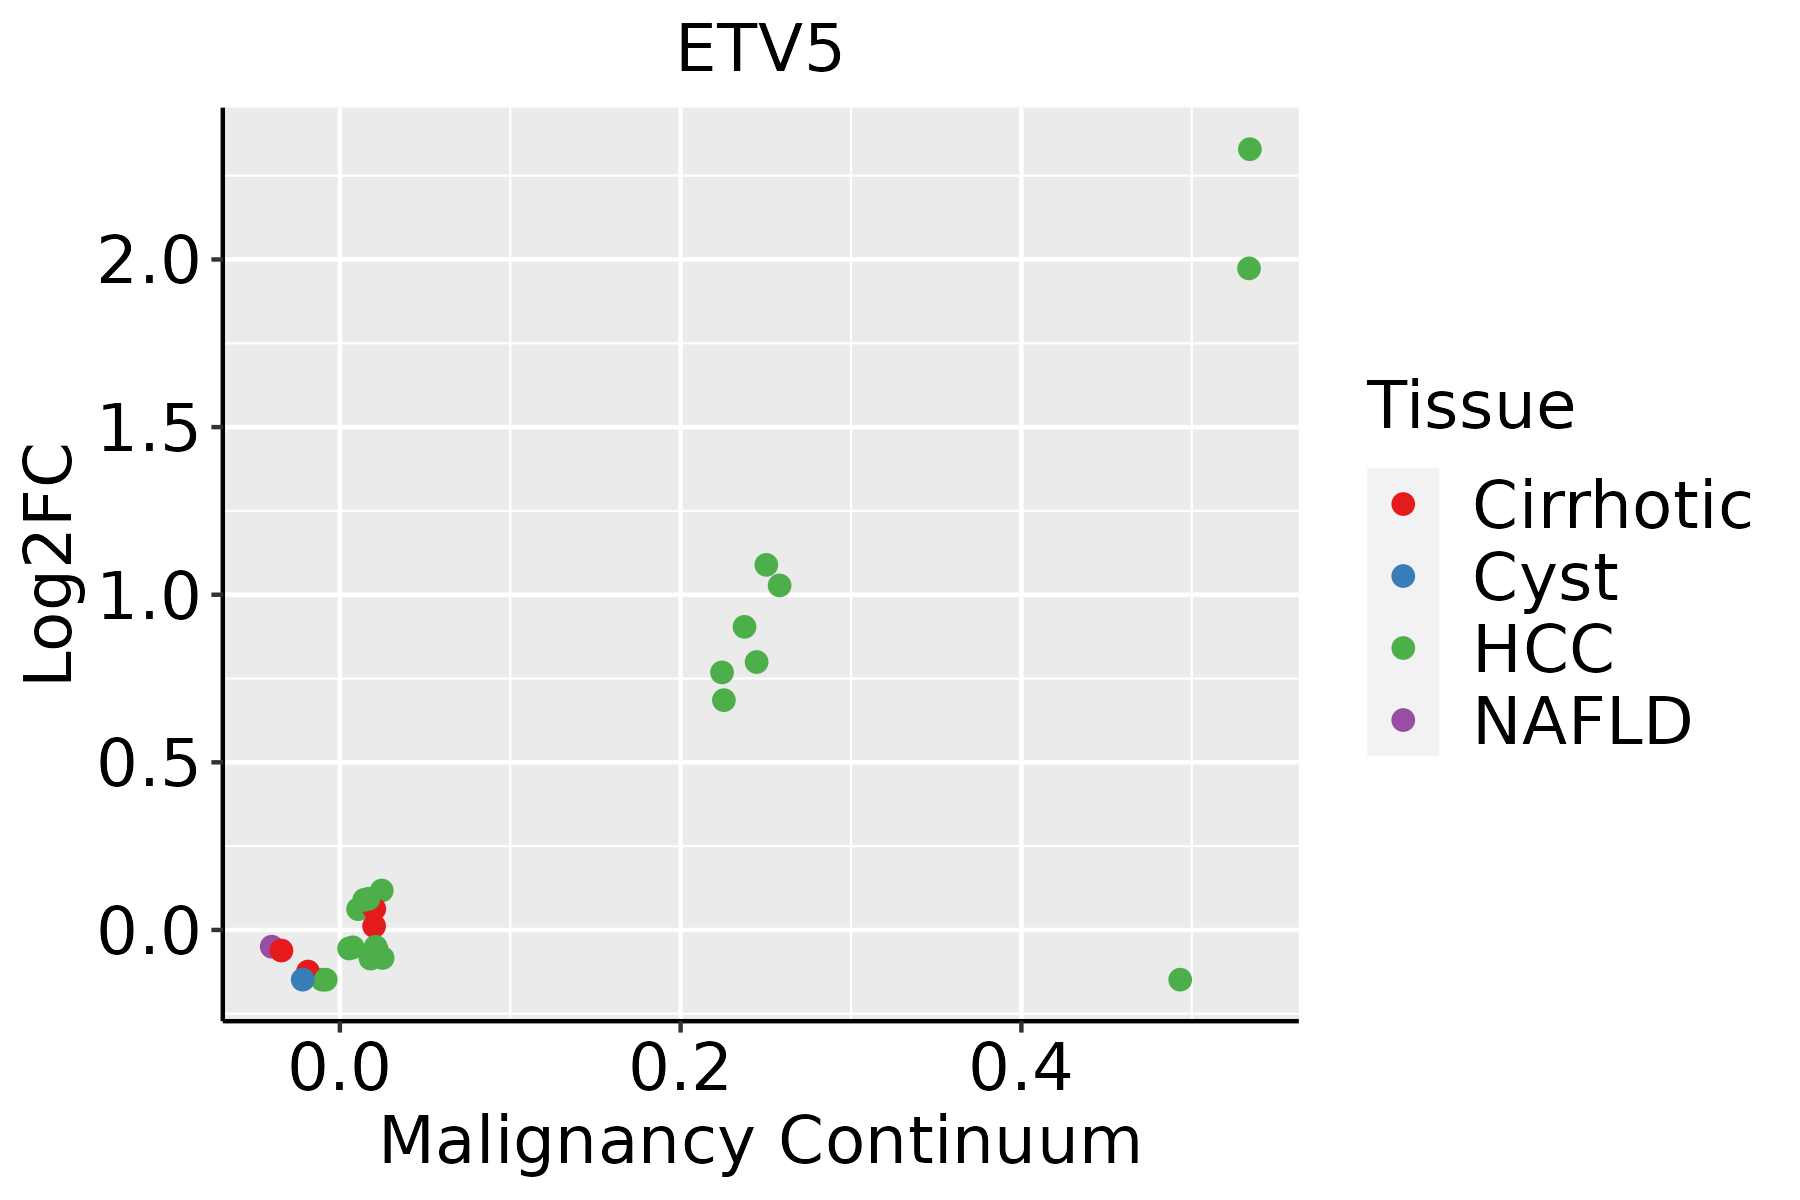 | HCC: Hepatocellular carcinoma |
| NAFLD: Non-alcoholic fatty liver disease | ||
| Oral Cavity | 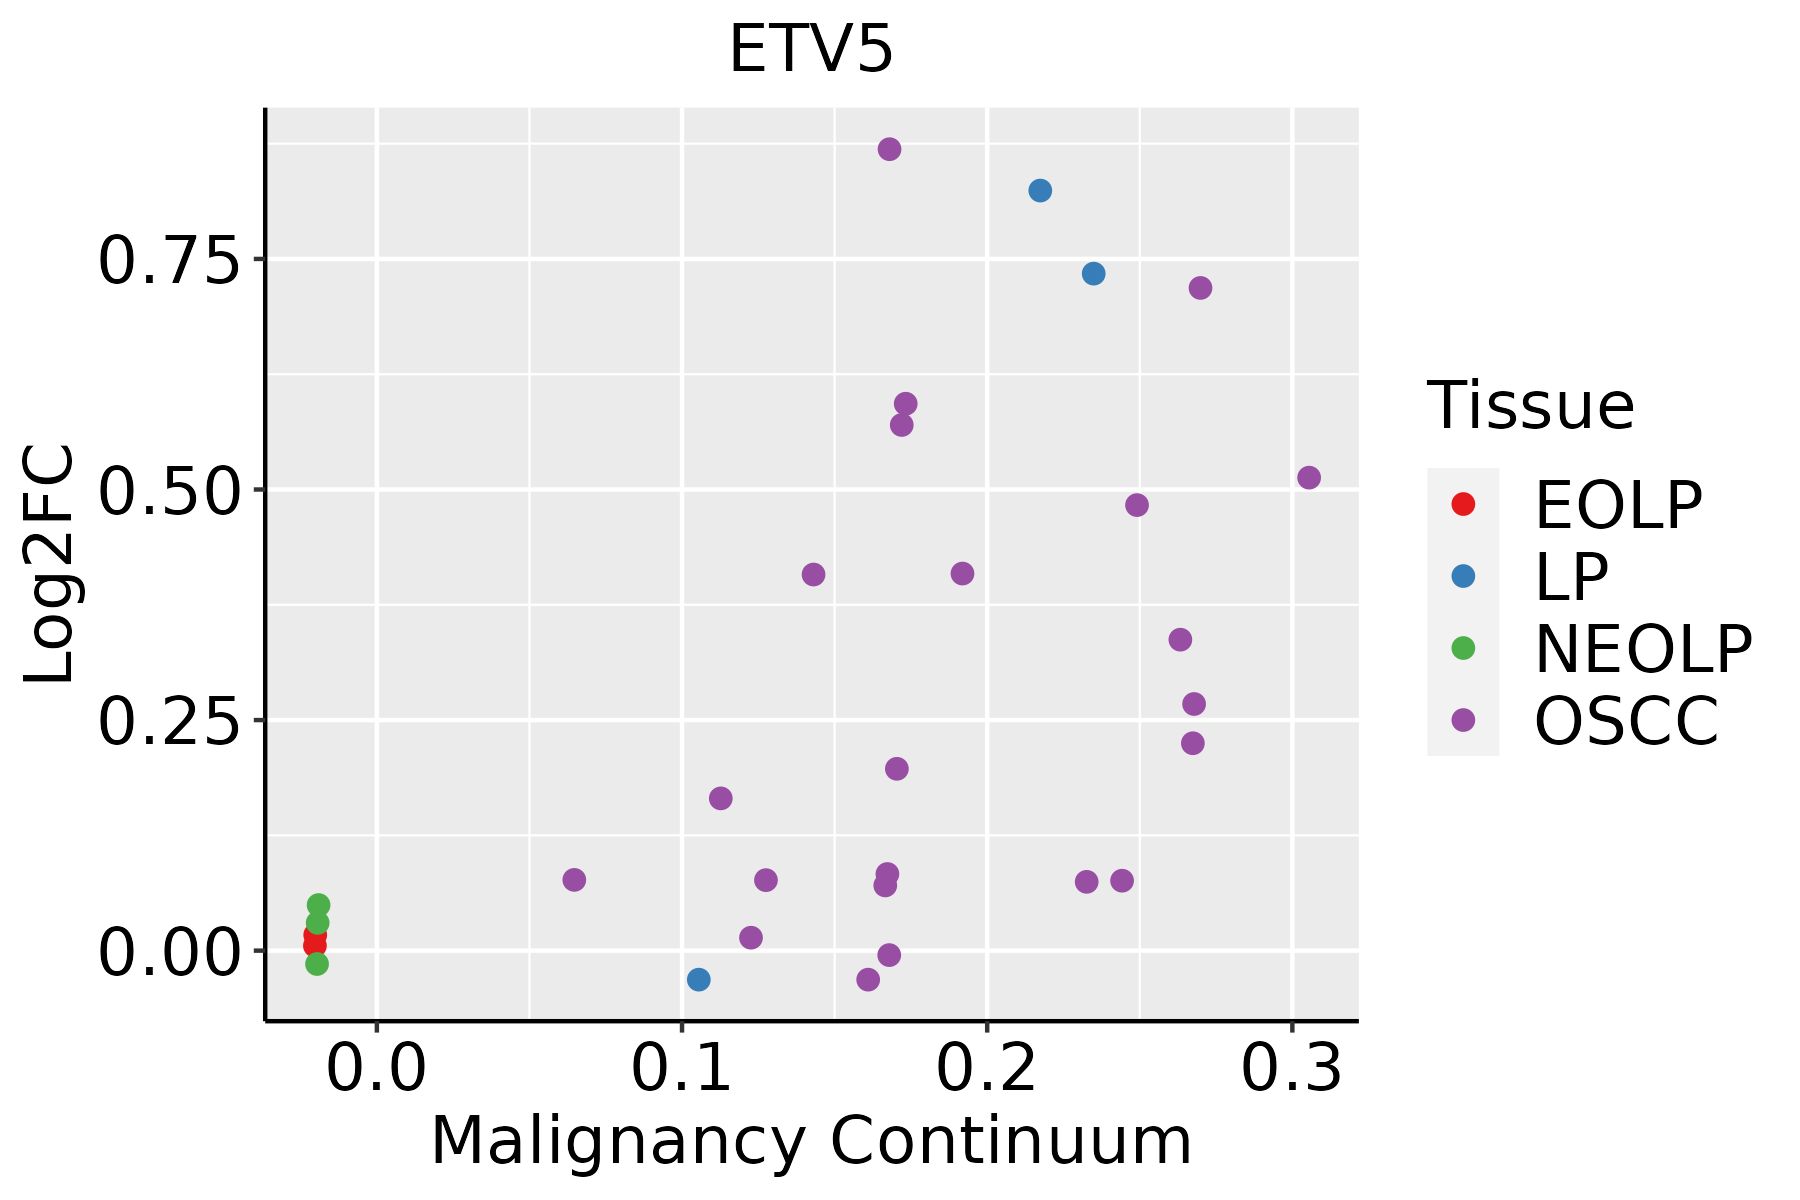 | EOLP: Erosive Oral lichen planus |
| LP: leukoplakia | ||
| NEOLP: Non-erosive oral lichen planus | ||
| OSCC: Oral squamous cell carcinoma | ||
| Thyroid | 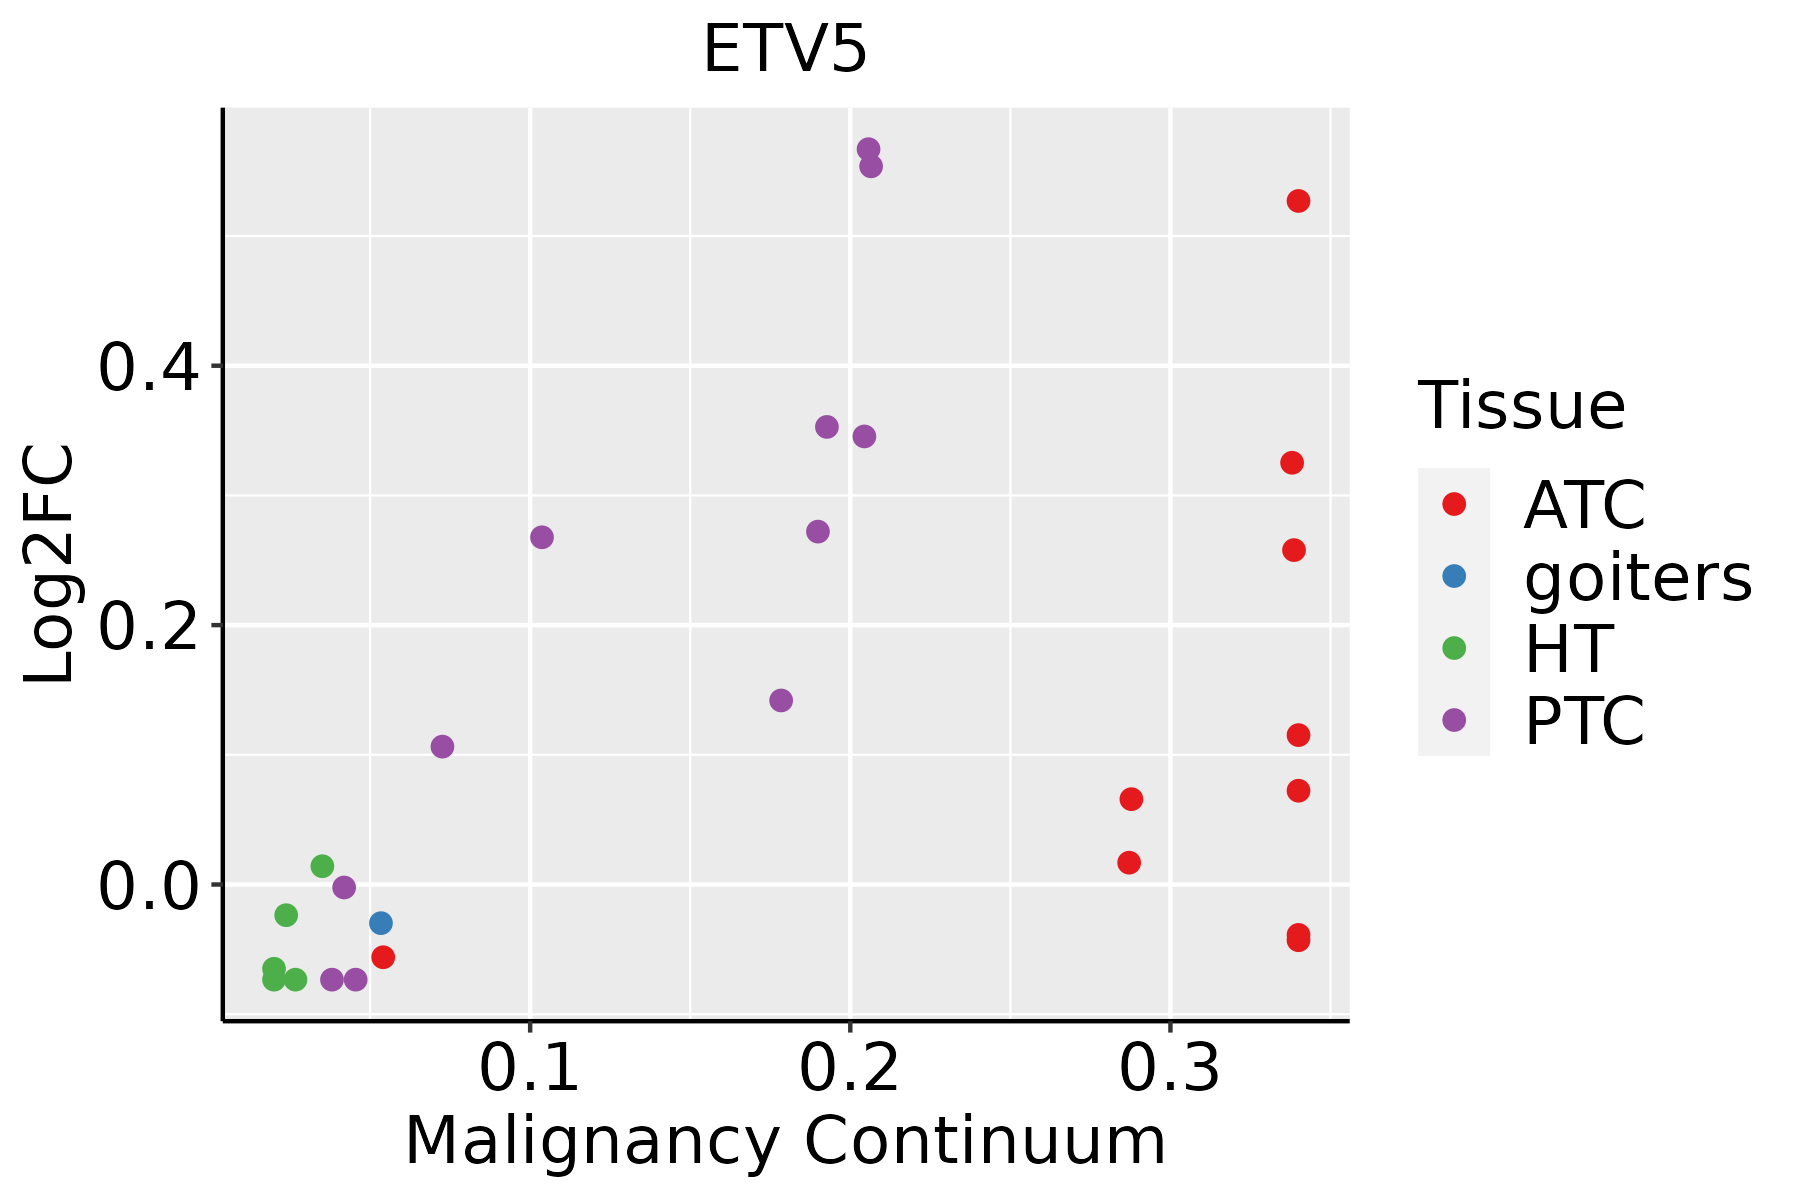 | ATC: Anaplastic thyroid cancer |
| HT: Hashimoto's thyroiditis | ||
| PTC: Papillary thyroid cancer |
| ∗log2FC in expression of this searched gene in stem-like cells from each diseased tissue sample relative to stem-like cells in normal samples in each tissue plotted against the malignancy continuum. Samples are colored based on if they are from different disease stage. |
Top |
Malignant transformation related pathway analysis |
| Find out the enriched GO biological processes and KEGG pathways involved in transition from healthy to precancer to cancer |
| Tissue | Disease Stage | Enriched GO biological Processes |
| Colorectum | AD |  |
| Colorectum | SER |  |
| Colorectum | MSS |  |
| Colorectum | MSI-H |  |
| Colorectum | FAP |  |
| ∗Top 15 enriched GO BP terms are showed in the bar plot of each disease state in each tissue. Each row represents a significant GO biological process which is colored according to the -log10(p.adjust). |
| Page: 1 2 3 4 5 6 7 8 9 |
| GO ID | Tissue | Disease Stage | Description | Gene Ratio | Bg Ratio | pvalue | p.adjust | Count |
| GO:0006979111 | Esophagus | ESCC | response to oxidative stress | 303/8552 | 446/18723 | 7.15e-22 | 1.30e-19 | 303 |
| GO:0062197111 | Esophagus | ESCC | cellular response to chemical stress | 234/8552 | 337/18723 | 5.37e-19 | 5.97e-17 | 234 |
| GO:0034599111 | Esophagus | ESCC | cellular response to oxidative stress | 197/8552 | 288/18723 | 3.76e-15 | 2.15e-13 | 197 |
| GO:001072010 | Esophagus | ESCC | positive regulation of cell development | 172/8552 | 298/18723 | 1.74e-05 | 1.55e-04 | 172 |
| GO:00420636 | Esophagus | ESCC | gliogenesis | 172/8552 | 301/18723 | 3.75e-05 | 3.04e-04 | 172 |
| GO:005076710 | Esophagus | ESCC | regulation of neurogenesis | 203/8552 | 364/18723 | 6.10e-05 | 4.68e-04 | 203 |
| GO:00140091 | Esophagus | ESCC | glial cell proliferation | 37/8552 | 51/18723 | 9.01e-05 | 6.50e-04 | 37 |
| GO:00507697 | Esophagus | ESCC | positive regulation of neurogenesis | 131/8552 | 225/18723 | 9.71e-05 | 6.90e-04 | 131 |
| GO:00519606 | Esophagus | ESCC | regulation of nervous system development | 237/8552 | 443/18723 | 5.02e-04 | 2.78e-03 | 237 |
| GO:00519625 | Esophagus | ESCC | positive regulation of nervous system development | 149/8552 | 272/18723 | 1.50e-03 | 7.06e-03 | 149 |
| GO:00602511 | Esophagus | ESCC | regulation of glial cell proliferation | 25/8552 | 36/18723 | 3.39e-03 | 1.39e-02 | 25 |
| GO:00140151 | Esophagus | ESCC | positive regulation of gliogenesis | 41/8552 | 66/18723 | 5.22e-03 | 1.97e-02 | 41 |
| GO:00602521 | Esophagus | ESCC | positive regulation of glial cell proliferation | 15/8552 | 20/18723 | 7.60e-03 | 2.71e-02 | 15 |
| GO:00140131 | Esophagus | ESCC | regulation of gliogenesis | 59/8552 | 103/18723 | 1.17e-02 | 3.91e-02 | 59 |
| GO:0008356 | Esophagus | ESCC | asymmetric cell division | 14/8552 | 19/18723 | 1.27e-02 | 4.21e-02 | 14 |
| GO:000697922 | Liver | HCC | response to oxidative stress | 281/7958 | 446/18723 | 9.75e-19 | 1.24e-16 | 281 |
| GO:006219722 | Liver | HCC | cellular response to chemical stress | 216/7958 | 337/18723 | 6.86e-16 | 5.44e-14 | 216 |
| GO:003459922 | Liver | HCC | cellular response to oxidative stress | 183/7958 | 288/18723 | 3.65e-13 | 1.93e-11 | 183 |
| GO:001072011 | Liver | HCC | positive regulation of cell development | 155/7958 | 298/18723 | 5.39e-04 | 3.48e-03 | 155 |
| GO:00507674 | Liver | HCC | regulation of neurogenesis | 181/7958 | 364/18723 | 3.00e-03 | 1.40e-02 | 181 |
| Page: 1 2 3 4 |
| Pathway ID | Tissue | Disease Stage | Description | Gene Ratio | Bg Ratio | pvalue | p.adjust | qvalue | Count |
| hsa0521516 | Esophagus | ESCC | Prostate cancer | 72/4205 | 97/8465 | 6.12e-07 | 4.10e-06 | 2.10e-06 | 72 |
| hsa052028 | Esophagus | ESCC | Transcriptional misregulation in cancer | 116/4205 | 193/8465 | 2.08e-03 | 5.95e-03 | 3.05e-03 | 116 |
| hsa0521517 | Esophagus | ESCC | Prostate cancer | 72/4205 | 97/8465 | 6.12e-07 | 4.10e-06 | 2.10e-06 | 72 |
| hsa0520213 | Esophagus | ESCC | Transcriptional misregulation in cancer | 116/4205 | 193/8465 | 2.08e-03 | 5.95e-03 | 3.05e-03 | 116 |
| hsa0521510 | Oral cavity | OSCC | Prostate cancer | 66/3704 | 97/8465 | 1.05e-06 | 5.89e-06 | 3.00e-06 | 66 |
| hsa0521515 | Oral cavity | OSCC | Prostate cancer | 66/3704 | 97/8465 | 1.05e-06 | 5.89e-06 | 3.00e-06 | 66 |
| Page: 1 |
Top |
Cell-cell communication analysis |
| Identification of potential cell-cell interactions between two cell types and their ligand-receptor pairs for different disease states |
| Ligand | Receptor | LRpair | Pathway | Tissue | Disease Stage |
| Page: 1 |
Top |
Single-cell gene regulatory network inference analysis |
| Find out the significant the regulons (TFs) and the target genes of each regulon across cell types for different disease states |
| TF | Cell Type | Tissue | Disease Stage | Target Gene | RSS | Regulon Activity |
| ETV5 | FIB | Breast | DCIS | C1QC,HLA-DMA,HLA-DMB, etc. | 7.56e-01 |  |
| ETV5 | MAC | Colorectum | FAP | ADAP2,NRP1,AP1B1, etc. | 3.11e-01 |  |
| ETV5 | KUP | Liver | Healthy | CD5L,AXL,CETP, etc. | 3.55e-01 |  |
| ETV5 | LC | Lung | ADJ | CLEC5A,FCGR2B,CD1C, etc. | 2.67e-01 |  |
| ETV5 | MAST | Lung | ADJ | CLEC5A,FCGR2B,CD1C, etc. | 3.54e-02 | |
| ETV5 | M2MAC | Lung | ADJ | CLEC5A,FCGR2B,CD1C, etc. | 8.66e-02 | |
| ETV5 | MMC | Lung | ADJ | CLEC5A,FCGR2B,CD1C, etc. | 1.84e-02 | |
| ETV5 | M2MAC | Lung | IAC | YWHAH,HHEX,MEF2C, etc. | 1.14e-01 |  |
| ETV5 | INCAF | Lung | ADJ | SLC34A2,MUC1,FGF14, etc. | 8.46e-02 | |
| ETV5 | FIB | Lung | ADJ | SLC34A2,MUC1,FGF14, etc. | 3.47e-02 | |
| ∗The dot plots of a searched regulon are shown for all cell subpopulations in each disease state of each tissue based on the regulon specific score inferred using pySCENIC and by calculating the average expression. |
| Page: 1 2 3 |
Top |
Somatic mutation of malignant transformation related genes |
| Annotation of somatic variants for genes involved in malignant transformation |
| Hugo Symbol | Variant Class | Variant Classification | dbSNP RS | HGVSc | HGVSp | HGVSp Short | SWISSPROT | BIOTYPE | SIFT | PolyPhen | Tumor Sample Barcode | Tissue | Histology | Sex | Age | Stage | Therapy Types | Drugs | Outcome |
| ETV5 | SNV | Missense_Mutation | c.819T>A | p.His273Gln | p.H273Q | P41161 | protein_coding | tolerated(1) | benign(0.007) | TCGA-A2-A1G4-01 | Breast | breast invasive carcinoma | Female | >=65 | III/IV | Chemotherapy | adriamycin | SD | |
| ETV5 | SNV | Missense_Mutation | rs763950262 | c.766N>T | p.Pro256Ser | p.P256S | P41161 | protein_coding | tolerated(0.07) | benign(0.225) | TCGA-AR-A24L-01 | Breast | breast invasive carcinoma | Female | <65 | I/II | Hormone Therapy | tamoxiphen | PD |
| ETV5 | SNV | Missense_Mutation | novel | c.1291G>A | p.Glu431Lys | p.E431K | P41161 | protein_coding | deleterious(0) | probably_damaging(0.999) | TCGA-AR-A2LE-01 | Breast | breast invasive carcinoma | Female | >=65 | I/II | Hormone Therapy | tamoxiphen | PD |
| ETV5 | SNV | Missense_Mutation | c.16N>C | p.Asp6His | p.D6H | P41161 | protein_coding | deleterious(0.03) | probably_damaging(0.999) | TCGA-D8-A27G-01 | Breast | breast invasive carcinoma | Female | >=65 | I/II | Unknown | Unknown | SD | |
| ETV5 | SNV | Missense_Mutation | rs777358489 | c.1175N>A | p.Arg392Gln | p.R392Q | P41161 | protein_coding | deleterious(0) | probably_damaging(0.999) | TCGA-E9-A1NA-01 | Breast | breast invasive carcinoma | Female | <65 | I/II | Chemotherapy | cyclophosphamide | SD |
| ETV5 | SNV | Missense_Mutation | rs201874364 | c.901G>A | p.Val301Ile | p.V301I | P41161 | protein_coding | tolerated(0.27) | benign(0) | TCGA-2W-A8YY-01 | Cervix | cervical & endocervical cancer | Female | <65 | I/II | Chemotherapy | cisplatin | CR |
| ETV5 | SNV | Missense_Mutation | c.313N>A | p.Glu105Lys | p.E105K | P41161 | protein_coding | tolerated(0.73) | possibly_damaging(0.562) | TCGA-DR-A0ZM-01 | Cervix | cervical & endocervical cancer | Female | <65 | III/IV | Unspecific | Cisplatin | SD | |
| ETV5 | SNV | Missense_Mutation | c.1207N>A | p.Glu403Lys | p.E403K | P41161 | protein_coding | deleterious(0) | probably_damaging(0.999) | TCGA-EK-A2R7-01 | Cervix | cervical & endocervical cancer | Female | <65 | I/II | Unknown | Unknown | SD | |
| ETV5 | SNV | Missense_Mutation | novel | c.1415N>G | p.Glu472Gly | p.E472G | P41161 | protein_coding | deleterious(0) | benign(0.015) | TCGA-A6-5665-01 | Colorectum | colon adenocarcinoma | Female | >=65 | I/II | Unknown | Unknown | PD |
| ETV5 | SNV | Missense_Mutation | c.1514C>T | p.Ala505Val | p.A505V | P41161 | protein_coding | tolerated(0.11) | benign(0.017) | TCGA-AA-3815-01 | Colorectum | colon adenocarcinoma | Female | >=65 | I/II | Unknown | Unknown | SD |
| Page: 1 2 3 4 5 6 7 8 |
Top |
Related drugs of malignant transformation related genes |
| Identification of chemicals and drugs interact with genes involved in malignant transfromation |
| (DGIdb 4.0) |
| Entrez ID | Symbol | Category | Interaction Types | Drug Claim Name | Drug Name | PMIDs |
| 2119 | ETV5 | DRUG RESISTANCE, CLINICALLY ACTIONABLE | TRAMETINIB | TRAMETINIB | 28178529 |
| Page: 1 |

Copyright 2023-Present -The University of Texas Health Science Center at Houston |