
|
|||||
|
 | |
| |
| |
| |
| |
| |
|
Gene: ETV4 |
Gene summary for ETV4 |
| Gene information | Species | Human | Gene symbol | ETV4 | Gene ID | 2118 |
| Gene name | ETS variant transcription factor 4 | |
| Gene Alias | E1A-F | |
| Cytomap | 17q21.31 | |
| Gene Type | protein-coding | GO ID | GO:0006139 | UniProtAcc | P43268 |
Top |
Malignant transformation analysis |
| Identification of the aberrant gene expression in precancerous and cancerous lesions by comparing the gene expression of stem-like cells in diseased tissues with normal stem cells |
| Entrez ID | Symbol | Replicates | Species | Organ | Tissue | Adj P-value | Log2FC | Malignancy |
| 2118 | ETV4 | LZE7T | Human | Esophagus | ESCC | 1.67e-04 | 2.00e-01 | 0.0667 |
| 2118 | ETV4 | LZE21T | Human | Esophagus | ESCC | 2.68e-02 | 6.78e-01 | 0.0655 |
| 2118 | ETV4 | P2T-E | Human | Esophagus | ESCC | 9.47e-65 | 1.40e+00 | 0.1177 |
| 2118 | ETV4 | P5T-E | Human | Esophagus | ESCC | 1.73e-13 | 2.97e-01 | 0.1327 |
| 2118 | ETV4 | P8T-E | Human | Esophagus | ESCC | 2.00e-10 | 2.78e-01 | 0.0889 |
| 2118 | ETV4 | P9T-E | Human | Esophagus | ESCC | 9.91e-08 | 2.65e-01 | 0.1131 |
| 2118 | ETV4 | P10T-E | Human | Esophagus | ESCC | 4.88e-18 | 3.50e-01 | 0.116 |
| 2118 | ETV4 | P12T-E | Human | Esophagus | ESCC | 8.46e-04 | 2.40e-01 | 0.1122 |
| 2118 | ETV4 | P15T-E | Human | Esophagus | ESCC | 3.43e-23 | 8.03e-01 | 0.1149 |
| 2118 | ETV4 | P16T-E | Human | Esophagus | ESCC | 4.60e-84 | 1.56e+00 | 0.1153 |
| 2118 | ETV4 | P17T-E | Human | Esophagus | ESCC | 1.30e-02 | 3.56e-01 | 0.1278 |
| 2118 | ETV4 | P21T-E | Human | Esophagus | ESCC | 1.36e-36 | 7.39e-01 | 0.1617 |
| 2118 | ETV4 | P22T-E | Human | Esophagus | ESCC | 1.39e-27 | 5.74e-01 | 0.1236 |
| 2118 | ETV4 | P24T-E | Human | Esophagus | ESCC | 9.46e-20 | 4.89e-01 | 0.1287 |
| 2118 | ETV4 | P26T-E | Human | Esophagus | ESCC | 5.46e-31 | 7.30e-01 | 0.1276 |
| 2118 | ETV4 | P28T-E | Human | Esophagus | ESCC | 1.36e-14 | 4.02e-01 | 0.1149 |
| 2118 | ETV4 | P30T-E | Human | Esophagus | ESCC | 1.06e-23 | 1.10e+00 | 0.137 |
| 2118 | ETV4 | P31T-E | Human | Esophagus | ESCC | 2.60e-36 | 8.64e-01 | 0.1251 |
| 2118 | ETV4 | P32T-E | Human | Esophagus | ESCC | 6.85e-26 | 5.53e-01 | 0.1666 |
| 2118 | ETV4 | P36T-E | Human | Esophagus | ESCC | 3.48e-04 | 2.25e-01 | 0.1187 |
| Page: 1 2 3 4 |
| Tissue | Expression Dynamics | Abbreviation |
| Esophagus | 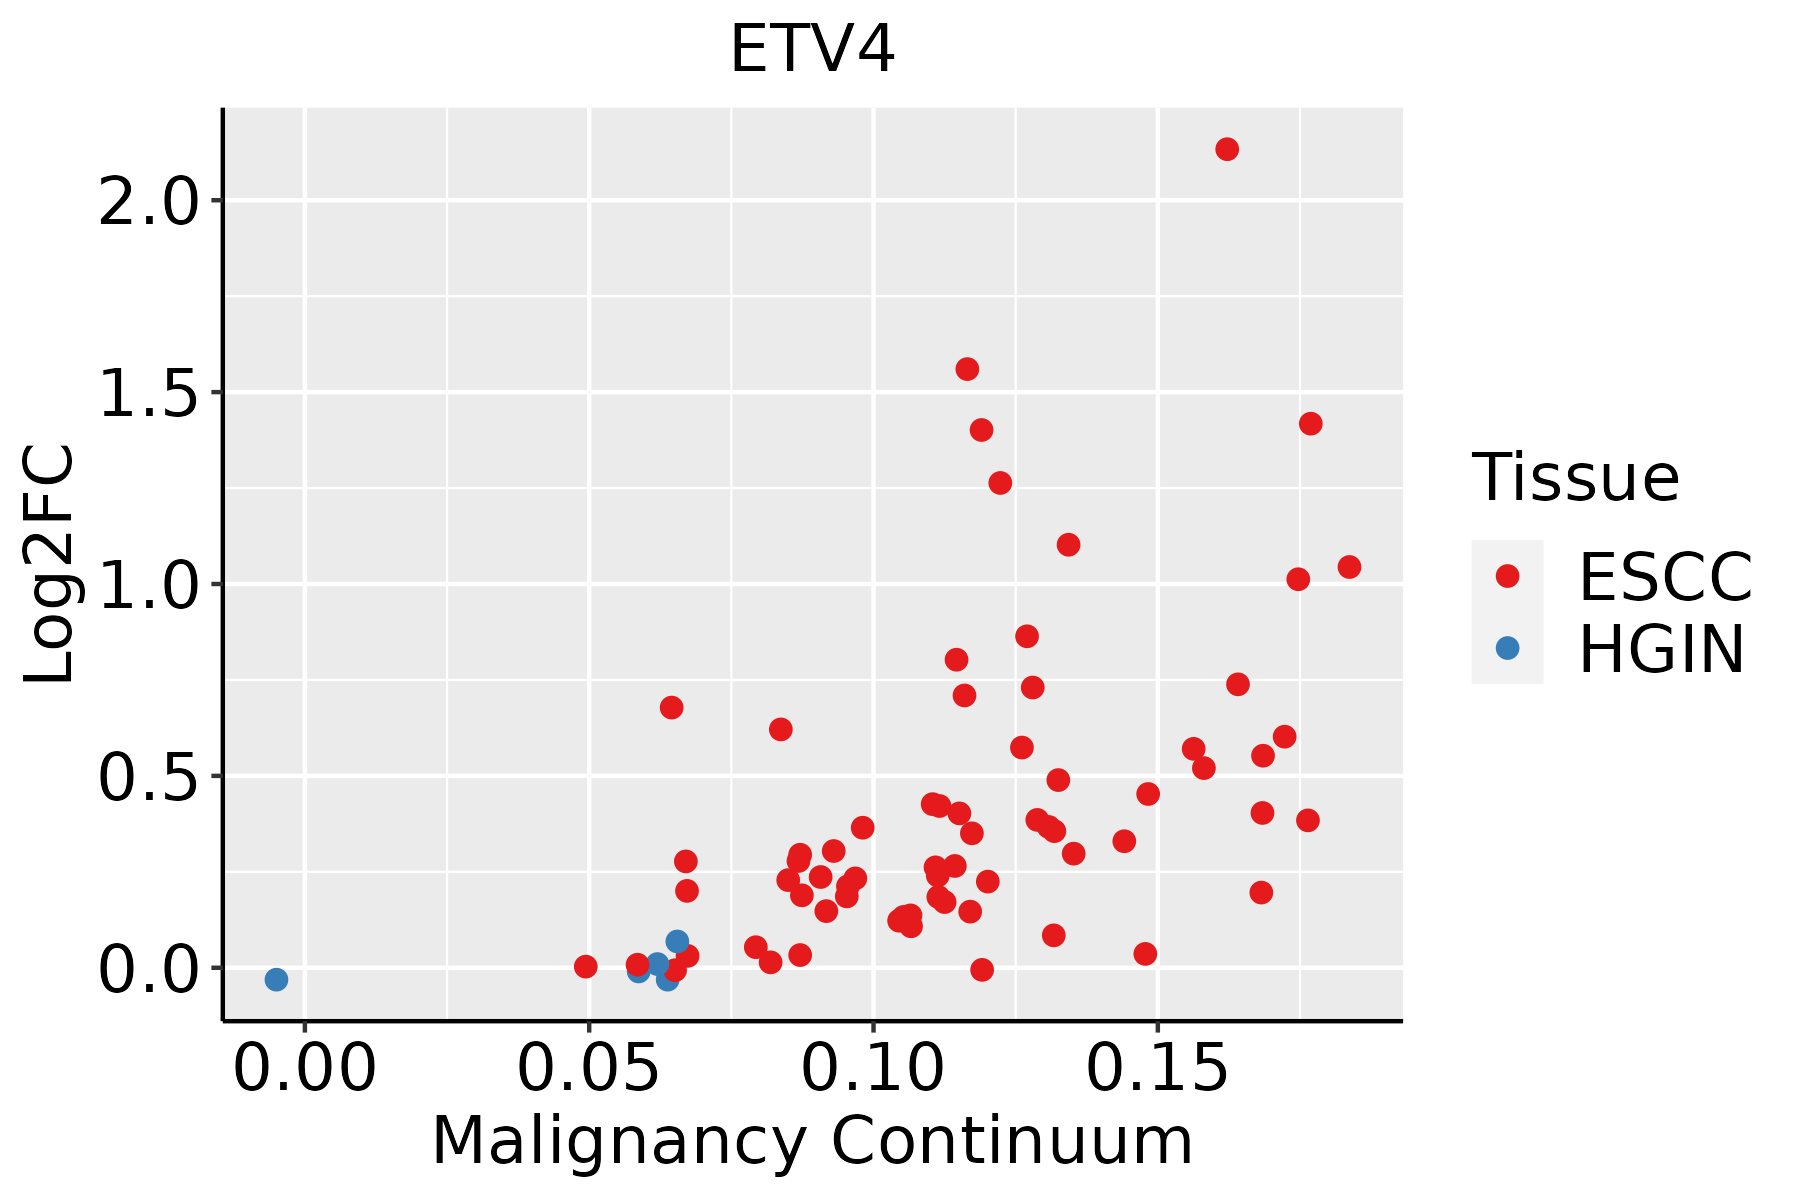 | ESCC: Esophageal squamous cell carcinoma |
| HGIN: High-grade intraepithelial neoplasias | ||
| LGIN: Low-grade intraepithelial neoplasias | ||
| Liver |  | HCC: Hepatocellular carcinoma |
| NAFLD: Non-alcoholic fatty liver disease | ||
| Oral Cavity | 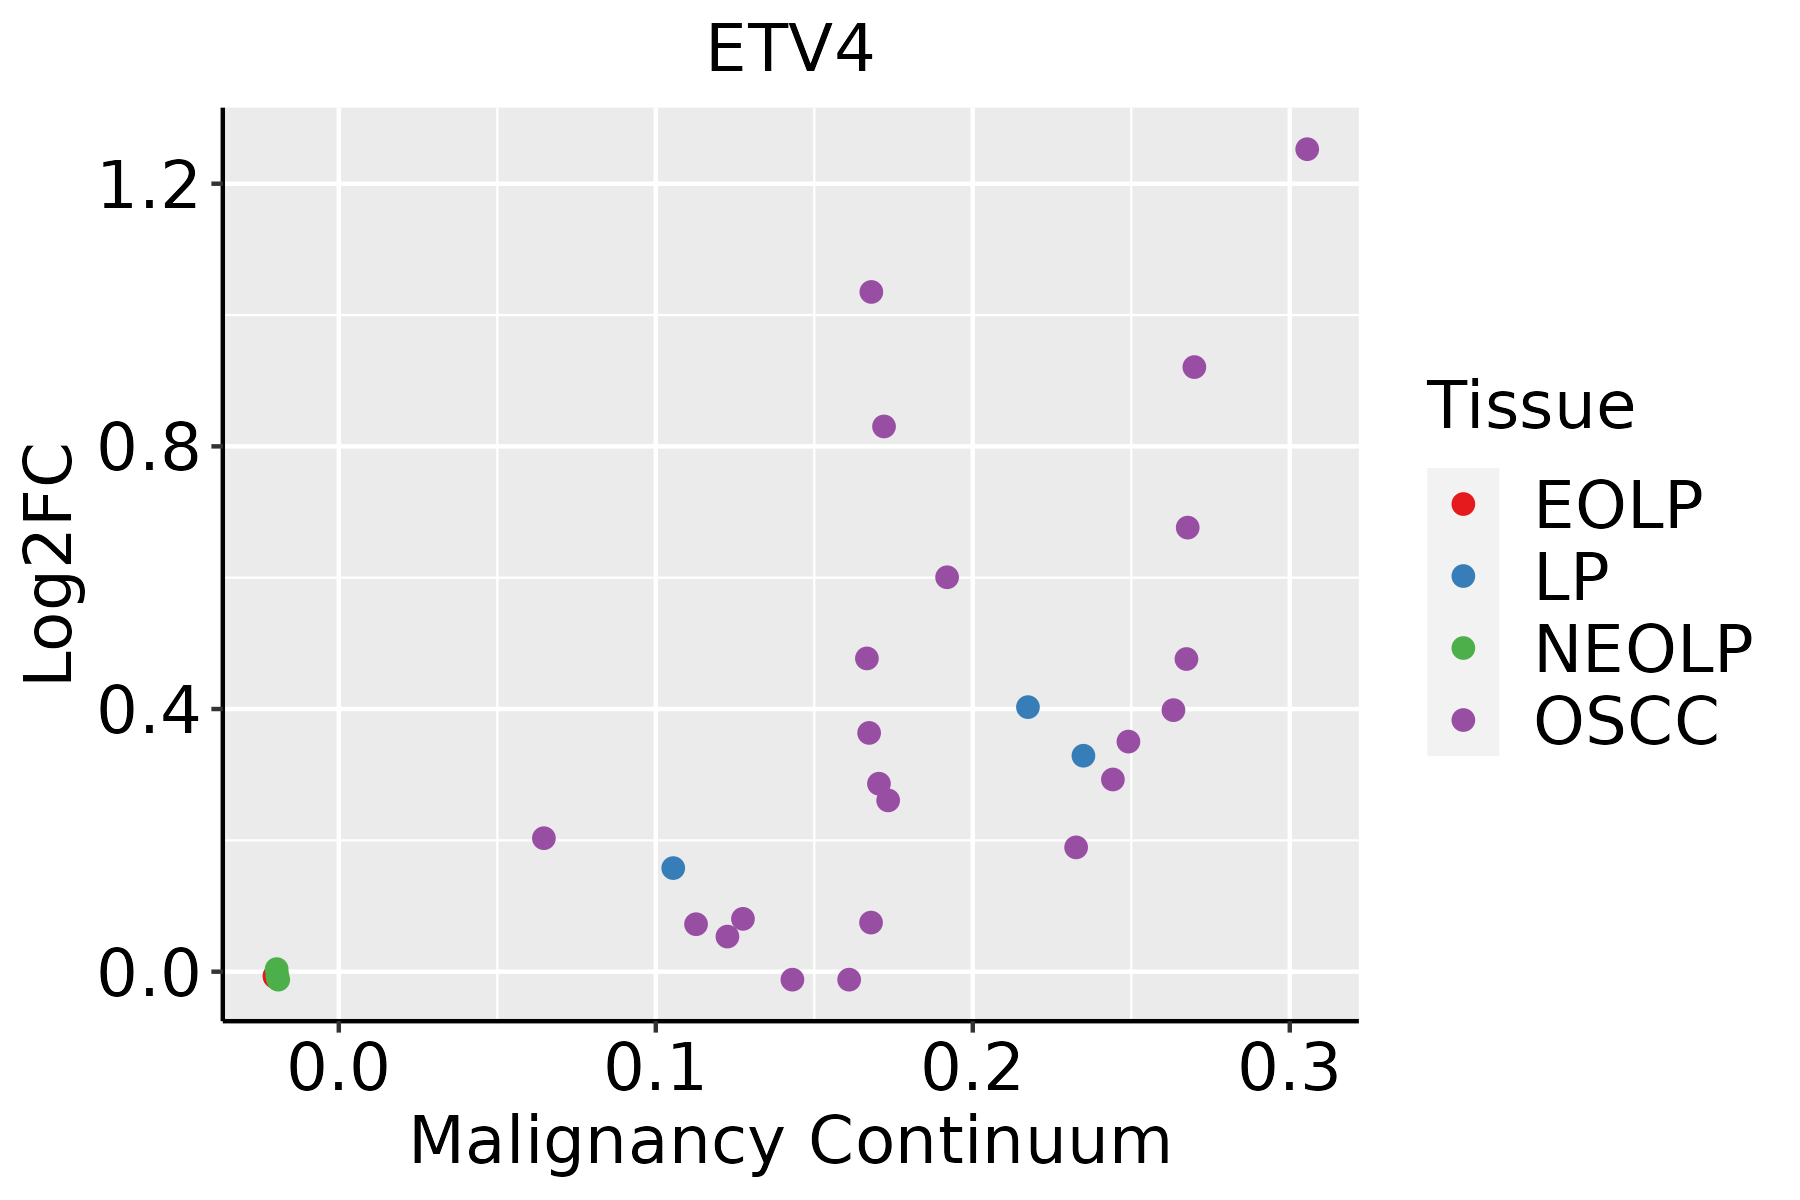 | EOLP: Erosive Oral lichen planus |
| LP: leukoplakia | ||
| NEOLP: Non-erosive oral lichen planus | ||
| OSCC: Oral squamous cell carcinoma |
| ∗log2FC in expression of this searched gene in stem-like cells from each diseased tissue sample relative to stem-like cells in normal samples in each tissue plotted against the malignancy continuum. Samples are colored based on if they are from different disease stage. |
Top |
Malignant transformation related pathway analysis |
| Find out the enriched GO biological processes and KEGG pathways involved in transition from healthy to precancer to cancer |
| Tissue | Disease Stage | Enriched GO biological Processes |
| Colorectum | AD |  |
| Colorectum | SER |  |
| Colorectum | MSS |  |
| Colorectum | MSI-H |  |
| Colorectum | FAP |  |
| ∗Top 15 enriched GO BP terms are showed in the bar plot of each disease state in each tissue. Each row represents a significant GO biological process which is colored according to the -log10(p.adjust). |
| Page: 1 2 3 4 5 6 7 8 9 |
| GO ID | Tissue | Disease Stage | Description | Gene Ratio | Bg Ratio | pvalue | p.adjust | Count |
| GO:00435888 | Esophagus | ESCC | skin development | 163/8552 | 263/18723 | 6.48e-08 | 1.14e-06 | 163 |
| GO:000854410 | Esophagus | ESCC | epidermis development | 193/8552 | 324/18723 | 2.87e-07 | 4.19e-06 | 193 |
| GO:000991310 | Esophagus | ESCC | epidermal cell differentiation | 122/8552 | 202/18723 | 1.69e-05 | 1.51e-04 | 122 |
| GO:00456826 | Esophagus | ESCC | regulation of epidermis development | 46/8552 | 65/18723 | 3.65e-05 | 2.97e-04 | 46 |
| GO:00302167 | Esophagus | ESCC | keratinocyte differentiation | 86/8552 | 139/18723 | 8.53e-05 | 6.19e-04 | 86 |
| GO:00456046 | Esophagus | ESCC | regulation of epidermal cell differentiation | 41/8552 | 58/18723 | 1.00e-04 | 7.10e-04 | 41 |
| GO:00456167 | Esophagus | ESCC | regulation of keratinocyte differentiation | 26/8552 | 37/18723 | 2.16e-03 | 9.62e-03 | 26 |
| GO:00456841 | Esophagus | ESCC | positive regulation of epidermis development | 23/8552 | 32/18723 | 2.43e-03 | 1.06e-02 | 23 |
| GO:00456061 | Esophagus | ESCC | positive regulation of epidermal cell differentiation | 20/8552 | 27/18723 | 2.61e-03 | 1.11e-02 | 20 |
| GO:00456181 | Esophagus | ESCC | positive regulation of keratinocyte differentiation | 14/8552 | 19/18723 | 1.27e-02 | 4.21e-02 | 14 |
| GO:00435887 | Oral cavity | OSCC | skin development | 143/7305 | 263/18723 | 2.77e-07 | 4.27e-06 | 143 |
| GO:00085449 | Oral cavity | OSCC | epidermis development | 171/7305 | 324/18723 | 2.89e-07 | 4.43e-06 | 171 |
| GO:00302166 | Oral cavity | OSCC | keratinocyte differentiation | 81/7305 | 139/18723 | 3.16e-06 | 3.81e-05 | 81 |
| GO:00099139 | Oral cavity | OSCC | epidermal cell differentiation | 109/7305 | 202/18723 | 1.08e-05 | 1.14e-04 | 109 |
| GO:00456825 | Oral cavity | OSCC | regulation of epidermis development | 41/7305 | 65/18723 | 7.29e-05 | 5.73e-04 | 41 |
| GO:00456045 | Oral cavity | OSCC | regulation of epidermal cell differentiation | 36/7305 | 58/18723 | 3.15e-04 | 1.96e-03 | 36 |
| GO:00456166 | Oral cavity | OSCC | regulation of keratinocyte differentiation | 23/7305 | 37/18723 | 3.66e-03 | 1.51e-02 | 23 |
| GO:0045684 | Oral cavity | OSCC | positive regulation of epidermis development | 20/7305 | 32/18723 | 6.05e-03 | 2.28e-02 | 20 |
| GO:0045618 | Oral cavity | OSCC | positive regulation of keratinocyte differentiation | 13/7305 | 19/18723 | 9.07e-03 | 3.26e-02 | 13 |
| GO:0045606 | Oral cavity | OSCC | positive regulation of epidermal cell differentiation | 17/7305 | 27/18723 | 1.01e-02 | 3.49e-02 | 17 |
| Page: 1 |
| Pathway ID | Tissue | Disease Stage | Description | Gene Ratio | Bg Ratio | pvalue | p.adjust | qvalue | Count |
| hsa052028 | Esophagus | ESCC | Transcriptional misregulation in cancer | 116/4205 | 193/8465 | 2.08e-03 | 5.95e-03 | 3.05e-03 | 116 |
| hsa0520213 | Esophagus | ESCC | Transcriptional misregulation in cancer | 116/4205 | 193/8465 | 2.08e-03 | 5.95e-03 | 3.05e-03 | 116 |
| Page: 1 |
Top |
Cell-cell communication analysis |
| Identification of potential cell-cell interactions between two cell types and their ligand-receptor pairs for different disease states |
| Ligand | Receptor | LRpair | Pathway | Tissue | Disease Stage |
| Page: 1 |
Top |
Single-cell gene regulatory network inference analysis |
| Find out the significant the regulons (TFs) and the target genes of each regulon across cell types for different disease states |
| TF | Cell Type | Tissue | Disease Stage | Target Gene | RSS | Regulon Activity |
| ETV4 | ASC | Colorectum | CRC | CEBPB,UTY,TGFBI, etc. | 3.27e-01 |  |
| ETV4 | ASC | Colorectum | FAP | CEBPB,UTY,TGFBI, etc. | 2.88e-01 |  |
| ETV4 | ICAF | Oral cavity | OSCC | COL7A1,GPM6B,PDLIM4, etc. | 2.40e-01 |  |
| ∗The dot plots of a searched regulon are shown for all cell subpopulations in each disease state of each tissue based on the regulon specific score inferred using pySCENIC and by calculating the average expression. |
| Page: 1 |
Top |
Somatic mutation of malignant transformation related genes |
| Annotation of somatic variants for genes involved in malignant transformation |
| Hugo Symbol | Variant Class | Variant Classification | dbSNP RS | HGVSc | HGVSp | HGVSp Short | SWISSPROT | BIOTYPE | SIFT | PolyPhen | Tumor Sample Barcode | Tissue | Histology | Sex | Age | Stage | Therapy Types | Drugs | Outcome |
| ETV4 | SNV | Missense_Mutation | rs149750366 | c.614T>C | p.Leu205Pro | p.L205P | P43268 | protein_coding | tolerated(0.36) | benign(0.001) | TCGA-AN-A0FX-01 | Breast | breast invasive carcinoma | Female | <65 | I/II | Unknown | Unknown | SD |
| ETV4 | insertion | Nonsense_Mutation | novel | c.836_837insACCG | p.Tyr279Ter | p.Y279* | P43268 | protein_coding | TCGA-B6-A0RI-01 | Breast | breast invasive carcinoma | Female | <65 | III/IV | Unknown | Unknown | PD | ||
| ETV4 | SNV | Missense_Mutation | rs746787291 | c.1012N>T | p.Arg338Trp | p.R338W | P43268 | protein_coding | deleterious(0) | probably_damaging(0.999) | TCGA-2W-A8YY-01 | Cervix | cervical & endocervical cancer | Female | <65 | I/II | Chemotherapy | cisplatin | CR |
| ETV4 | SNV | Missense_Mutation | novel | c.913N>T | p.Pro305Ser | p.P305S | P43268 | protein_coding | tolerated(0.44) | benign(0.056) | TCGA-2W-A8YY-01 | Cervix | cervical & endocervical cancer | Female | <65 | I/II | Chemotherapy | cisplatin | CR |
| ETV4 | SNV | Missense_Mutation | rs776306922 | c.88N>A | p.Glu30Lys | p.E30K | P43268 | protein_coding | tolerated(0.71) | benign(0.043) | TCGA-FU-A40J-01 | Cervix | cervical & endocervical cancer | Female | <65 | III/IV | Chemotherapy | carboplatin | CR |
| ETV4 | SNV | Missense_Mutation | rs776306922 | c.88N>A | p.Glu30Lys | p.E30K | P43268 | protein_coding | tolerated(0.71) | benign(0.043) | TCGA-VS-A94Z-01 | Cervix | cervical & endocervical cancer | Female | <65 | I/II | Chemotherapy | cisplatin | CR |
| ETV4 | deletion | Frame_Shift_Del | novel | c.88_94delNNNNNNN | p.Glu30Ter | p.E30* | P43268 | protein_coding | TCGA-C5-A1MJ-01 | Cervix | cervical & endocervical cancer | Female | <65 | I/II | Unknown | Unknown | SD | ||
| ETV4 | SNV | Missense_Mutation | novel | c.332N>A | p.Ser111Asn | p.S111N | P43268 | protein_coding | tolerated(0.17) | benign(0.003) | TCGA-A6-2672-01 | Colorectum | colon adenocarcinoma | Female | >=65 | III/IV | Unknown | Unknown | SD |
| ETV4 | SNV | Missense_Mutation | c.671G>T | p.Ser224Ile | p.S224I | P43268 | protein_coding | deleterious(0) | benign(0.137) | TCGA-AA-A010-01 | Colorectum | colon adenocarcinoma | Female | <65 | I/II | Chemotherapy | folinic | CR | |
| ETV4 | SNV | Missense_Mutation | c.1224N>A | p.Met408Ile | p.M408I | P43268 | protein_coding | deleterious(0) | probably_damaging(0.992) | TCGA-AZ-4615-01 | Colorectum | colon adenocarcinoma | Male | >=65 | III/IV | Chemotherapy | xeloda | PD |
| Page: 1 2 3 4 5 |
Top |
Related drugs of malignant transformation related genes |
| Identification of chemicals and drugs interact with genes involved in malignant transfromation |
| (DGIdb 4.0) |
| Entrez ID | Symbol | Category | Interaction Types | Drug Claim Name | Drug Name | PMIDs |
| 2118 | ETV4 | CLINICALLY ACTIONABLE, DRUG RESISTANCE | TRAMETINIB | TRAMETINIB | 28178529 |
| Page: 1 |

Copyright 2023-Present -The University of Texas Health Science Center at Houston |