
|
|||||
|
 | |
| |
| |
| |
| |
| |
|
Gene: ETV3 |
Gene summary for ETV3 |
| Gene information | Species | Human | Gene symbol | ETV3 | Gene ID | 2117 |
| Gene name | ETS variant transcription factor 3 | |
| Gene Alias | METS | |
| Cytomap | 1q23.1 | |
| Gene Type | protein-coding | GO ID | GO:0000122 | UniProtAcc | P41162 |
Top |
Malignant transformation analysis |
| Identification of the aberrant gene expression in precancerous and cancerous lesions by comparing the gene expression of stem-like cells in diseased tissues with normal stem cells |
| Entrez ID | Symbol | Replicates | Species | Organ | Tissue | Adj P-value | Log2FC | Malignancy |
| 2117 | ETV3 | LZE4T | Human | Esophagus | ESCC | 1.17e-02 | 2.78e-01 | 0.0811 |
| 2117 | ETV3 | LZE7T | Human | Esophagus | ESCC | 9.47e-06 | 2.05e-01 | 0.0667 |
| 2117 | ETV3 | LZE8T | Human | Esophagus | ESCC | 4.49e-04 | 1.44e-01 | 0.067 |
| 2117 | ETV3 | LZE20T | Human | Esophagus | ESCC | 2.13e-03 | 1.29e-01 | 0.0662 |
| 2117 | ETV3 | LZE21T | Human | Esophagus | ESCC | 1.37e-02 | 3.66e-01 | 0.0655 |
| 2117 | ETV3 | P1T-E | Human | Esophagus | ESCC | 1.70e-09 | 2.53e-01 | 0.0875 |
| 2117 | ETV3 | P2T-E | Human | Esophagus | ESCC | 1.04e-25 | 3.70e-01 | 0.1177 |
| 2117 | ETV3 | P4T-E | Human | Esophagus | ESCC | 8.95e-09 | 9.20e-02 | 0.1323 |
| 2117 | ETV3 | P5T-E | Human | Esophagus | ESCC | 7.16e-06 | 2.11e-01 | 0.1327 |
| 2117 | ETV3 | P8T-E | Human | Esophagus | ESCC | 4.89e-17 | 1.82e-01 | 0.0889 |
| 2117 | ETV3 | P9T-E | Human | Esophagus | ESCC | 2.47e-19 | 2.79e-01 | 0.1131 |
| 2117 | ETV3 | P10T-E | Human | Esophagus | ESCC | 1.88e-16 | 6.62e-02 | 0.116 |
| 2117 | ETV3 | P11T-E | Human | Esophagus | ESCC | 6.36e-10 | 2.27e-01 | 0.1426 |
| 2117 | ETV3 | P12T-E | Human | Esophagus | ESCC | 1.83e-17 | 1.07e-01 | 0.1122 |
| 2117 | ETV3 | P15T-E | Human | Esophagus | ESCC | 2.12e-16 | 3.46e-01 | 0.1149 |
| 2117 | ETV3 | P16T-E | Human | Esophagus | ESCC | 1.83e-13 | 1.44e-01 | 0.1153 |
| 2117 | ETV3 | P17T-E | Human | Esophagus | ESCC | 6.44e-03 | 2.80e-02 | 0.1278 |
| 2117 | ETV3 | P20T-E | Human | Esophagus | ESCC | 3.47e-04 | 2.80e-01 | 0.1124 |
| 2117 | ETV3 | P21T-E | Human | Esophagus | ESCC | 7.17e-13 | 1.81e-01 | 0.1617 |
| 2117 | ETV3 | P22T-E | Human | Esophagus | ESCC | 7.97e-23 | 5.94e-02 | 0.1236 |
| Page: 1 2 3 4 5 |
| Tissue | Expression Dynamics | Abbreviation |
| Esophagus | 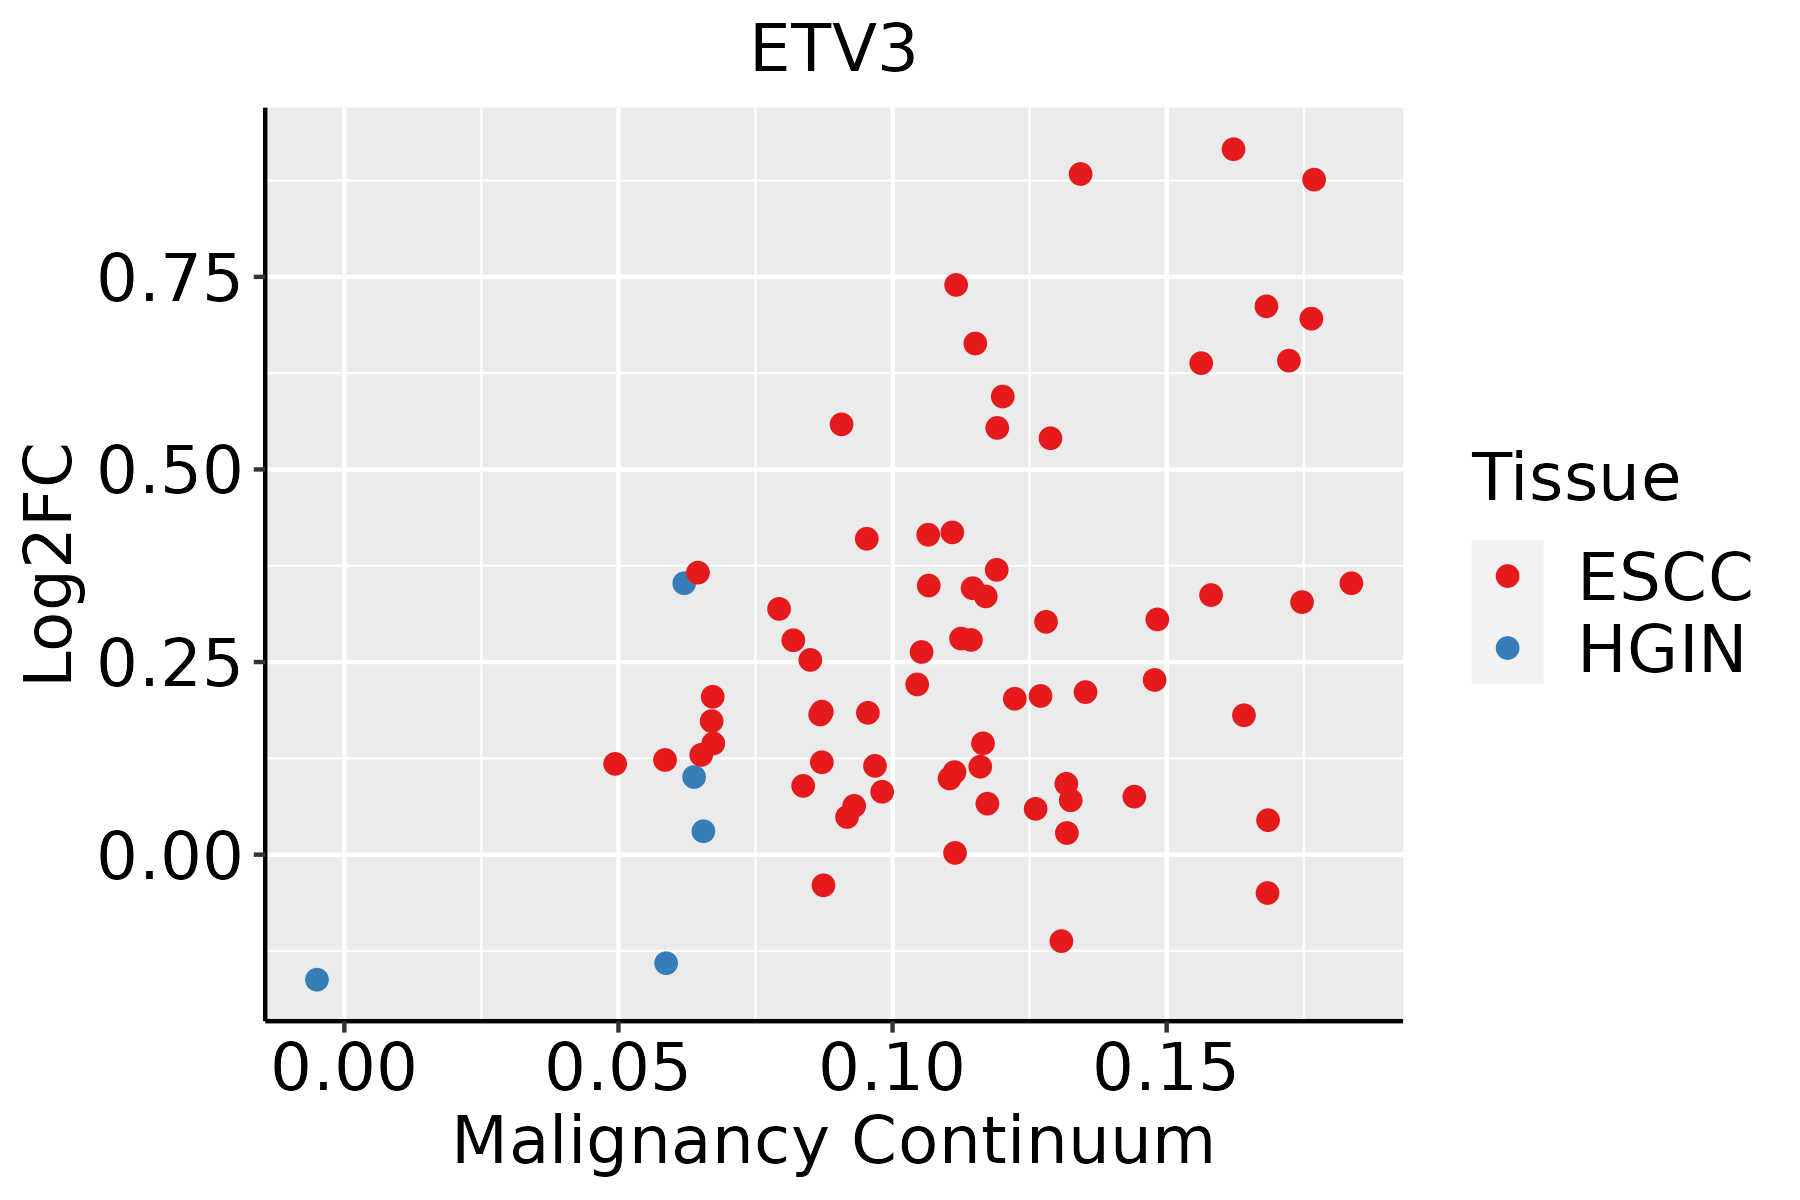 | ESCC: Esophageal squamous cell carcinoma |
| HGIN: High-grade intraepithelial neoplasias | ||
| LGIN: Low-grade intraepithelial neoplasias | ||
| Oral Cavity | 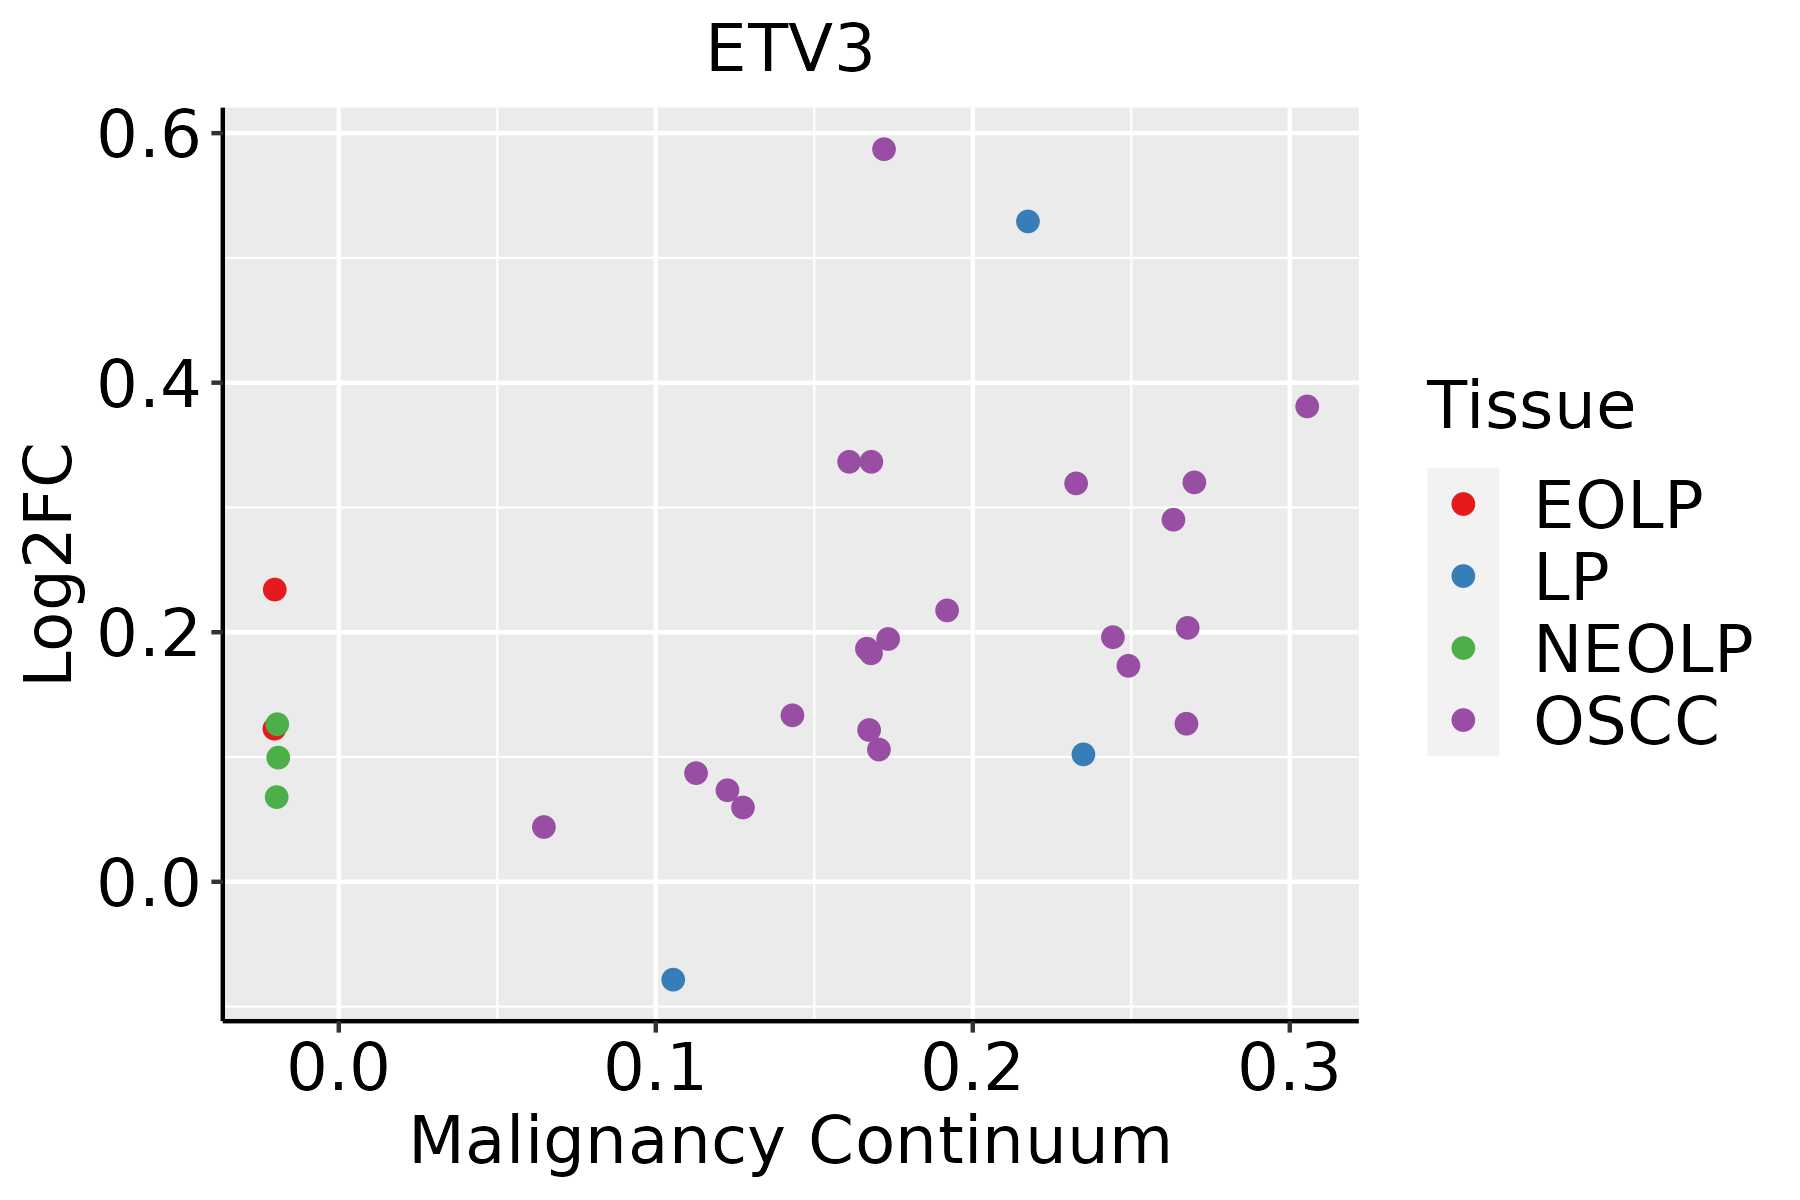 | EOLP: Erosive Oral lichen planus |
| LP: leukoplakia | ||
| NEOLP: Non-erosive oral lichen planus | ||
| OSCC: Oral squamous cell carcinoma | ||
| Prostate | 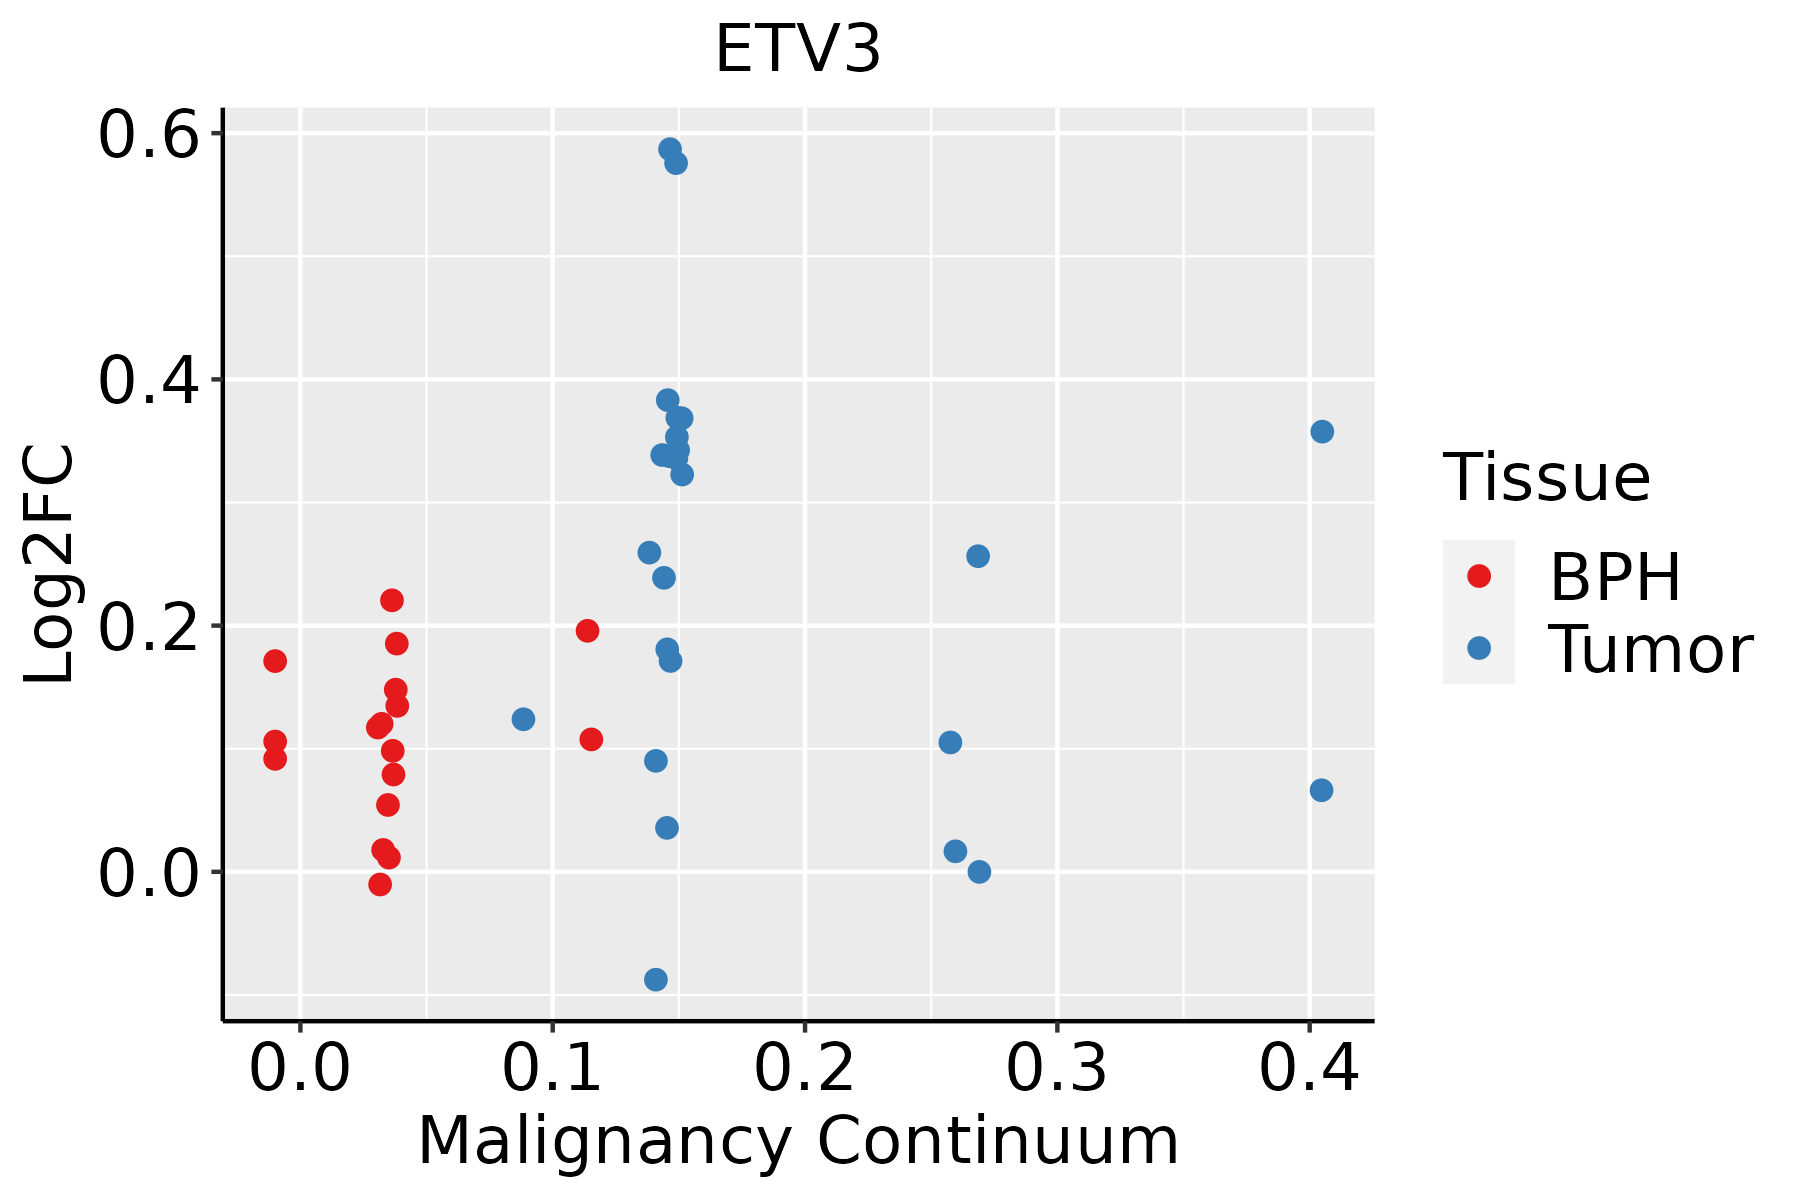 | BPH: Benign Prostatic Hyperplasia |
| ∗log2FC in expression of this searched gene in stem-like cells from each diseased tissue sample relative to stem-like cells in normal samples in each tissue plotted against the malignancy continuum. Samples are colored based on if they are from different disease stage. |
Top |
Malignant transformation related pathway analysis |
| Find out the enriched GO biological processes and KEGG pathways involved in transition from healthy to precancer to cancer |
| Tissue | Disease Stage | Enriched GO biological Processes |
| Colorectum | AD |  |
| Colorectum | SER |  |
| Colorectum | MSS |  |
| Colorectum | MSI-H |  |
| Colorectum | FAP |  |
| ∗Top 15 enriched GO BP terms are showed in the bar plot of each disease state in each tissue. Each row represents a significant GO biological process which is colored according to the -log10(p.adjust). |
| Page: 1 2 3 4 5 6 7 8 9 |
| GO ID | Tissue | Disease Stage | Description | Gene Ratio | Bg Ratio | pvalue | p.adjust | Count |
| Page: 1 |
| Pathway ID | Tissue | Disease Stage | Description | Gene Ratio | Bg Ratio | pvalue | p.adjust | qvalue | Count |
| Page: 1 |
Top |
Cell-cell communication analysis |
| Identification of potential cell-cell interactions between two cell types and their ligand-receptor pairs for different disease states |
| Ligand | Receptor | LRpair | Pathway | Tissue | Disease Stage |
| Page: 1 |
Top |
Single-cell gene regulatory network inference analysis |
| Find out the significant the regulons (TFs) and the target genes of each regulon across cell types for different disease states |
| TF | Cell Type | Tissue | Disease Stage | Target Gene | RSS | Regulon Activity |
| ETV3 | LUMP | Breast | Precancer | HEY1,PTGS2,ITPRIPL2, etc. | 1.89e-01 |  |
| ETV3 | CD8TRM | Breast | Healthy | IDO1,RFC5,LAMP3, etc. | 4.01e-01 |  |
| ETV3 | CD8TRM | Breast | Precancer | IDO1,RFC5,LAMP3, etc. | 5.18e-02 | |
| ETV3 | ICAF | Breast | Healthy | SLC38A5,FBLN7,ARHGEF10, etc. | 2.35e-01 | |
| ETV3 | ICAF | Breast | Precancer | SLC38A5,FBLN7,ARHGEF10, etc. | 3.92e-01 | |
| ETV3 | LYMEND | Colorectum | AD | RBBP8,TIAM1,ACOX1, etc. | 9.07e-02 |  |
| ETV3 | LYMEND | Colorectum | FAP | RBBP8,TIAM1,ACOX1, etc. | 7.93e-02 |  |
| ETV3 | LYMEND | Colorectum | Healthy | RBBP8,TIAM1,ACOX1, etc. | 8.48e-02 |  |
| ETV3 | MAIT | Liver | Cirrhotic | MS4A6A,EGR3,FKBP8, etc. | 3.36e-02 |  |
| ETV3 | DC | Liver | HCC | MS4A6A,EGR3,FKBP8, etc. | 4.67e-02 |  |
| ∗The dot plots of a searched regulon are shown for all cell subpopulations in each disease state of each tissue based on the regulon specific score inferred using pySCENIC and by calculating the average expression. |
| Page: 1 2 3 4 |
Top |
Somatic mutation of malignant transformation related genes |
| Annotation of somatic variants for genes involved in malignant transformation |
| Hugo Symbol | Variant Class | Variant Classification | dbSNP RS | HGVSc | HGVSp | HGVSp Short | SWISSPROT | BIOTYPE | SIFT | PolyPhen | Tumor Sample Barcode | Tissue | Histology | Sex | Age | Stage | Therapy Types | Drugs | Outcome |
| ETV3 | SNV | Missense_Mutation | novel | c.151N>T | p.Arg51Cys | p.R51C | P41162 | protein_coding | deleterious(0.01) | possibly_damaging(0.487) | TCGA-AN-A0FW-01 | Breast | breast invasive carcinoma | Female | >=65 | III/IV | Unknown | Unknown | SD |
| ETV3 | SNV | Missense_Mutation | c.34N>A | p.Glu12Lys | p.E12K | P41162 | protein_coding | tolerated_low_confidence(0.16) | benign(0.007) | TCGA-AN-A0XW-01 | Breast | breast invasive carcinoma | Female | <65 | III/IV | Unknown | Unknown | SD | |
| ETV3 | SNV | Missense_Mutation | c.445N>T | p.Arg149Trp | p.R149W | P41162 | protein_coding | deleterious(0.01) | possibly_damaging(0.908) | TCGA-AO-A128-01 | Breast | breast invasive carcinoma | Female | <65 | I/II | Chemotherapy | doxorubicin | SD | |
| ETV3 | SNV | Missense_Mutation | c.1075N>A | p.Val359Ile | p.V359I | P41162 | protein_coding | tolerated(0.43) | benign(0.013) | TCGA-AR-A256-01 | Breast | breast invasive carcinoma | Female | <65 | I/II | Chemotherapy | doxorubicin | PD | |
| ETV3 | insertion | Frame_Shift_Ins | novel | c.573_574insCATTTCC | p.Ser192HisfsTer12 | p.S192Hfs*12 | P41162 | protein_coding | TCGA-B6-A0I2-01 | Breast | breast invasive carcinoma | Female | <65 | I/II | Unknown | Unknown | SD | ||
| ETV3 | insertion | Frame_Shift_Ins | novel | c.573_574insCATTTCC | p.Ser192HisfsTer12 | p.S192Hfs*12 | P41162 | protein_coding | TCGA-B6-A0IE-01 | Breast | breast invasive carcinoma | Female | <65 | III/IV | Unknown | Unknown | PD | ||
| ETV3 | insertion | Frame_Shift_Ins | novel | c.28_29insC | p.Lys10ThrfsTer12 | p.K10Tfs*12 | P41162 | protein_coding | TCGA-D8-A1XC-01 | Breast | breast invasive carcinoma | Female | >=65 | III/IV | Unknown | Unknown | PD | ||
| ETV3 | insertion | In_Frame_Ins | novel | c.26_27insGGTGACATGTTTGAAAGAAAGAGAGTTGCATACGGAAAGAAG | p.Glu9_Lys10insValThrCysLeuLysGluArgGluLeuHisThrGluArgArg | p.E9_K10insVTCLKERELHTERR | P41162 | protein_coding | TCGA-D8-A1XC-01 | Breast | breast invasive carcinoma | Female | >=65 | III/IV | Unknown | Unknown | PD | ||
| ETV3 | deletion | Frame_Shift_Del | novel | c.1296delG | p.Trp432CysfsTer16 | p.W432Cfs*16 | P41162 | protein_coding | TCGA-D8-A27V-01 | Breast | breast invasive carcinoma | Female | <65 | I/II | Hormone Therapy | tamoxiphen | SD | ||
| ETV3 | SNV | Missense_Mutation | novel | c.913N>G | p.Gln305Glu | p.Q305E | P41162 | protein_coding | deleterious(0) | possibly_damaging(0.554) | TCGA-C5-A2LZ-01 | Cervix | cervical & endocervical cancer | Female | >=65 | III/IV | Unknown | Unknown | PD |
| Page: 1 2 3 4 5 6 |
Top |
Related drugs of malignant transformation related genes |
| Identification of chemicals and drugs interact with genes involved in malignant transfromation |
| (DGIdb 4.0) |
| Entrez ID | Symbol | Category | Interaction Types | Drug Claim Name | Drug Name | PMIDs |
| Page: 1 |

Copyright 2023-Present -The University of Texas Health Science Center at Houston |