
|
|||||
|
 | |
| |
| |
| |
| |
| |
|
Gene: ETV1 |
Gene summary for ETV1 |
| Gene information | Species | Human | Gene symbol | ETV1 | Gene ID | 2115 |
| Gene name | ETS variant transcription factor 1 | |
| Gene Alias | ER81 | |
| Cytomap | 7p21.2 | |
| Gene Type | protein-coding | GO ID | GO:0000902 | UniProtAcc | P50549 |
Top |
Malignant transformation analysis |
| Identification of the aberrant gene expression in precancerous and cancerous lesions by comparing the gene expression of stem-like cells in diseased tissues with normal stem cells |
| Entrez ID | Symbol | Replicates | Species | Organ | Tissue | Adj P-value | Log2FC | Malignancy |
| 2115 | ETV1 | HCC1_Meng | Human | Liver | HCC | 4.26e-45 | 3.83e-02 | 0.0246 |
| 2115 | ETV1 | HCC2_Meng | Human | Liver | HCC | 7.03e-09 | 2.85e-02 | 0.0107 |
| 2115 | ETV1 | S014 | Human | Liver | HCC | 2.21e-06 | 6.05e-01 | 0.2254 |
| 2115 | ETV1 | S015 | Human | Liver | HCC | 6.59e-10 | 7.56e-01 | 0.2375 |
| 2115 | ETV1 | S016 | Human | Liver | HCC | 2.70e-21 | 8.55e-01 | 0.2243 |
| 2115 | ETV1 | HTA12-15-2 | Human | Pancreas | PDAC | 5.98e-07 | 5.93e-01 | 0.2315 |
| 2115 | ETV1 | HTA12-23-1 | Human | Pancreas | PDAC | 4.10e-07 | 8.25e-01 | 0.3405 |
| 2115 | ETV1 | HTA12-25-1 | Human | Pancreas | PDAC | 2.96e-02 | 3.90e-01 | 0.313 |
| 2115 | ETV1 | HTA12-26-1 | Human | Pancreas | PDAC | 2.66e-13 | 7.19e-01 | 0.3728 |
| 2115 | ETV1 | HTA12-29-1 | Human | Pancreas | PDAC | 2.91e-41 | 9.28e-01 | 0.3722 |
| 2115 | ETV1 | HTA12-30-1 | Human | Pancreas | PDAC | 1.20e-02 | 9.99e-01 | 0.3671 |
| 2115 | ETV1 | male-WTA | Human | Thyroid | PTC | 6.66e-21 | 1.33e-01 | 0.1037 |
| 2115 | ETV1 | PTC01 | Human | Thyroid | PTC | 1.12e-18 | 2.06e-01 | 0.1899 |
| 2115 | ETV1 | PTC04 | Human | Thyroid | PTC | 5.11e-04 | 2.05e-01 | 0.1927 |
| 2115 | ETV1 | PTC05 | Human | Thyroid | PTC | 6.15e-11 | 4.48e-01 | 0.2065 |
| 2115 | ETV1 | PTC06 | Human | Thyroid | PTC | 1.06e-22 | 6.13e-01 | 0.2057 |
| 2115 | ETV1 | PTC07 | Human | Thyroid | PTC | 8.82e-37 | 6.45e-01 | 0.2044 |
| 2115 | ETV1 | ATC12 | Human | Thyroid | ATC | 2.89e-22 | 6.62e-01 | 0.34 |
| 2115 | ETV1 | ATC13 | Human | Thyroid | ATC | 1.40e-04 | 1.06e-01 | 0.34 |
| 2115 | ETV1 | ATC4 | Human | Thyroid | ATC | 8.63e-28 | 8.20e-01 | 0.34 |
| Page: 1 2 |
| Tissue | Expression Dynamics | Abbreviation |
| Liver | 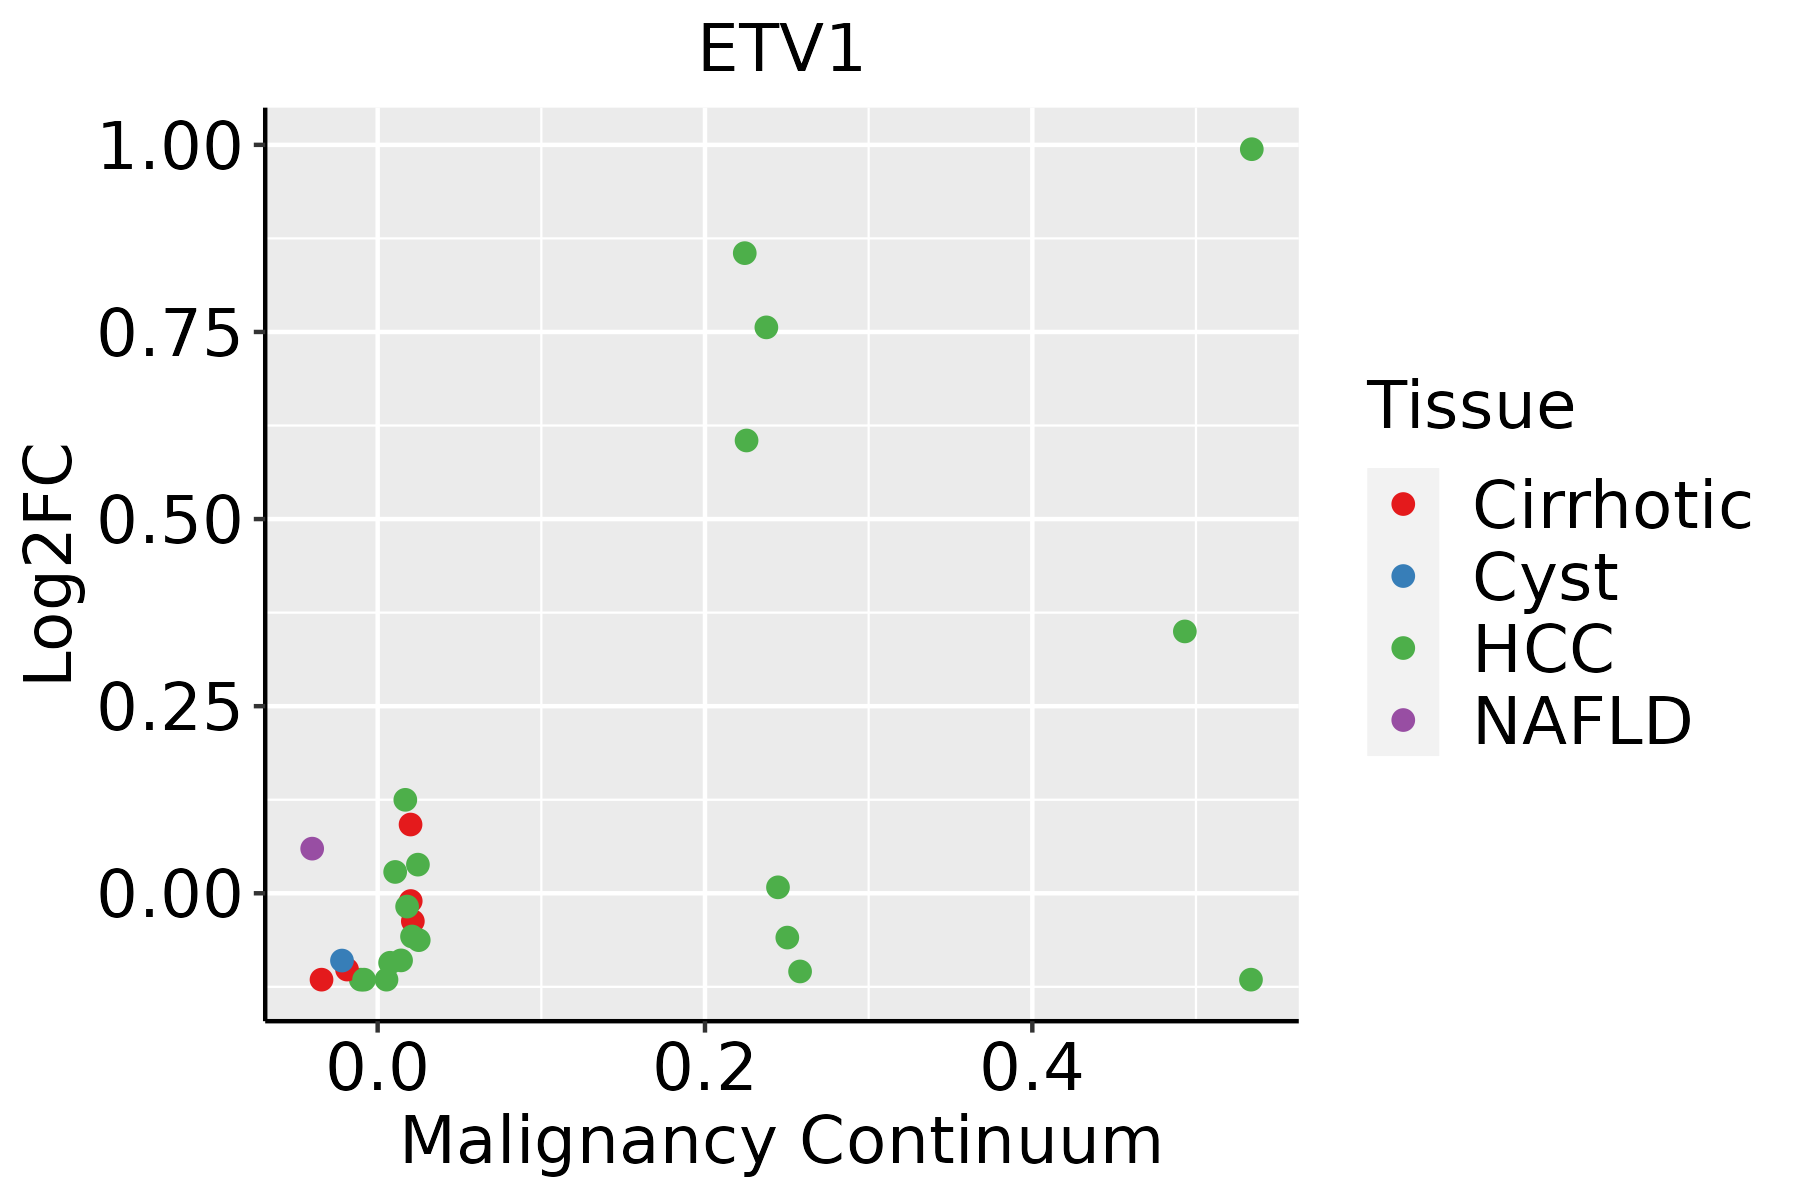 | HCC: Hepatocellular carcinoma |
| NAFLD: Non-alcoholic fatty liver disease | ||
| Thyroid | 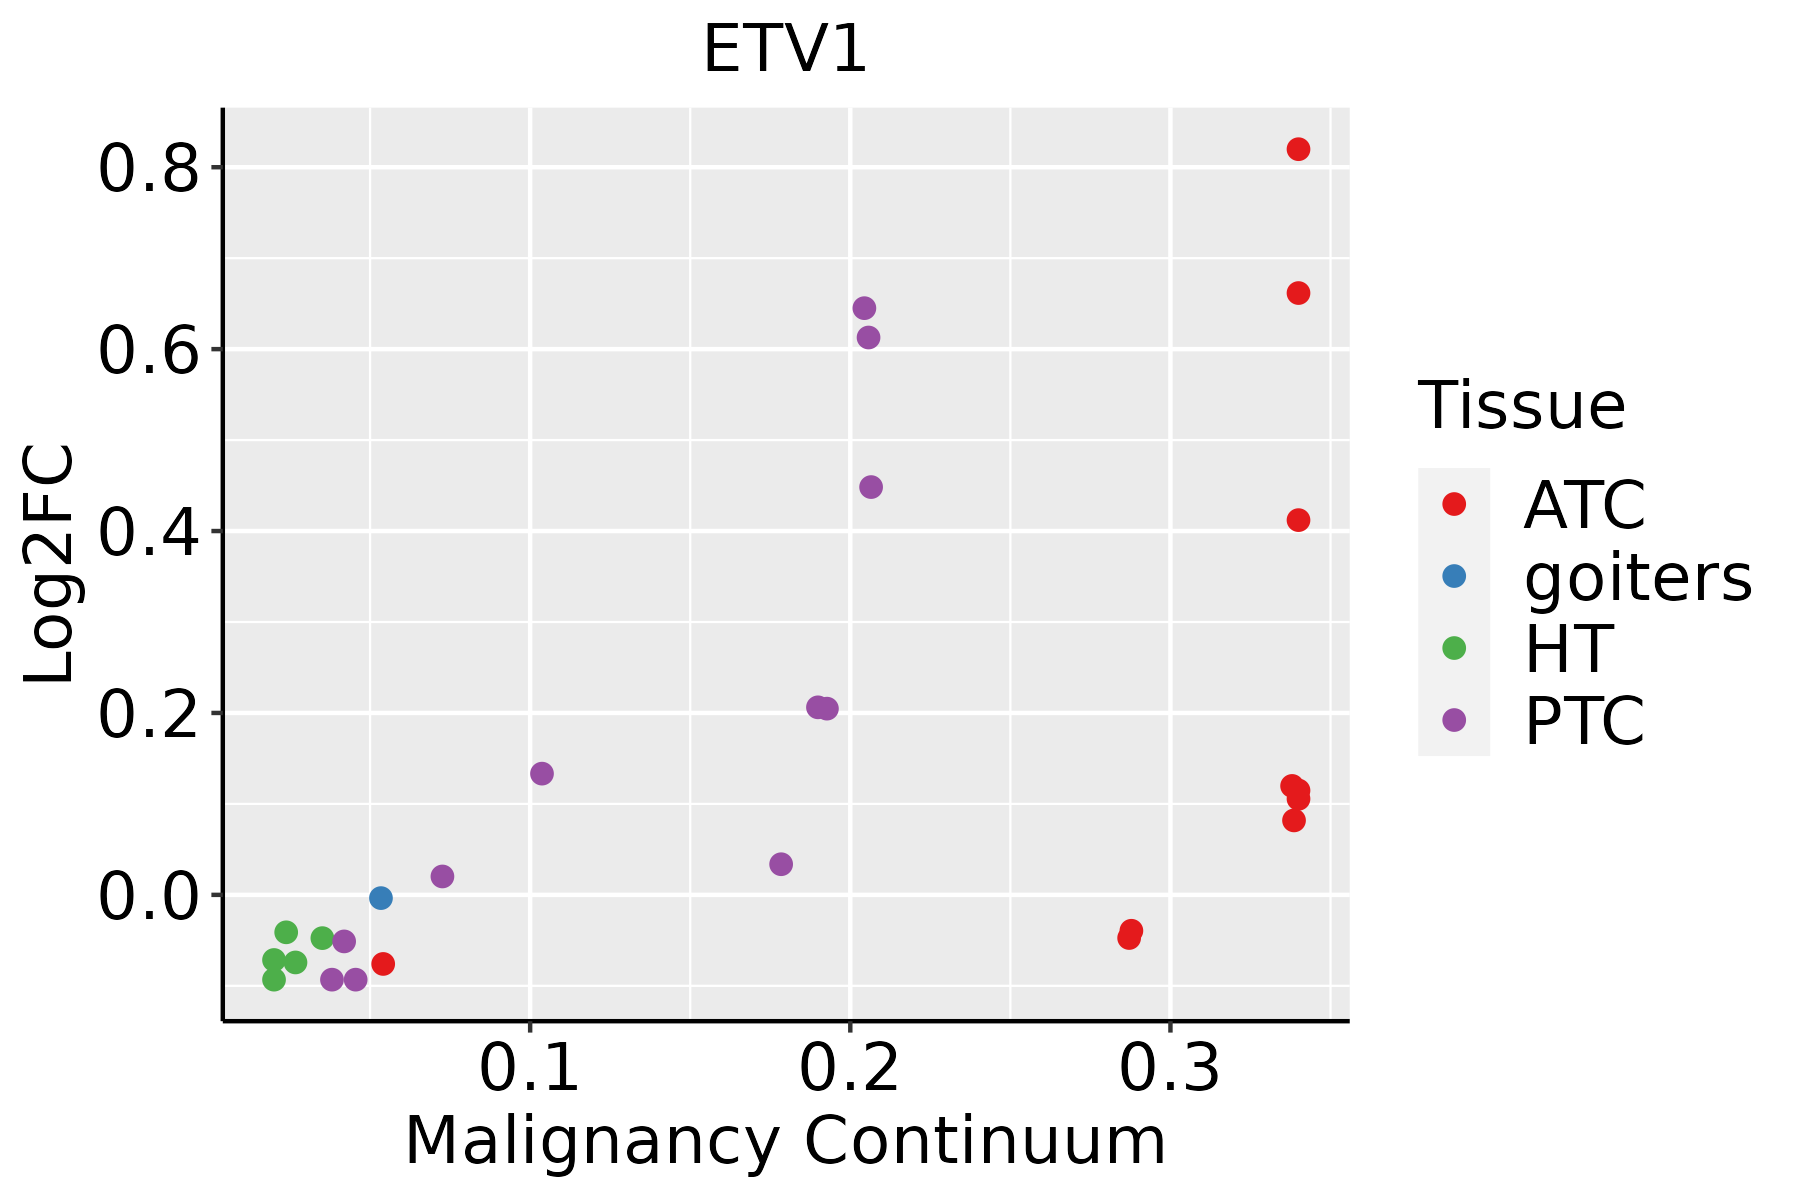 | ATC: Anaplastic thyroid cancer |
| HT: Hashimoto's thyroiditis | ||
| PTC: Papillary thyroid cancer |
| ∗log2FC in expression of this searched gene in stem-like cells from each diseased tissue sample relative to stem-like cells in normal samples in each tissue plotted against the malignancy continuum. Samples are colored based on if they are from different disease stage. |
Top |
Malignant transformation related pathway analysis |
| Find out the enriched GO biological processes and KEGG pathways involved in transition from healthy to precancer to cancer |
| Tissue | Disease Stage | Enriched GO biological Processes |
| Colorectum | AD |  |
| Colorectum | SER |  |
| Colorectum | MSS |  |
| Colorectum | MSI-H |  |
| Colorectum | FAP |  |
| ∗Top 15 enriched GO BP terms are showed in the bar plot of each disease state in each tissue. Each row represents a significant GO biological process which is colored according to the -log10(p.adjust). |
| Page: 1 2 3 4 5 6 7 8 9 |
| GO ID | Tissue | Disease Stage | Description | Gene Ratio | Bg Ratio | pvalue | p.adjust | Count |
| GO:00096124 | Liver | HCC | response to mechanical stimulus | 113/7958 | 216/18723 | 2.20e-03 | 1.10e-02 | 113 |
| GO:006156419 | Thyroid | PTC | axon development | 199/5968 | 467/18723 | 5.27e-07 | 8.53e-06 | 199 |
| GO:000740918 | Thyroid | PTC | axonogenesis | 178/5968 | 418/18723 | 2.17e-06 | 2.91e-05 | 178 |
| GO:0009612110 | Thyroid | PTC | response to mechanical stimulus | 98/5968 | 216/18723 | 2.09e-05 | 2.09e-04 | 98 |
| GO:006156423 | Thyroid | ATC | axon development | 220/6293 | 467/18723 | 6.85e-10 | 1.80e-08 | 220 |
| GO:000740919 | Thyroid | ATC | axonogenesis | 197/6293 | 418/18723 | 5.09e-09 | 1.13e-07 | 197 |
| GO:000961225 | Thyroid | ATC | response to mechanical stimulus | 105/6293 | 216/18723 | 3.29e-06 | 3.70e-05 | 105 |
| GO:000751716 | Thyroid | ATC | muscle organ development | 139/6293 | 327/18723 | 4.45e-04 | 2.64e-03 | 139 |
| GO:00074113 | Thyroid | ATC | axon guidance | 96/6293 | 227/18723 | 3.74e-03 | 1.63e-02 | 96 |
| GO:00974853 | Thyroid | ATC | neuron projection guidance | 96/6293 | 228/18723 | 4.36e-03 | 1.81e-02 | 96 |
| Page: 1 |
| Pathway ID | Tissue | Disease Stage | Description | Gene Ratio | Bg Ratio | pvalue | p.adjust | qvalue | Count |
| Page: 1 |
Top |
Cell-cell communication analysis |
| Identification of potential cell-cell interactions between two cell types and their ligand-receptor pairs for different disease states |
| Ligand | Receptor | LRpair | Pathway | Tissue | Disease Stage |
| Page: 1 |
Top |
Single-cell gene regulatory network inference analysis |
| Find out the significant the regulons (TFs) and the target genes of each regulon across cell types for different disease states |
| TF | Cell Type | Tissue | Disease Stage | Target Gene | RSS | Regulon Activity |
| ETV1 | NK | Cervix | CC | AQP1,MGP,VCAM1, etc. | 2.48e-01 |  |
| ETV1 | NK | Cervix | HSIL_HPV | AQP1,MGP,VCAM1, etc. | 1.05e-01 |  |
| ETV1 | M2MAC | Esophagus | ADJ | ANKRD22,ETS2,VPS72, etc. | 5.77e-01 |  |
| ETV1 | NK | Esophagus | ESCC | ANKRD22,ETS2,VPS72, etc. | 5.59e-02 |  |
| ETV1 | M2MAC | Esophagus | ESCC | ANKRD22,ETS2,VPS72, etc. | 4.77e-01 | |
| ETV1 | ICAF | Esophagus | Healthy | AEBP1,MMP11,CMTM3, etc. | 1.35e-01 |  |
| ETV1 | CD8TEREX | Oral cavity | EOLP | TFF3,GOLM1,SLC12A2, etc. | 1.22e-01 |  |
| ETV1 | CD8TEXINT | Oral cavity | NEOLP | TFF3,GOLM1,SLC12A2, etc. | 1.80e-01 |  |
| ETV1 | EE | Stomach | ADJ | SLC7A11,KCNMB2,ELL2, etc. | 1.66e-01 |  |
| ETV1 | EE | Stomach | CAG | SLC7A11,KCNMB2,ELL2, etc. | 1.03e-01 |  |
| ∗The dot plots of a searched regulon are shown for all cell subpopulations in each disease state of each tissue based on the regulon specific score inferred using pySCENIC and by calculating the average expression. |
| Page: 1 2 |
Top |
Somatic mutation of malignant transformation related genes |
| Annotation of somatic variants for genes involved in malignant transformation |
| Hugo Symbol | Variant Class | Variant Classification | dbSNP RS | HGVSc | HGVSp | HGVSp Short | SWISSPROT | BIOTYPE | SIFT | PolyPhen | Tumor Sample Barcode | Tissue | Histology | Sex | Age | Stage | Therapy Types | Drugs | Outcome |
| ETV1 | SNV | Missense_Mutation | novel | c.248N>C | p.Gly83Ala | p.G83A | P50549 | protein_coding | tolerated(0.69) | benign(0.031) | TCGA-A2-A04P-01 | Breast | breast invasive carcinoma | Female | <65 | III/IV | Chemotherapy | taxol | PD |
| ETV1 | SNV | Missense_Mutation | c.1172G>T | p.Arg391Leu | p.R391L | P50549 | protein_coding | deleterious(0) | probably_damaging(0.964) | TCGA-A7-A4SE-01 | Breast | breast invasive carcinoma | Female | <65 | I/II | Chemotherapy | adriamycin | CR | |
| ETV1 | SNV | Missense_Mutation | rs748346103 | c.559C>T | p.Arg187Cys | p.R187C | P50549 | protein_coding | tolerated(0.07) | probably_damaging(0.959) | TCGA-AN-A046-01 | Breast | breast invasive carcinoma | Female | >=65 | I/II | Unknown | Unknown | SD |
| ETV1 | SNV | Missense_Mutation | c.1105N>C | p.Glu369Gln | p.E369Q | P50549 | protein_coding | deleterious(0.03) | probably_damaging(1) | TCGA-AR-A0TU-01 | Breast | breast invasive carcinoma | Female | <65 | I/II | Unspecific | Doxorubicin | SD | |
| ETV1 | SNV | Missense_Mutation | c.1198G>A | p.Gly400Arg | p.G400R | P50549 | protein_coding | deleterious(0) | probably_damaging(0.996) | TCGA-AR-A1AL-01 | Breast | breast invasive carcinoma | Female | <65 | III/IV | Hormone Therapy | anastrozole | SD | |
| ETV1 | SNV | Missense_Mutation | rs762835509 | c.341G>C | p.Gly114Ala | p.G114A | P50549 | protein_coding | tolerated(0.06) | probably_damaging(0.986) | TCGA-BH-A0HP-01 | Breast | breast invasive carcinoma | Female | >=65 | III/IV | Chemotherapy | doxorubicin | SD |
| ETV1 | SNV | Missense_Mutation | novel | c.1192N>C | p.Glu398Gln | p.E398Q | P50549 | protein_coding | deleterious(0) | probably_damaging(1) | TCGA-LL-A6FR-01 | Breast | breast invasive carcinoma | Female | <65 | I/II | Chemotherapy | adriamycin | SD |
| ETV1 | SNV | Missense_Mutation | rs771840153 | c.1363N>A | p.Glu455Lys | p.E455K | P50549 | protein_coding | deleterious(0.01) | possibly_damaging(0.573) | TCGA-MA-AA42-01 | Cervix | cervical & endocervical cancer | Female | >=65 | I/II | Unknown | Unknown | SD |
| ETV1 | SNV | Missense_Mutation | c.782G>A | p.Arg261Lys | p.R261K | P50549 | protein_coding | tolerated(0.19) | possibly_damaging(0.876) | TCGA-Q1-A73O-01 | Cervix | cervical & endocervical cancer | Female | <65 | I/II | Chemotherapy | cisplatin | CR | |
| ETV1 | SNV | Missense_Mutation | novel | c.8N>A | p.Gly3Glu | p.G3E | P50549 | protein_coding | deleterious(0.01) | possibly_damaging(0.765) | TCGA-VS-A9UZ-01 | Cervix | cervical & endocervical cancer | Female | <65 | I/II | Unknown | Unknown | SD |
| Page: 1 2 3 4 5 6 7 8 |
Top |
Related drugs of malignant transformation related genes |
| Identification of chemicals and drugs interact with genes involved in malignant transfromation |
| (DGIdb 4.0) |
| Entrez ID | Symbol | Category | Interaction Types | Drug Claim Name | Drug Name | PMIDs |
| 2115 | ETV1 | DRUG RESISTANCE, CLINICALLY ACTIONABLE, TRANSCRIPTION FACTOR | TRAMETINIB | TRAMETINIB | 28178529 |
| Page: 1 |

Copyright 2023-Present -The University of Texas Health Science Center at Houston |