Schematic overview of the cellular and molecular mechanisms involved in the cancer progression, including the proposed cellular and molecular mechanisms in cancer cells trajectory. AT1: alveolar type 1 cells; AT2: alveolar type 2 cells; AAH: atypical adenomatous hyperplasia; AIS: adenocarcinoma in situ; MIA: minimally invasive adenocarcinoma; IA: invasive adenocarcinoma; EMT: epithelial-mesenchymal transition

Home

Download

Statistics

Help

Contact

Center for Computational Systems Medicine
leaf

Gene summary

leaf

Malignant transformation analysis

leaf

Malignant transformation related pathway analysis

leaf

Cell-cell communication analysis

leaf

Single-cell gene regulatory network inference analysis

leaf

Somatic mutation of malignant transformation related genes

leaf

Related drugs of malignant transformation related genes

Gene: ETS2

Gene summary for ETS2

check button Gene summary.

Gene informationSpeciesHuman
Gene symbol

ETS2

Gene ID

2114

Gene nameETS proto-oncogene 2, transcription factor
Gene AliasETS2IT1
Cytomap21q22.2
Gene Typeprotein-coding
GO ID

GO:0000122

UniProtAcc

P15036


Top

Malignant transformation analysis

check button Identification of the aberrant gene expression in precancerous and cancerous lesions by comparing the gene expression of stem-like cells in diseased tissues with normal stem cells
check button Malignant transformation involving gene list.
Entrez IDSymbolReplicatesSpeciesOrganTissueAdj P-valueLog2FCMalignancy
2114ETS2CA_HPV_2HumanCervixCC1.13e-053.26e-010.0391
2114ETS2CA_HPV_3HumanCervixCC1.78e-102.96e-010.0414
2114ETS2N_HPV_2HumanCervixN_HPV3.54e-073.13e-01-0.0131
2114ETS2CCI_1HumanCervixCC3.66e-067.43e-010.528
2114ETS2CCI_2HumanCervixCC5.77e-121.23e+000.5249
2114ETS2CCI_3HumanCervixCC5.79e-037.13e-010.516
2114ETS2CCII_1HumanCervixCC2.68e-054.40e-010.3249
2114ETS2sample1HumanCervixCC1.19e-249.07e-010.0959
2114ETS2sample3HumanCervixCC3.05e-114.41e-010.1387
2114ETS2T1HumanCervixCC1.86e-489.71e-010.0918
2114ETS2T2HumanCervixCC1.97e-035.48e-010.0709
2114ETS2T3HumanCervixCC3.45e-144.29e-010.1389
2114ETS2HTA11_3410_2000001011HumanColorectumAD8.44e-052.60e-010.0155
2114ETS2HTA11_7862_2000001011HumanColorectumAD1.44e-036.68e-01-0.0179
2114ETS2HTA11_866_3004761011HumanColorectumAD1.02e-311.21e+000.096
2114ETS2HTA11_4255_2000001011HumanColorectumSER3.41e-036.59e-010.0446
2114ETS2HTA11_7663_2000001011HumanColorectumSER6.20e-091.09e+000.0131
2114ETS2HTA11_7696_3000711011HumanColorectumAD1.02e-148.94e-010.0674
2114ETS2HTA11_6818_2000001011HumanColorectumAD8.61e-067.93e-010.0112
2114ETS2HTA11_6818_2000001021HumanColorectumAD4.10e-128.69e-010.0588
Page: 1 2 3 4 5 6 7 8 9 10 11 

check button Transcriptomic changes along malignancy continuum.
TissueExpression DynamicsAbbreviation
CervixThe image shows the transcriptomic changes along malignancy continuum.log2FC in expression of this searched gene in stem-like cells from each diseased tissue sample relative to stem-like cells in normal samples in each tissue plotted against the malignancy continuum. Samples are colored based on if they are from different disease stage.CC: Cervix cancer
HSIL_HPV: HPV-infected high-grade squamous intraepithelial lesions
N_HPV: HPV-infected normal cervix
Colorectum (GSE201348)The image shows the transcriptomic changes along malignancy continuum.log2FC in expression of this searched gene in stem-like cells from each diseased tissue sample relative to stem-like cells in normal samples in each tissue plotted against the malignancy continuum. Samples are colored based on if they are from different disease stage.FAP: Familial adenomatous polyposis
CRC: Colorectal cancer
Colorectum (HTA11)The image shows the transcriptomic changes along malignancy continuum.log2FC in expression of this searched gene in stem-like cells from each diseased tissue sample relative to stem-like cells in normal samples in each tissue plotted against the malignancy continuum. Samples are colored based on if they are from different disease stage.AD: Adenomas
SER: Sessile serrated lesions
MSI-H: Microsatellite-high colorectal cancer
MSS: Microsatellite stable colorectal cancer
EsophagusThe image shows the transcriptomic changes along malignancy continuum.log2FC in expression of this searched gene in stem-like cells from each diseased tissue sample relative to stem-like cells in normal samples in each tissue plotted against the malignancy continuum. Samples are colored based on if they are from different disease stage.
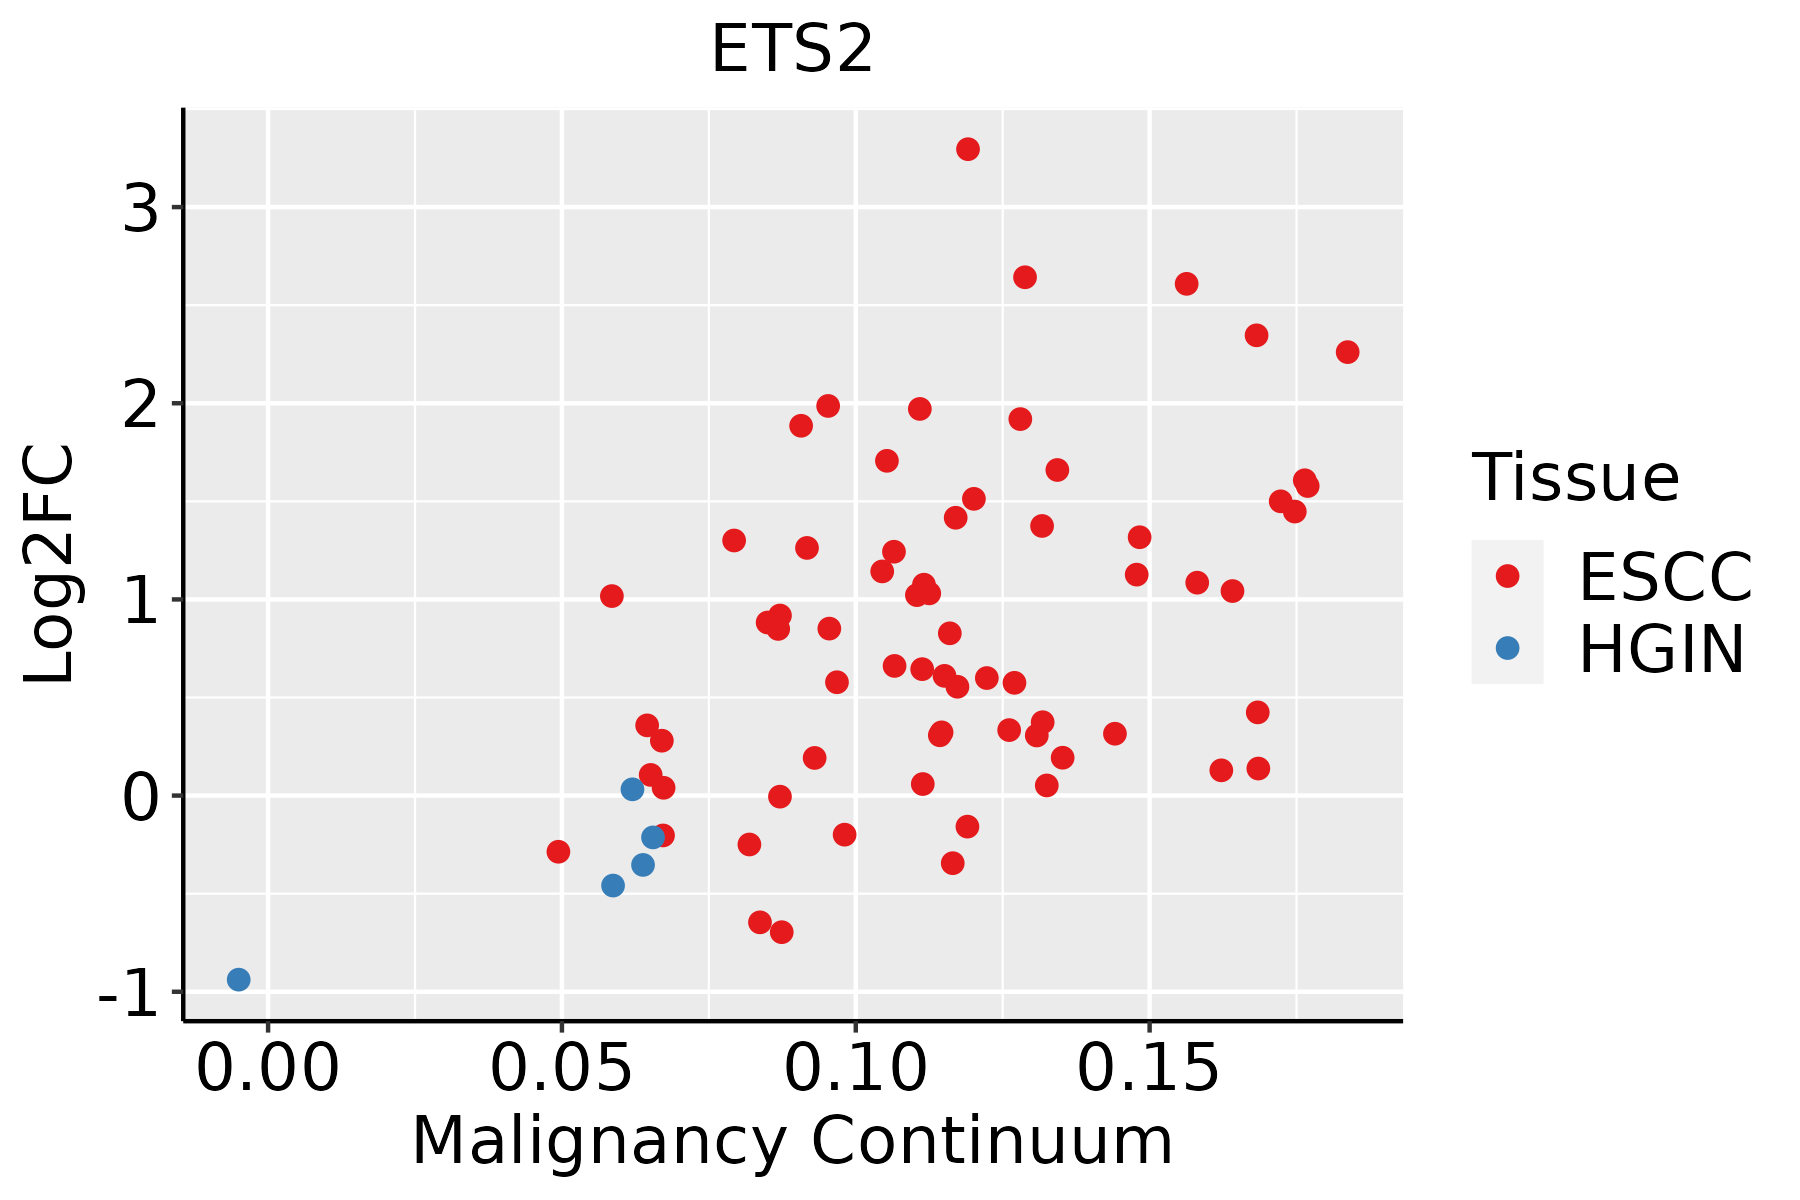
ESCC: Esophageal squamous cell carcinoma
HGIN: High-grade intraepithelial neoplasias
LGIN: Low-grade intraepithelial neoplasias
GCThe image shows the transcriptomic changes along malignancy continuum.log2FC in expression of this searched gene in stem-like cells from each diseased tissue sample relative to stem-like cells in normal samples in each tissue plotted against the malignancy continuum. Samples are colored based on if they are from different disease stage.CAG: Chronic atrophic gastritis
CAG with IM: Chronic atrophic gastritis with intestinal metaplasia
CSG: Chronic superficial gastritis
GC: Gastric cancer
SIM: Severe intestinal metaplasia
WIM: Wild intestinal metaplasia
LiverThe image shows the transcriptomic changes along malignancy continuum.log2FC in expression of this searched gene in stem-like cells from each diseased tissue sample relative to stem-like cells in normal samples in each tissue plotted against the malignancy continuum. Samples are colored based on if they are from different disease stage.
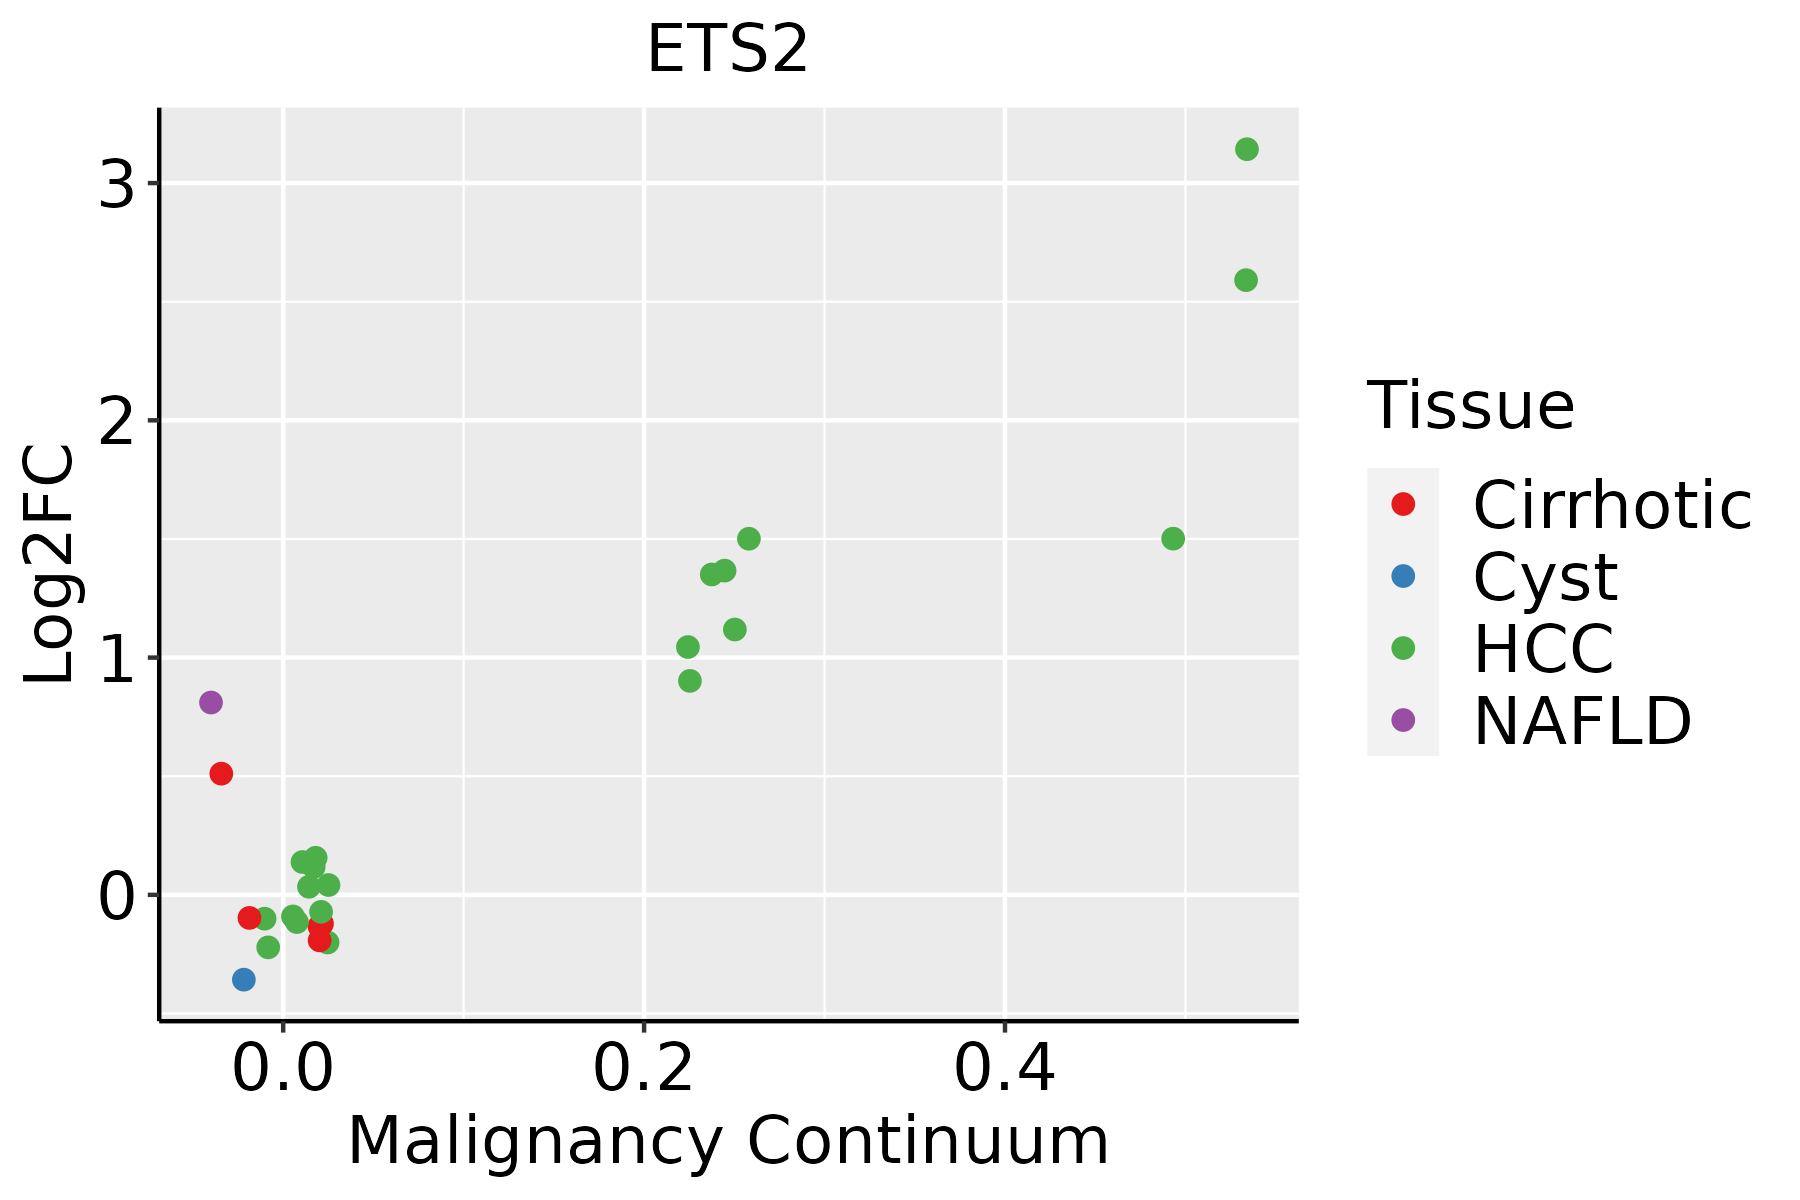
HCC: Hepatocellular carcinoma
NAFLD: Non-alcoholic fatty liver disease
Oral CavityThe image shows the transcriptomic changes along malignancy continuum.log2FC in expression of this searched gene in stem-like cells from each diseased tissue sample relative to stem-like cells in normal samples in each tissue plotted against the malignancy continuum. Samples are colored based on if they are from different disease stage.
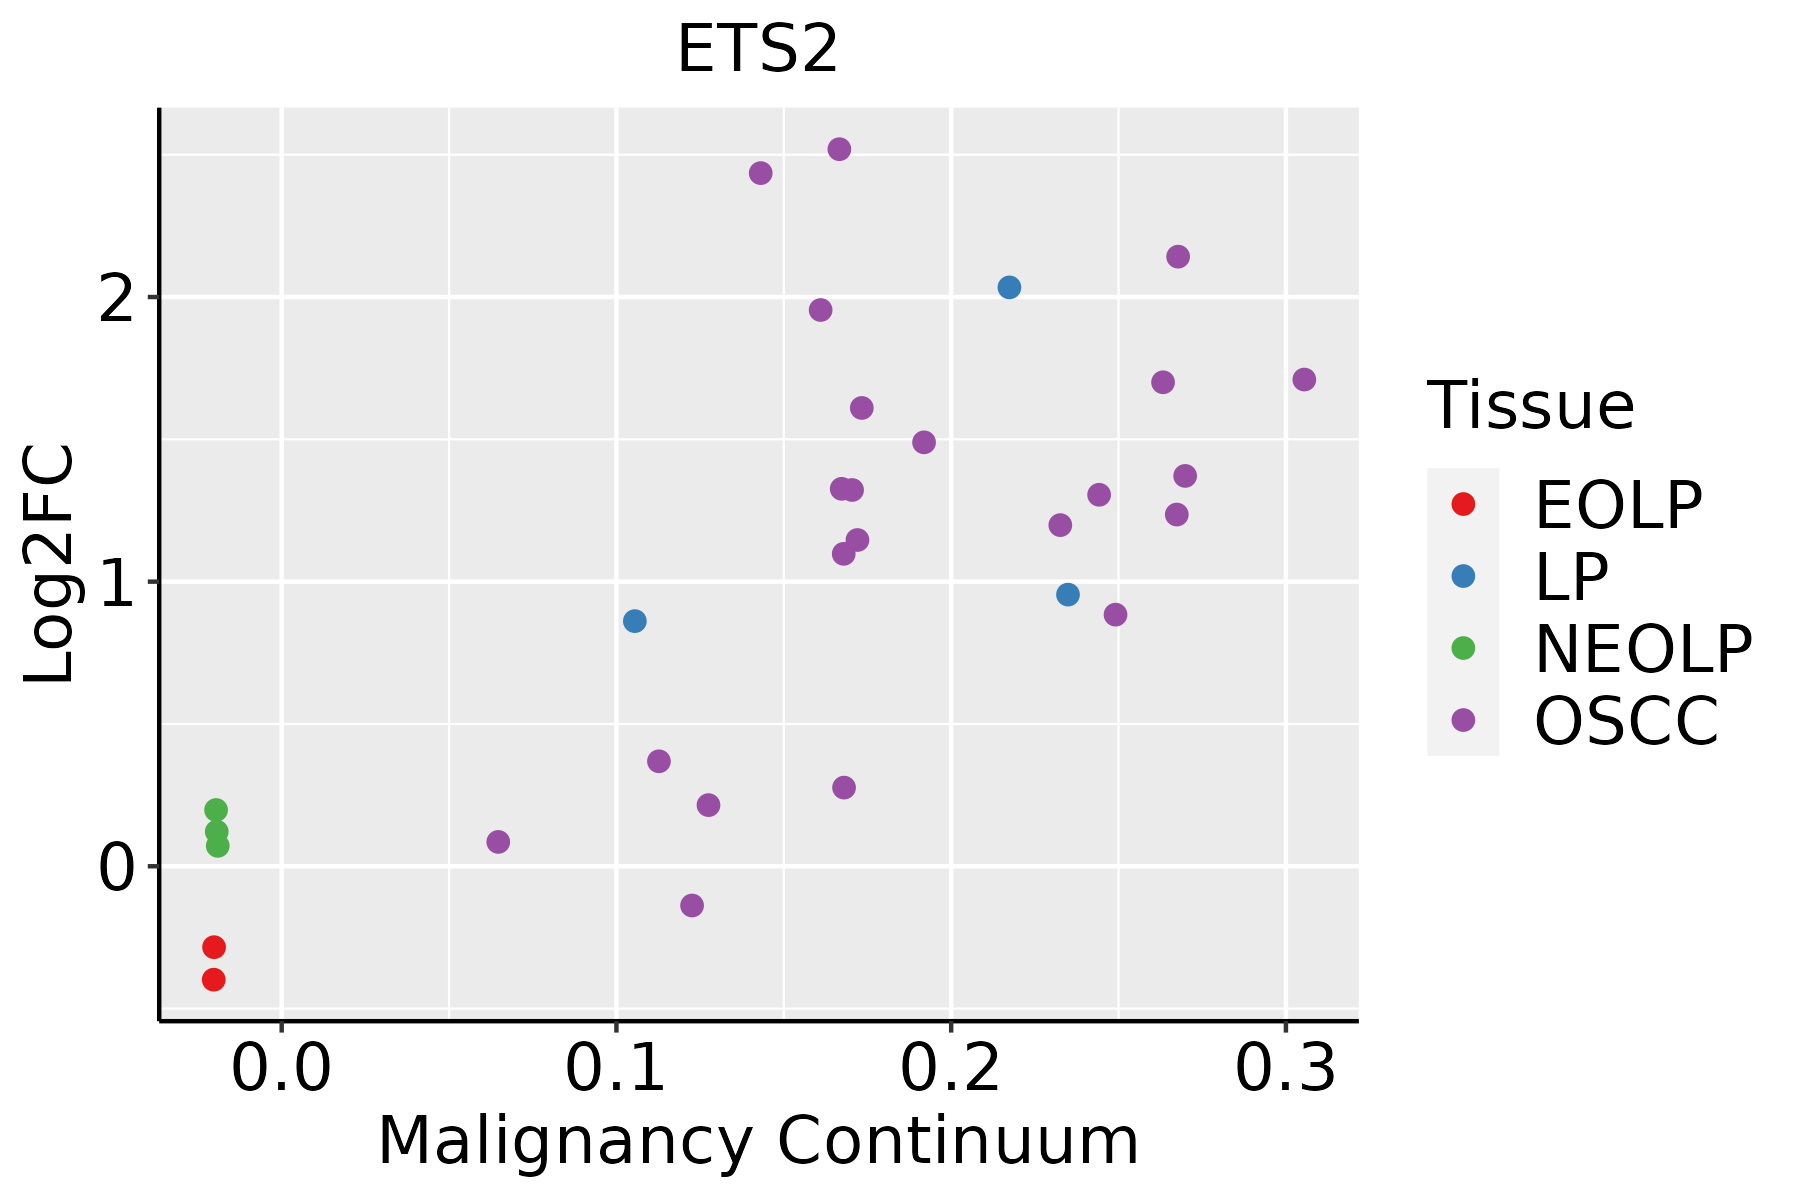
EOLP: Erosive Oral lichen planus
LP: leukoplakia
NEOLP: Non-erosive oral lichen planus
OSCC: Oral squamous cell carcinoma
ProstateThe image shows the transcriptomic changes along malignancy continuum.log2FC in expression of this searched gene in stem-like cells from each diseased tissue sample relative to stem-like cells in normal samples in each tissue plotted against the malignancy continuum. Samples are colored based on if they are from different disease stage.
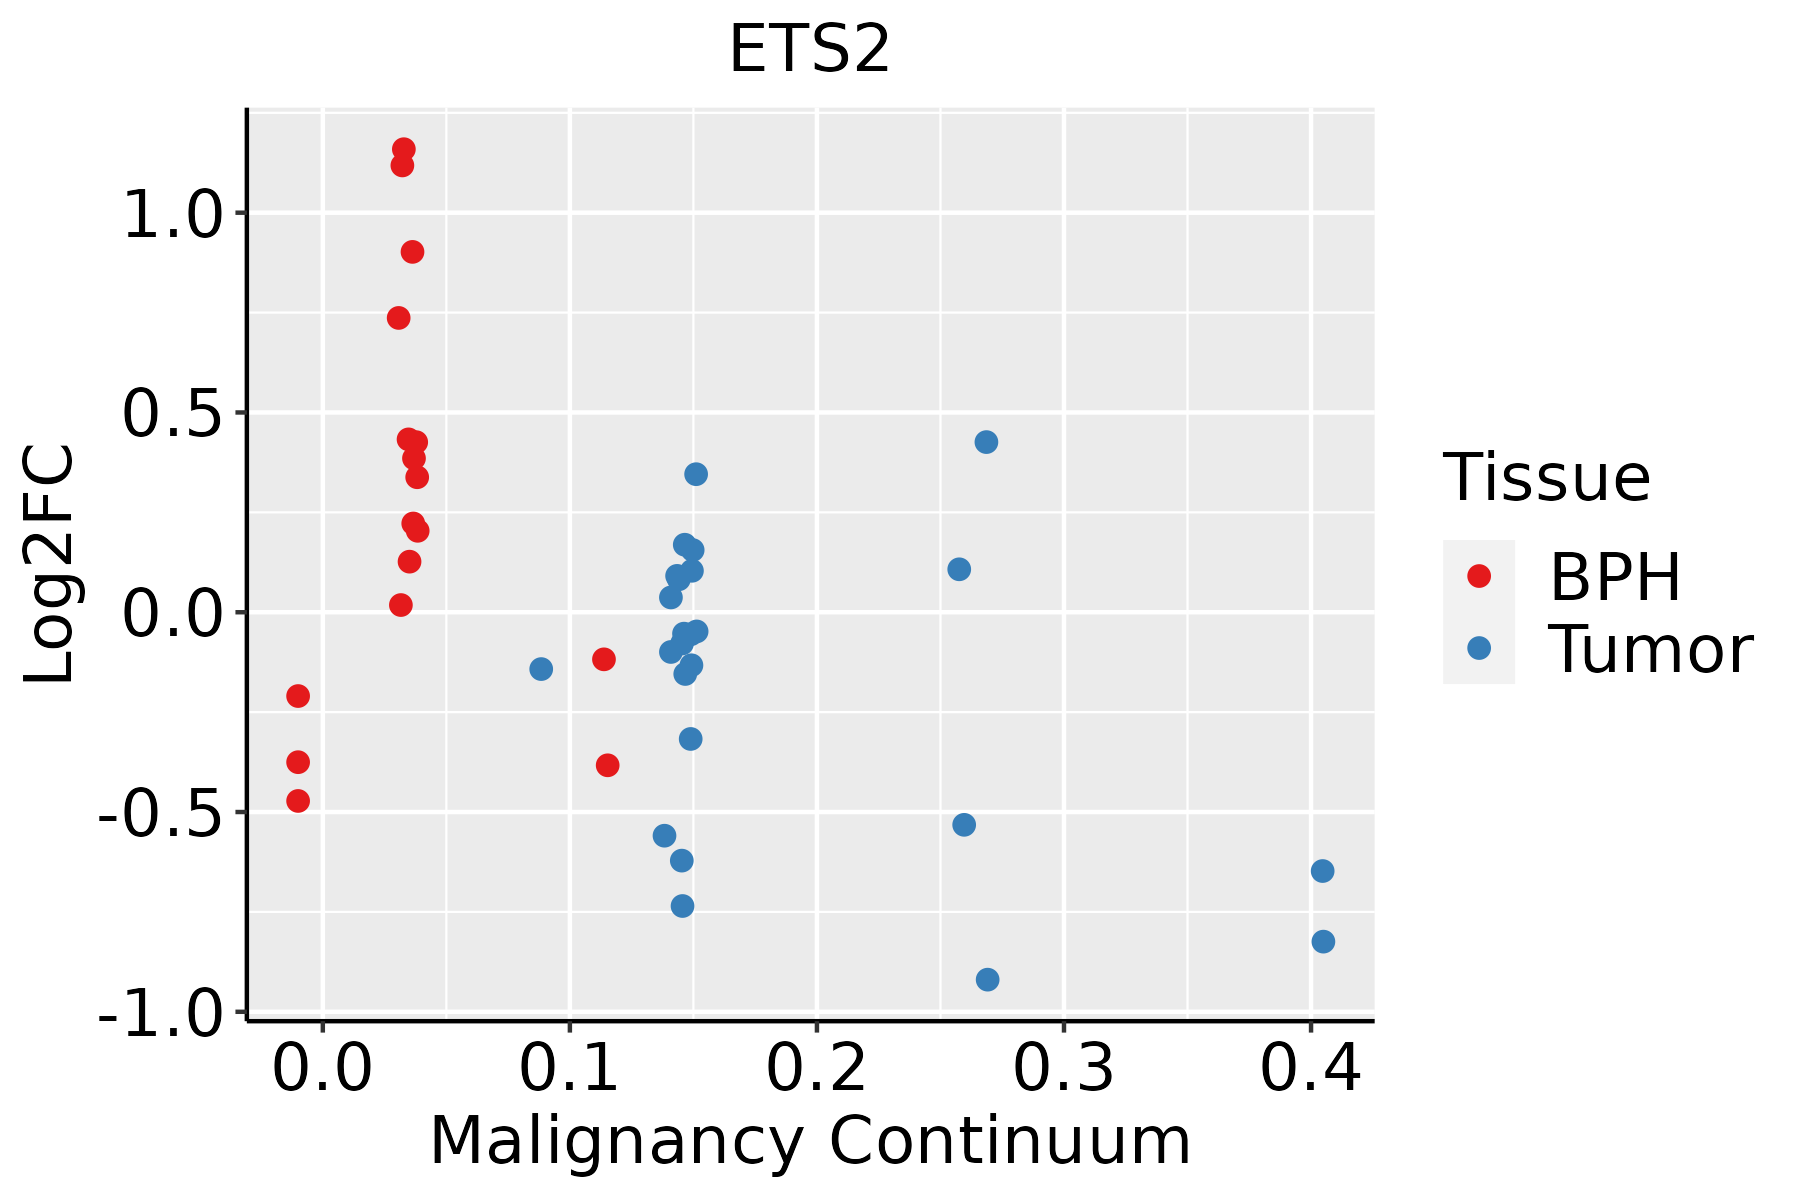
BPH: Benign Prostatic Hyperplasia
SkinThe image shows the transcriptomic changes along malignancy continuum.log2FC in expression of this searched gene in stem-like cells from each diseased tissue sample relative to stem-like cells in normal samples in each tissue plotted against the malignancy continuum. Samples are colored based on if they are from different disease stage.AK: Actinic keratosis
cSCC: Cutaneous squamous cell carcinoma
SCCIS:squamous cell carcinoma in situ
ThyroidThe image shows the transcriptomic changes along malignancy continuum.log2FC in expression of this searched gene in stem-like cells from each diseased tissue sample relative to stem-like cells in normal samples in each tissue plotted against the malignancy continuum. Samples are colored based on if they are from different disease stage.ATC: Anaplastic thyroid cancer
HT: Hashimoto's thyroiditis
PTC: Papillary thyroid cancer
∗log2FC in expression of this searched gene in stem-like cells from each diseased tissue sample relative to stem-like cells in normal samples in each tissue plotted against the malignancy continuum. Samples are colored based on if they are from different disease stage.

Top

Malignant transformation related pathway analysis

check buttonFind out the enriched GO biological processes and KEGG pathways involved in transition from healthy to precancer to cancer
check button Figure of enriched GO biological processes.
TissueDisease StageEnriched GO biological Processes
ColorectumADGO analysis - Figure of enriched GO biological processes: Top 15 enriched GO BP terms are showed in the bar plot of each disease state in each tissue. Each row represents a significant GO biological process which is colored according to the -log10(p.adjust).
ColorectumSERGO analysis - Figure of enriched GO biological processes: Top 15 enriched GO BP terms are showed in the bar plot of each disease state in each tissue. Each row represents a significant GO biological process which is colored according to the -log10(p.adjust).
ColorectumMSSGO analysis - Figure of enriched GO biological processes: Top 15 enriched GO BP terms are showed in the bar plot of each disease state in each tissue. Each row represents a significant GO biological process which is colored according to the -log10(p.adjust).
ColorectumMSI-HGO analysis - Figure of enriched GO biological processes: Top 15 enriched GO BP terms are showed in the bar plot of each disease state in each tissue. Each row represents a significant GO biological process which is colored according to the -log10(p.adjust).
ColorectumFAPGO analysis - Figure of enriched GO biological processes: Top 15 enriched GO BP terms are showed in the bar plot of each disease state in each tissue. Each row represents a significant GO biological process which is colored according to the -log10(p.adjust).
∗Top 15 enriched GO BP terms are showed in the bar plot of each disease state in each tissue. Each row represents a significant GO biological process which is colored according to the -log10(p.adjust).
Page: 1 2 3 4 5 6 7 8 9 

check button Enriched GO biological processes.
GO IDTissueDisease StageDescriptionGene RatioBg Ratiopvaluep.adjustCount
GO:00073695CervixCCgastrulation42/2311185/187235.83e-058.46e-0442
GO:0001704CervixCCformation of primary germ layer27/2311121/187231.49e-031.16e-0227
GO:0007369ColorectumADgastrulation53/3918185/187237.60e-034.60e-0253
GO:00073691ColorectumSERgastrulation43/2897185/187233.44e-032.92e-0243
GO:00073692ColorectumFAPgastrulation42/2622185/187238.97e-049.10e-0342
GO:0009952ColorectumFAPanterior/posterior pattern specification41/2622201/187237.82e-034.63e-0241
GO:00073693ColorectumCRCgastrulation36/2078185/187235.54e-047.70e-0336
GO:00099521ColorectumCRCanterior/posterior pattern specification36/2078201/187232.56e-032.40e-0236
GO:00073698EsophagusESCCgastrulation115/8552185/187234.35e-064.64e-05115
GO:00017044EsophagusESCCformation of primary germ layer75/8552121/187232.17e-041.36e-0375
GO:00073697Oral cavityOSCCgastrulation95/7305185/187234.17e-042.54e-0395
GO:00017043Oral cavityOSCCformation of primary germ layer65/7305121/187237.08e-043.90e-0365
GO:000736913Oral cavityEOLPgastrulation39/2218185/187232.29e-042.25e-0339
GO:000170412Oral cavityEOLPformation of primary germ layer24/2218121/187237.53e-033.62e-0224
GO:00073696ProstateBPHgastrulation50/3107185/187232.20e-041.78e-0350
GO:00017042ProstateBPHformation of primary germ layer35/3107121/187234.80e-043.42e-0335
GO:000736912ProstateTumorgastrulation52/3246185/187231.76e-041.55e-0352
GO:000170411ProstateTumorformation of primary germ layer36/3246121/187235.22e-043.82e-0336
GO:00073699SkinAKgastrulation41/1910185/187231.32e-064.13e-0541
GO:00017045SkinAKformation of primary germ layer30/1910121/187233.12e-068.17e-0530
Page: 1 2 

check button Enriched KEGG pathways.
Pathway IDTissueDisease StageDescriptionGene RatioBg Ratiopvaluep.adjustqvalueCount
hsa0516620CervixCCHuman T-cell leukemia virus 1 infection61/1267222/84658.13e-077.98e-064.72e-0661
hsa040142CervixCCRas signaling pathway51/1267236/84653.55e-031.34e-027.91e-0351
hsa05166110CervixCCHuman T-cell leukemia virus 1 infection61/1267222/84658.13e-077.98e-064.72e-0661
hsa0401411CervixCCRas signaling pathway51/1267236/84653.55e-031.34e-027.91e-0351
hsa0516643CervixN_HPVHuman T-cell leukemia virus 1 infection22/349222/84651.17e-041.18e-039.23e-0422
hsa0516653CervixN_HPVHuman T-cell leukemia virus 1 infection22/349222/84651.17e-041.18e-039.23e-0422
hsa05166ColorectumADHuman T-cell leukemia virus 1 infection72/2092222/84655.24e-032.44e-021.55e-0272
hsa051661ColorectumADHuman T-cell leukemia virus 1 infection72/2092222/84655.24e-032.44e-021.55e-0272
hsa051662ColorectumMSSHuman T-cell leukemia virus 1 infection68/1875222/84651.84e-039.61e-035.89e-0368
hsa051663ColorectumMSSHuman T-cell leukemia virus 1 infection68/1875222/84651.84e-039.61e-035.89e-0368
hsa04014ColorectumCRCRas signaling pathway49/1091236/84654.04e-044.50e-033.05e-0349
hsa040141ColorectumCRCRas signaling pathway49/1091236/84654.04e-044.50e-033.05e-0349
hsa05166211EsophagusESCCHuman T-cell leukemia virus 1 infection164/4205222/84658.13e-142.09e-121.07e-12164
hsa05166310EsophagusESCCHuman T-cell leukemia virus 1 infection164/4205222/84658.13e-142.09e-121.07e-12164
hsa0516614LiverCirrhoticHuman T-cell leukemia virus 1 infection87/2530222/84651.69e-038.01e-034.94e-0387
hsa0516615LiverCirrhoticHuman T-cell leukemia virus 1 infection87/2530222/84651.69e-038.01e-034.94e-0387
hsa0516622LiverHCCHuman T-cell leukemia virus 1 infection139/4020222/84653.17e-062.79e-051.55e-05139
hsa0516632LiverHCCHuman T-cell leukemia virus 1 infection139/4020222/84653.17e-062.79e-051.55e-05139
hsa0516630Oral cavityOSCCHuman T-cell leukemia virus 1 infection150/3704222/84653.68e-137.26e-123.70e-12150
hsa05166113Oral cavityOSCCHuman T-cell leukemia virus 1 infection150/3704222/84653.68e-137.26e-123.70e-12150
Page: 1 2 

Top

Cell-cell communication analysis

check buttonIdentification of potential cell-cell interactions between two cell types and their ligand-receptor pairs for different disease states
LigandReceptorLRpairPathwayTissueDisease Stage
Page: 1 

Top

Single-cell gene regulatory network inference analysis

check buttonFind out the significant the regulons (TFs) and the target genes of each regulon across cell types for different disease states
TFCell TypeTissueDisease StageTarget GeneRSSRegulon Activity
ETS2MYOEPIBreastADJPGF,CEBPD,VEGFA, etc.6.14e-01The dot plots of a searched regulon are shown for all cell subpopulations in each disease state of each tissue based on the regulon specific score inferred using pySCENIC and by calculating the average expression.
ETS2MYOEPIBreastPrecancerPGF,CEBPD,VEGFA, etc.5.89e-01The dot plots of a searched regulon are shown for all cell subpopulations in each disease state of each tissue based on the regulon specific score inferred using pySCENIC and by calculating the average expression.
ETS2MESCervixHealthyTM4SF1,KLF10,TGIF1, etc.4.30e-01The dot plots of a searched regulon are shown for all cell subpopulations in each disease state of each tissue based on the regulon specific score inferred using pySCENIC and by calculating the average expression.
ETS2STMColorectumADSLC12A2,ASCL2,CD44, etc.1.49e-01The dot plots of a searched regulon are shown for all cell subpopulations in each disease state of each tissue based on the regulon specific score inferred using pySCENIC and by calculating the average expression.
ETS2STMColorectumMSSSLC12A2,ASCL2,CD44, etc.2.68e-01The dot plots of a searched regulon are shown for all cell subpopulations in each disease state of each tissue based on the regulon specific score inferred using pySCENIC and by calculating the average expression.
ETS2STMColorectumSERSLC12A2,ASCL2,CD44, etc.8.14e-02The dot plots of a searched regulon are shown for all cell subpopulations in each disease state of each tissue based on the regulon specific score inferred using pySCENIC and by calculating the average expression.
ETS2DIFFEsophagusHealthyPHLDA1,MIR205HG,KLF6, etc.8.29e-02The dot plots of a searched regulon are shown for all cell subpopulations in each disease state of each tissue based on the regulon specific score inferred using pySCENIC and by calculating the average expression.
ETS2STMEsophagusHealthyPHLDA1,MIR205HG,KLF6, etc.4.52e-01The dot plots of a searched regulon are shown for all cell subpopulations in each disease state of each tissue based on the regulon specific score inferred using pySCENIC and by calculating the average expression.
ETS2INMONLungADJNAMPT,VCAN,S100A8, etc.1.78e-01The dot plots of a searched regulon are shown for all cell subpopulations in each disease state of each tissue based on the regulon specific score inferred using pySCENIC and by calculating the average expression.
ETS2INMONPancreasPanINNLRP3,HBEGF,CSF2RA, etc.6.56e-01The dot plots of a searched regulon are shown for all cell subpopulations in each disease state of each tissue based on the regulon specific score inferred using pySCENIC and by calculating the average expression.
∗The dot plots of a searched regulon are shown for all cell subpopulations in each disease state of each tissue based on the regulon specific score inferred using pySCENIC and by calculating the average expression.
Page: 1 2 

Top

Somatic mutation of malignant transformation related genes

check buttonAnnotation of somatic variants for genes involved in malignant transformation
Hugo SymbolVariant ClassVariant ClassificationdbSNP RSHGVScHGVSpHGVSp ShortSWISSPROTBIOTYPESIFTPolyPhenTumor Sample BarcodeTissueHistologySexAgeStageTherapy TypesDrugsOutcome
ETS2SNVMissense_Mutationc.1236N>Cp.Met412Ilep.M412IP15036protein_codingdeleterious(0)probably_damaging(0.993)TCGA-A2-A0YK-01Breastbreast invasive carcinomaFemale<65I/IIChemotherapycytoxanSD
ETS2SNVMissense_Mutationc.557N>Gp.Ser186Cysp.S186CP15036protein_codingtolerated(0.11)benign(0.425)TCGA-A8-A09Q-01Breastbreast invasive carcinomaFemale>=65III/IVHormone TherapyanastrozoleSD
ETS2SNVMissense_Mutationc.443N>Cp.Leu148Prop.L148PP15036protein_codingdeleterious(0)probably_damaging(1)TCGA-AO-A0JF-01Breastbreast invasive carcinomaFemale>=65I/IIChemotherapydoxorubicinSD
ETS2SNVMissense_Mutationrs777149491c.829N>Ap.Asp277Asnp.D277NP15036protein_codingtolerated(0.11)possibly_damaging(0.632)TCGA-D8-A27G-01Breastbreast invasive carcinomaFemale>=65I/IIUnknownUnknownSD
ETS2SNVMissense_Mutationc.554N>Tp.Thr185Ilep.T185IP15036protein_codingtolerated(0.12)benign(0.121)TCGA-E2-A158-01Breastbreast invasive carcinomaFemale<65I/IIChemotherapyarimidexSD
ETS2insertionFrame_Shift_Insnovelc.712_713insGTCAGAGAGCTTCCTTCCCTCTCCAGAAAATAAATTATTCp.Met238SerfsTer56p.M238Sfs*56P15036protein_codingTCGA-A8-A08H-01Breastbreast invasive carcinomaFemale>=65I/IIUnknownUnknownSD
ETS2SNVMissense_Mutationrs372145357c.559N>Ap.Val187Ilep.V187IP15036protein_codingtolerated(0.55)benign(0.007)TCGA-2W-A8YY-01Cervixcervical & endocervical cancerFemale<65I/IIChemotherapycisplatinCR
ETS2SNVMissense_Mutationc.127N>Gp.Leu43Valp.L43VP15036protein_codingtolerated(0.2)benign(0.251)TCGA-Q1-A73O-01Cervixcervical & endocervical cancerFemale<65I/IIChemotherapycisplatinCR
ETS2SNVMissense_Mutationc.431N>Cp.Lys144Thrp.K144TP15036protein_codingdeleterious(0)probably_damaging(0.984)TCGA-AA-A00N-01Colorectumcolon adenocarcinomaMale>=65I/IIUnknownUnknownPD
ETS2SNVMissense_Mutationc.825N>Ap.Asp275Glup.D275EP15036protein_codingtolerated(0.79)benign(0)TCGA-AA-A02O-01Colorectumcolon adenocarcinomaMale>=65I/IIUnknownUnknownSD
Page: 1 2 3 4 5 

Top

Related drugs of malignant transformation related genes

check buttonIdentification of chemicals and drugs interact with genes involved in malignant transfromation
(DGIdb 4.0)
Entrez IDSymbolCategoryInteraction TypesDrug Claim NameDrug NamePMIDs
2114ETS2CLINICALLY ACTIONABLE, TRANSCRIPTION FACTORTK216
2114ETS2CLINICALLY ACTIONABLE, TRANSCRIPTION FACTORcarboplatinCARBOPLATIN31616045
2114ETS2CLINICALLY ACTIONABLE, TRANSCRIPTION FACTORgemcitabineGEMCITABINE31616045
Page: 1