
|
|||||
|
 | |
| |
| |
| |
| |
| |
|
Gene: ETNK2 |
Gene summary for ETNK2 |
| Gene information | Species | Human | Gene symbol | ETNK2 | Gene ID | 55224 |
| Gene name | ethanolamine kinase 2 | |
| Gene Alias | EKI2 | |
| Cytomap | 1q32.1 | |
| Gene Type | protein-coding | GO ID | GO:0000003 | UniProtAcc | A0A024R976 |
Top |
Malignant transformation analysis |
| Identification of the aberrant gene expression in precancerous and cancerous lesions by comparing the gene expression of stem-like cells in diseased tissues with normal stem cells |
| Entrez ID | Symbol | Replicates | Species | Organ | Tissue | Adj P-value | Log2FC | Malignancy |
| 55224 | ETNK2 | LZE24T | Human | Esophagus | ESCC | 2.64e-03 | 2.05e-01 | 0.0596 |
| 55224 | ETNK2 | P2T-E | Human | Esophagus | ESCC | 4.02e-19 | 2.82e-01 | 0.1177 |
| 55224 | ETNK2 | P4T-E | Human | Esophagus | ESCC | 4.93e-09 | 3.19e-01 | 0.1323 |
| 55224 | ETNK2 | P5T-E | Human | Esophagus | ESCC | 1.55e-02 | 5.62e-02 | 0.1327 |
| 55224 | ETNK2 | P8T-E | Human | Esophagus | ESCC | 8.59e-07 | 2.24e-01 | 0.0889 |
| 55224 | ETNK2 | P9T-E | Human | Esophagus | ESCC | 3.52e-07 | 1.22e-01 | 0.1131 |
| 55224 | ETNK2 | P10T-E | Human | Esophagus | ESCC | 2.30e-10 | 2.33e-01 | 0.116 |
| 55224 | ETNK2 | P11T-E | Human | Esophagus | ESCC | 2.57e-02 | 2.39e-01 | 0.1426 |
| 55224 | ETNK2 | P12T-E | Human | Esophagus | ESCC | 1.05e-07 | 2.04e-01 | 0.1122 |
| 55224 | ETNK2 | P15T-E | Human | Esophagus | ESCC | 3.37e-10 | 2.62e-01 | 0.1149 |
| 55224 | ETNK2 | P16T-E | Human | Esophagus | ESCC | 1.41e-18 | 3.69e-01 | 0.1153 |
| 55224 | ETNK2 | P22T-E | Human | Esophagus | ESCC | 2.28e-05 | 1.09e-01 | 0.1236 |
| 55224 | ETNK2 | P24T-E | Human | Esophagus | ESCC | 2.05e-05 | 1.32e-01 | 0.1287 |
| 55224 | ETNK2 | P26T-E | Human | Esophagus | ESCC | 7.06e-21 | 4.10e-01 | 0.1276 |
| 55224 | ETNK2 | P27T-E | Human | Esophagus | ESCC | 4.19e-21 | 5.12e-01 | 0.1055 |
| 55224 | ETNK2 | P28T-E | Human | Esophagus | ESCC | 2.40e-19 | 4.19e-01 | 0.1149 |
| 55224 | ETNK2 | P30T-E | Human | Esophagus | ESCC | 2.74e-18 | 6.33e-01 | 0.137 |
| 55224 | ETNK2 | P31T-E | Human | Esophagus | ESCC | 1.85e-08 | 1.76e-01 | 0.1251 |
| 55224 | ETNK2 | P32T-E | Human | Esophagus | ESCC | 4.00e-08 | 1.15e-01 | 0.1666 |
| 55224 | ETNK2 | P37T-E | Human | Esophagus | ESCC | 1.36e-02 | 1.27e-01 | 0.1371 |
| Page: 1 2 3 4 |
| Tissue | Expression Dynamics | Abbreviation |
| Esophagus | 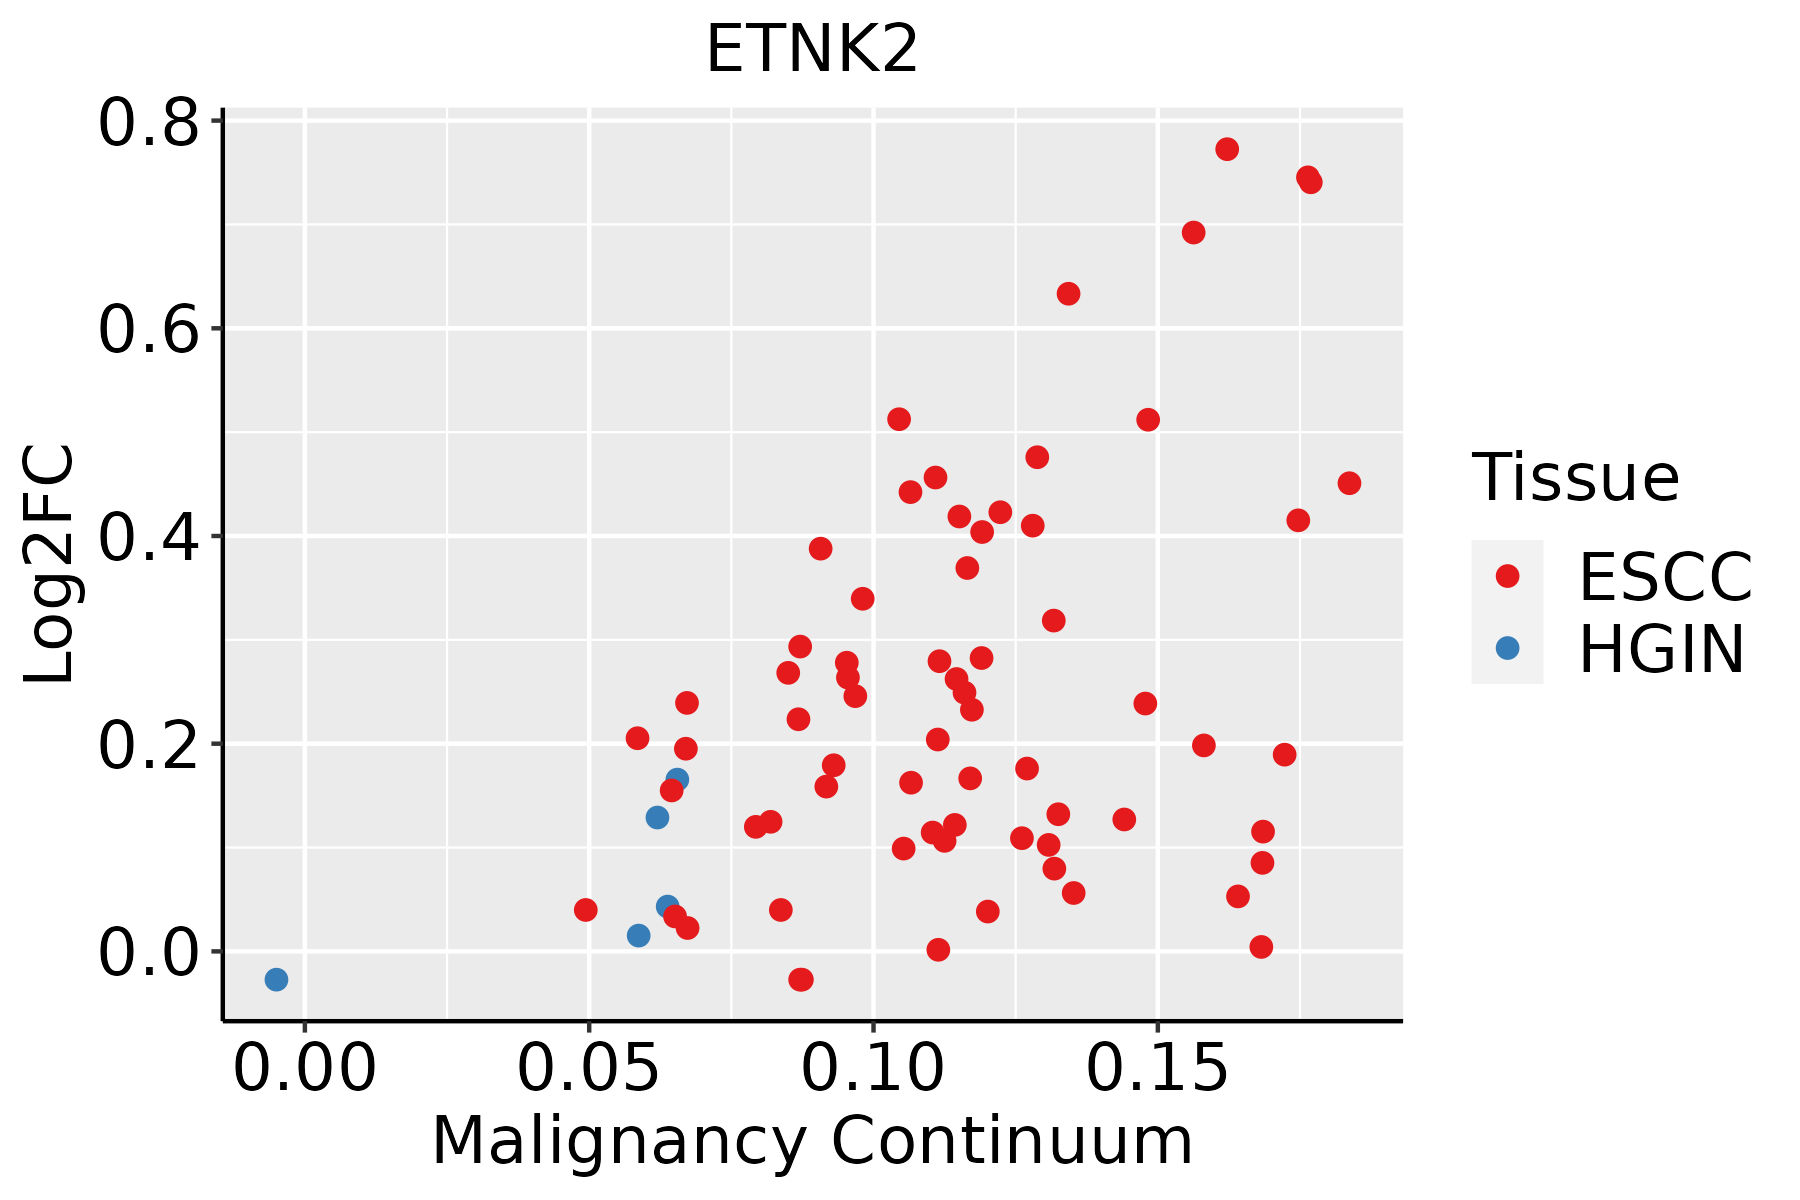 | ESCC: Esophageal squamous cell carcinoma |
| HGIN: High-grade intraepithelial neoplasias | ||
| LGIN: Low-grade intraepithelial neoplasias | ||
| Liver |  | HCC: Hepatocellular carcinoma |
| NAFLD: Non-alcoholic fatty liver disease | ||
| Oral Cavity | 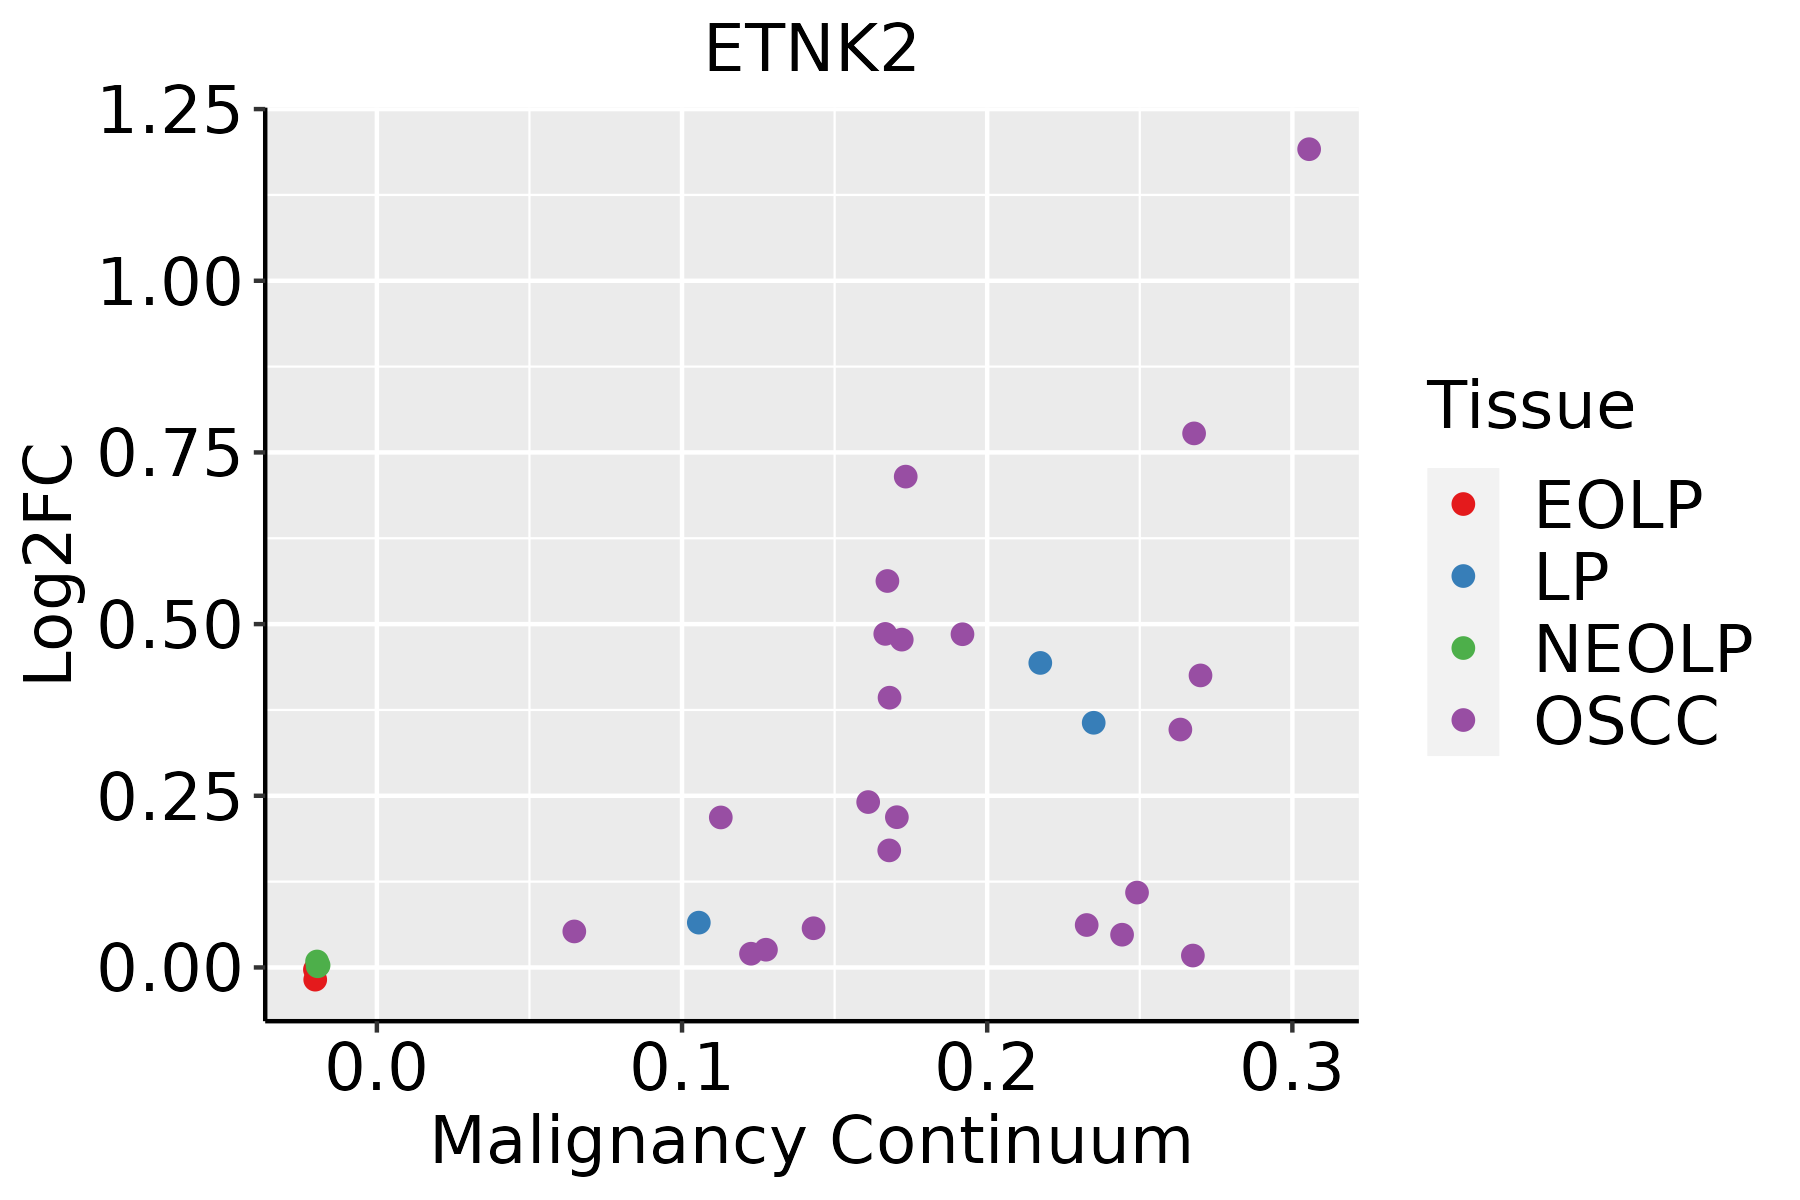 | EOLP: Erosive Oral lichen planus |
| LP: leukoplakia | ||
| NEOLP: Non-erosive oral lichen planus | ||
| OSCC: Oral squamous cell carcinoma |
| ∗log2FC in expression of this searched gene in stem-like cells from each diseased tissue sample relative to stem-like cells in normal samples in each tissue plotted against the malignancy continuum. Samples are colored based on if they are from different disease stage. |
Top |
Malignant transformation related pathway analysis |
| Find out the enriched GO biological processes and KEGG pathways involved in transition from healthy to precancer to cancer |
| Tissue | Disease Stage | Enriched GO biological Processes |
| Colorectum | AD |  |
| Colorectum | SER |  |
| Colorectum | MSS |  |
| Colorectum | MSI-H |  |
| Colorectum | FAP |  |
| ∗Top 15 enriched GO BP terms are showed in the bar plot of each disease state in each tissue. Each row represents a significant GO biological process which is colored according to the -log10(p.adjust). |
| Page: 1 2 3 4 5 6 7 8 9 |
| GO ID | Tissue | Disease Stage | Description | Gene Ratio | Bg Ratio | pvalue | p.adjust | Count |
| GO:000170119 | Esophagus | ESCC | in utero embryonic development | 243/8552 | 367/18723 | 1.00e-15 | 6.86e-14 | 243 |
| GO:00086544 | Esophagus | ESCC | phospholipid biosynthetic process | 162/8552 | 253/18723 | 2.59e-09 | 5.73e-08 | 162 |
| GO:0001890110 | Esophagus | ESCC | placenta development | 98/8552 | 144/18723 | 4.46e-08 | 8.11e-07 | 98 |
| GO:00464744 | Esophagus | ESCC | glycerophospholipid biosynthetic process | 135/8552 | 211/18723 | 5.75e-08 | 1.02e-06 | 135 |
| GO:0061458110 | Esophagus | ESCC | reproductive system development | 247/8552 | 427/18723 | 2.24e-07 | 3.42e-06 | 247 |
| GO:004860818 | Esophagus | ESCC | reproductive structure development | 245/8552 | 424/18723 | 2.82e-07 | 4.14e-06 | 245 |
| GO:00450175 | Esophagus | ESCC | glycerolipid biosynthetic process | 154/8552 | 252/18723 | 5.20e-07 | 6.96e-06 | 154 |
| GO:00066446 | Esophagus | ESCC | phospholipid metabolic process | 218/8552 | 383/18723 | 5.37e-06 | 5.59e-05 | 218 |
| GO:00097919 | Esophagus | ESCC | post-embryonic development | 56/8552 | 80/18723 | 9.08e-06 | 8.71e-05 | 56 |
| GO:00066505 | Esophagus | ESCC | glycerophospholipid metabolic process | 174/8552 | 306/18723 | 4.92e-05 | 3.85e-04 | 174 |
| GO:00352647 | Esophagus | ESCC | multicellular organism growth | 80/8552 | 132/18723 | 3.84e-04 | 2.22e-03 | 80 |
| GO:0006646 | Esophagus | ESCC | phosphatidylethanolamine biosynthetic process | 10/8552 | 10/18723 | 3.94e-04 | 2.26e-03 | 10 |
| GO:00464864 | Esophagus | ESCC | glycerolipid metabolic process | 211/8552 | 392/18723 | 6.51e-04 | 3.46e-03 | 211 |
| GO:00464863 | Liver | NAFLD | glycerolipid metabolic process | 66/1882 | 392/18723 | 1.94e-05 | 5.52e-04 | 66 |
| GO:00352643 | Liver | NAFLD | multicellular organism growth | 27/1882 | 132/18723 | 2.57e-04 | 4.19e-03 | 27 |
| GO:00450174 | Liver | NAFLD | glycerolipid biosynthetic process | 43/1882 | 252/18723 | 3.83e-04 | 5.73e-03 | 43 |
| GO:00464742 | Liver | NAFLD | glycerophospholipid biosynthetic process | 33/1882 | 211/18723 | 6.93e-03 | 4.88e-02 | 33 |
| GO:00086542 | Liver | HCC | phospholipid biosynthetic process | 150/7958 | 253/18723 | 4.77e-08 | 1.03e-06 | 150 |
| GO:00066444 | Liver | HCC | phospholipid metabolic process | 214/7958 | 383/18723 | 7.25e-08 | 1.48e-06 | 214 |
| GO:000170111 | Liver | HCC | in utero embryonic development | 204/7958 | 367/18723 | 2.44e-07 | 4.30e-06 | 204 |
| Page: 1 2 |
| Pathway ID | Tissue | Disease Stage | Description | Gene Ratio | Bg Ratio | pvalue | p.adjust | qvalue | Count |
| Page: 1 |
Top |
Cell-cell communication analysis |
| Identification of potential cell-cell interactions between two cell types and their ligand-receptor pairs for different disease states |
| Ligand | Receptor | LRpair | Pathway | Tissue | Disease Stage |
| Page: 1 |
Top |
Single-cell gene regulatory network inference analysis |
| Find out the significant the regulons (TFs) and the target genes of each regulon across cell types for different disease states |
| TF | Cell Type | Tissue | Disease Stage | Target Gene | RSS | Regulon Activity |
| ∗The dot plots of a searched regulon are shown for all cell subpopulations in each disease state of each tissue based on the regulon specific score inferred using pySCENIC and by calculating the average expression. |
| Page: 1 |
Top |
Somatic mutation of malignant transformation related genes |
| Annotation of somatic variants for genes involved in malignant transformation |
| Hugo Symbol | Variant Class | Variant Classification | dbSNP RS | HGVSc | HGVSp | HGVSp Short | SWISSPROT | BIOTYPE | SIFT | PolyPhen | Tumor Sample Barcode | Tissue | Histology | Sex | Age | Stage | Therapy Types | Drugs | Outcome |
| ETNK2 | SNV | Missense_Mutation | c.1135N>G | p.Leu379Val | p.L379V | Q9NVF9 | protein_coding | deleterious_low_confidence(0) | benign(0.136) | TCGA-A2-A0YL-01 | Breast | breast invasive carcinoma | Female | <65 | III/IV | Chemotherapy | cytoxan | SD | |
| ETNK2 | insertion | Frame_Shift_Ins | novel | c.915_916insGTGACCTGGGCCTGGT | p.Leu306ValfsTer41 | p.L306Vfs*41 | Q9NVF9 | protein_coding | TCGA-BH-A0HB-01 | Breast | breast invasive carcinoma | Female | <65 | I/II | Chemotherapy | docetaxel | SD | ||
| ETNK2 | SNV | Missense_Mutation | c.784G>C | p.Gly262Arg | p.G262R | Q9NVF9 | protein_coding | deleterious(0.01) | probably_damaging(0.986) | TCGA-IR-A3LK-01 | Cervix | cervical & endocervical cancer | Female | >=65 | I/II | Chemotherapy | cisplatin | PD | |
| ETNK2 | SNV | Missense_Mutation | c.1102N>A | p.Leu368Ile | p.L368I | Q9NVF9 | protein_coding | tolerated_low_confidence(0.39) | benign(0) | TCGA-AA-A01R-01 | Colorectum | colon adenocarcinoma | Male | <65 | III/IV | Chemotherapy | 5-fluorouracil | PD | |
| ETNK2 | SNV | Missense_Mutation | c.172G>A | p.Val58Met | p.V58M | Q9NVF9 | protein_coding | deleterious(0) | possibly_damaging(0.875) | TCGA-AD-6964-01 | Colorectum | colon adenocarcinoma | Male | <65 | III/IV | Chemotherapy | folfox | PD | |
| ETNK2 | SNV | Missense_Mutation | novel | c.1004N>C | p.Lys335Thr | p.K335T | Q9NVF9 | protein_coding | deleterious(0) | benign(0.157) | TCGA-CA-6717-01 | Colorectum | colon adenocarcinoma | Male | <65 | I/II | Chemotherapy | oxaliplatin | CR |
| ETNK2 | SNV | Missense_Mutation | rs768590671 | c.628G>A | p.Glu210Lys | p.E210K | Q9NVF9 | protein_coding | tolerated(0.09) | benign(0.172) | TCGA-CM-6162-01 | Colorectum | colon adenocarcinoma | Female | <65 | III/IV | Chemotherapy | oxaliplatin | SD |
| ETNK2 | SNV | Missense_Mutation | rs759671962 | c.614N>T | p.Thr205Met | p.T205M | Q9NVF9 | protein_coding | tolerated(0.05) | benign(0.094) | TCGA-AG-A01W-01 | Colorectum | rectum adenocarcinoma | Female | >=65 | I/II | Chemotherapy | 5-fluorouracil | CR |
| ETNK2 | SNV | Missense_Mutation | novel | c.1090N>A | p.Ala364Thr | p.A364T | Q9NVF9 | protein_coding | tolerated_low_confidence(0.18) | benign(0.001) | TCGA-EI-6917-01 | Colorectum | rectum adenocarcinoma | Male | <65 | III/IV | Chemotherapy | 5fluorouracil+oxaciplatina+l-folinian | SD |
| ETNK2 | SNV | Missense_Mutation | c.638C>A | p.Pro213His | p.P213H | Q9NVF9 | protein_coding | deleterious(0.03) | probably_damaging(0.939) | TCGA-AP-A051-01 | Endometrium | uterine corpus endometrioid carcinoma | Female | >=65 | I/II | Unknown | Unknown | SD |
| Page: 1 2 |
Top |
Related drugs of malignant transformation related genes |
| Identification of chemicals and drugs interact with genes involved in malignant transfromation |
| (DGIdb 4.0) |
| Entrez ID | Symbol | Category | Interaction Types | Drug Claim Name | Drug Name | PMIDs |
| Page: 1 |

Copyright 2023-Present -The University of Texas Health Science Center at Houston |