Schematic overview of the cellular and molecular mechanisms involved in the cancer progression, including the proposed cellular and molecular mechanisms in cancer cells trajectory. AT1: alveolar type 1 cells; AT2: alveolar type 2 cells; AAH: atypical adenomatous hyperplasia; AIS: adenocarcinoma in situ; MIA: minimally invasive adenocarcinoma; IA: invasive adenocarcinoma; EMT: epithelial-mesenchymal transition

Home

Download

Statistics

Help

Contact

Center for Computational Systems Medicine
leaf

Gene summary

leaf

Malignant transformation analysis

leaf

Malignant transformation related pathway analysis

leaf

Cell-cell communication analysis

leaf

Single-cell gene regulatory network inference analysis

leaf

Somatic mutation of malignant transformation related genes

leaf

Related drugs of malignant transformation related genes

Gene: ETNK1

Gene summary for ETNK1

check button Gene summary.

Gene informationSpeciesHuman
Gene symbol

ETNK1

Gene ID

55500

Gene nameethanolamine kinase 1
Gene AliasEKI
Cytomap12p12.1
Gene Typeprotein-coding
GO ID

GO:0006629

UniProtAcc

Q9HBU6


Top

Malignant transformation analysis

check button Identification of the aberrant gene expression in precancerous and cancerous lesions by comparing the gene expression of stem-like cells in diseased tissues with normal stem cells
check button Malignant transformation involving gene list.
Entrez IDSymbolReplicatesSpeciesOrganTissueAdj P-valueLog2FCMalignancy
55500ETNK1CCI_2HumanCervixCC3.97e-061.23e+000.5249
55500ETNK1CCI_3HumanCervixCC8.71e-088.94e-010.516
55500ETNK1HTA11_3410_2000001011HumanColorectumAD3.34e-27-7.09e-010.0155
55500ETNK1HTA11_2951_2000001011HumanColorectumAD6.97e-03-7.26e-010.0216
55500ETNK1HTA11_3361_2000001011HumanColorectumAD2.44e-02-4.68e-01-0.1207
55500ETNK1HTA11_696_2000001011HumanColorectumAD5.34e-24-6.97e-01-0.1464
55500ETNK1HTA11_866_2000001011HumanColorectumAD3.61e-12-5.64e-01-0.1001
55500ETNK1HTA11_2992_2000001011HumanColorectumSER1.85e-02-6.50e-01-0.1706
55500ETNK1HTA11_546_2000001011HumanColorectumAD3.17e-09-7.31e-01-0.0842
55500ETNK1HTA11_866_3004761011HumanColorectumAD3.10e-13-6.30e-010.096
55500ETNK1HTA11_9408_2000001011HumanColorectumAD1.32e-04-9.64e-010.0451
55500ETNK1HTA11_8622_2000001021HumanColorectumSER8.26e-07-7.59e-010.0528
55500ETNK1HTA11_10623_2000001011HumanColorectumAD4.30e-02-5.85e-01-0.0177
55500ETNK1HTA11_10711_2000001011HumanColorectumAD6.33e-11-7.04e-010.0338
55500ETNK1HTA11_7696_3000711011HumanColorectumAD3.54e-28-7.48e-010.0674
55500ETNK1HTA11_6818_2000001011HumanColorectumAD5.68e-10-9.02e-010.0112
55500ETNK1HTA11_11156_2000001011HumanColorectumAD3.52e-02-8.64e-010.0397
55500ETNK1HTA11_6818_2000001021HumanColorectumAD4.46e-06-6.19e-010.0588
55500ETNK1HTA11_99999971662_82457HumanColorectumMSS2.30e-07-4.77e-010.3859
55500ETNK1HTA11_99999973899_84307HumanColorectumMSS1.15e-11-7.93e-010.2585
Page: 1 2 3 4 5 6 7 8 9 10 

check button Transcriptomic changes along malignancy continuum.
TissueExpression DynamicsAbbreviation
CervixThe image shows the transcriptomic changes along malignancy continuum.log2FC in expression of this searched gene in stem-like cells from each diseased tissue sample relative to stem-like cells in normal samples in each tissue plotted against the malignancy continuum. Samples are colored based on if they are from different disease stage.CC: Cervix cancer
HSIL_HPV: HPV-infected high-grade squamous intraepithelial lesions
N_HPV: HPV-infected normal cervix
Colorectum (GSE201348)The image shows the transcriptomic changes along malignancy continuum.log2FC in expression of this searched gene in stem-like cells from each diseased tissue sample relative to stem-like cells in normal samples in each tissue plotted against the malignancy continuum. Samples are colored based on if they are from different disease stage.FAP: Familial adenomatous polyposis
CRC: Colorectal cancer
Colorectum (HTA11)The image shows the transcriptomic changes along malignancy continuum.log2FC in expression of this searched gene in stem-like cells from each diseased tissue sample relative to stem-like cells in normal samples in each tissue plotted against the malignancy continuum. Samples are colored based on if they are from different disease stage.AD: Adenomas
SER: Sessile serrated lesions
MSI-H: Microsatellite-high colorectal cancer
MSS: Microsatellite stable colorectal cancer
EsophagusThe image shows the transcriptomic changes along malignancy continuum.log2FC in expression of this searched gene in stem-like cells from each diseased tissue sample relative to stem-like cells in normal samples in each tissue plotted against the malignancy continuum. Samples are colored based on if they are from different disease stage.ESCC: Esophageal squamous cell carcinoma
HGIN: High-grade intraepithelial neoplasias
LGIN: Low-grade intraepithelial neoplasias
GCThe image shows the transcriptomic changes along malignancy continuum.log2FC in expression of this searched gene in stem-like cells from each diseased tissue sample relative to stem-like cells in normal samples in each tissue plotted against the malignancy continuum. Samples are colored based on if they are from different disease stage.
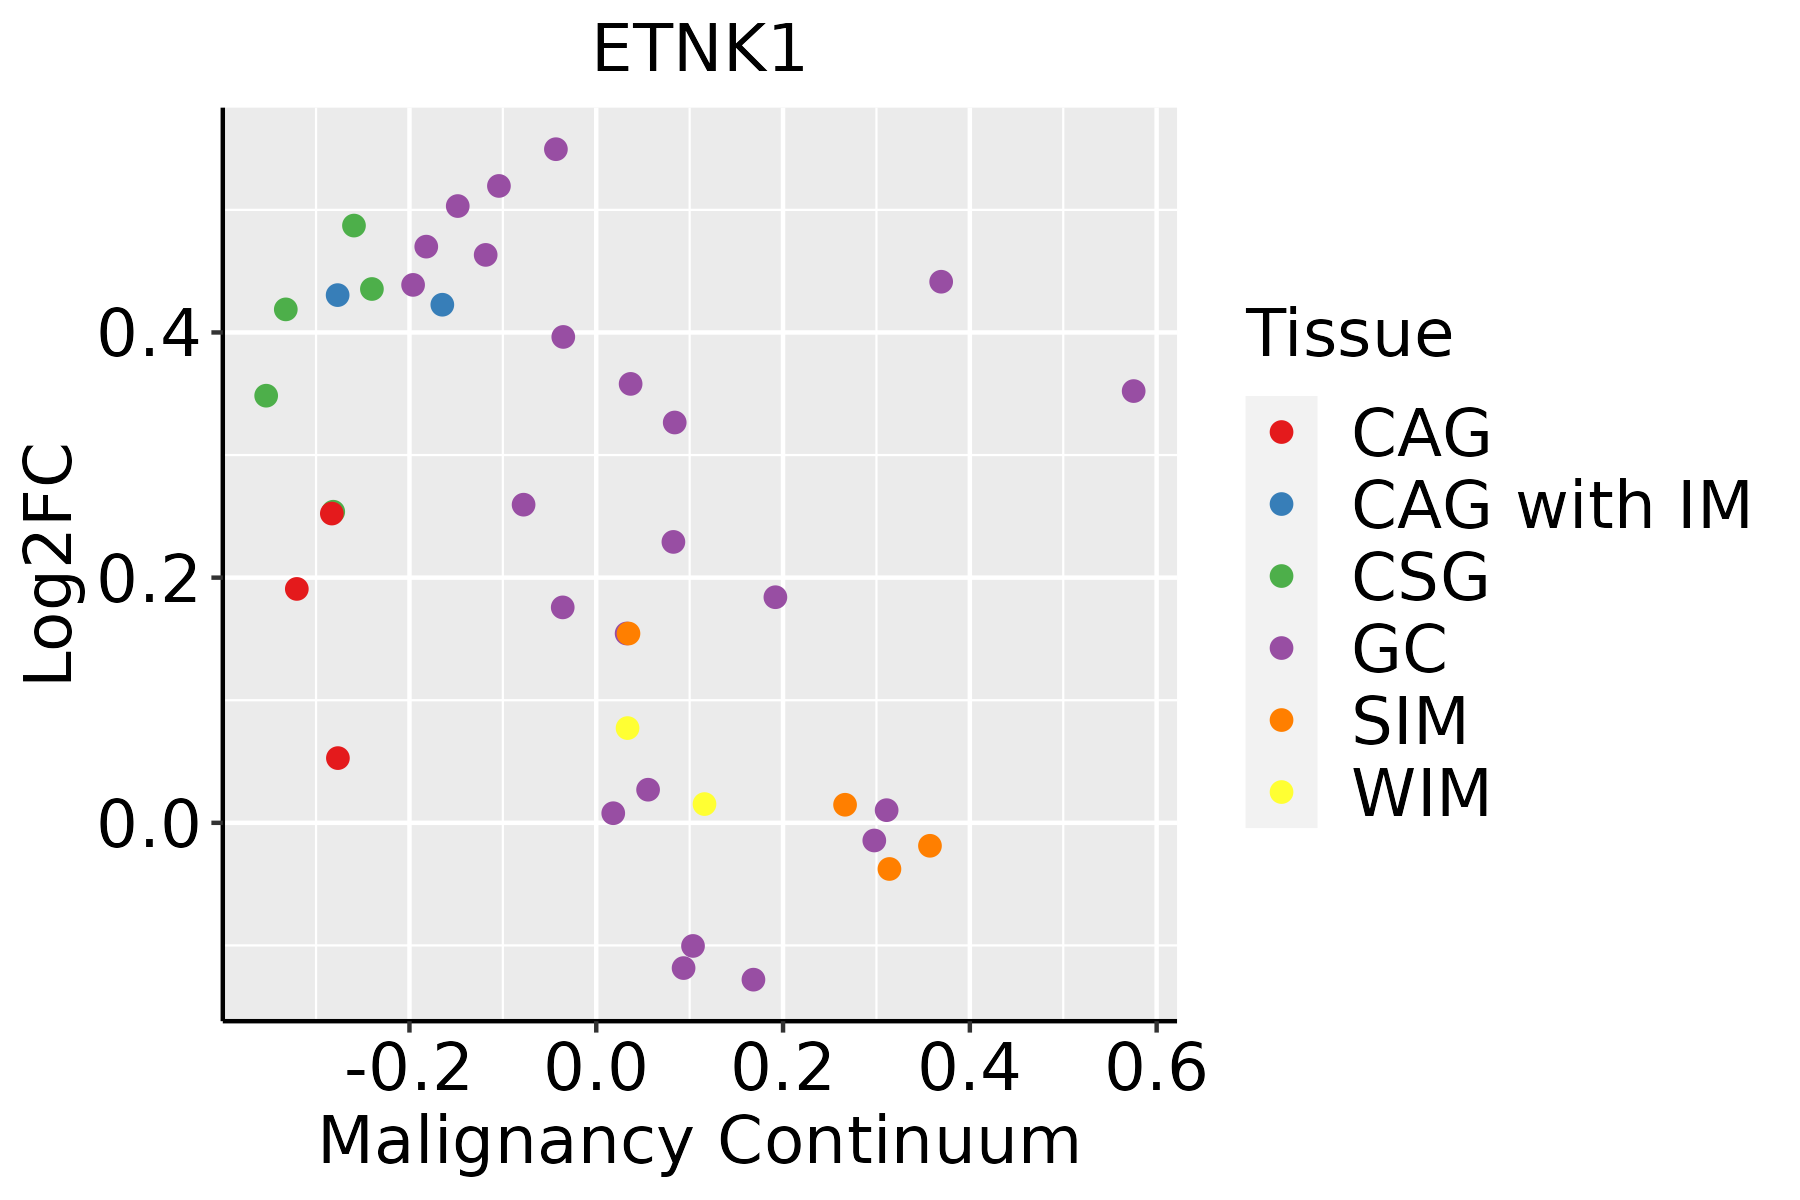
CAG: Chronic atrophic gastritis
CAG with IM: Chronic atrophic gastritis with intestinal metaplasia
CSG: Chronic superficial gastritis
GC: Gastric cancer
SIM: Severe intestinal metaplasia
WIM: Wild intestinal metaplasia
LiverThe image shows the transcriptomic changes along malignancy continuum.log2FC in expression of this searched gene in stem-like cells from each diseased tissue sample relative to stem-like cells in normal samples in each tissue plotted against the malignancy continuum. Samples are colored based on if they are from different disease stage.
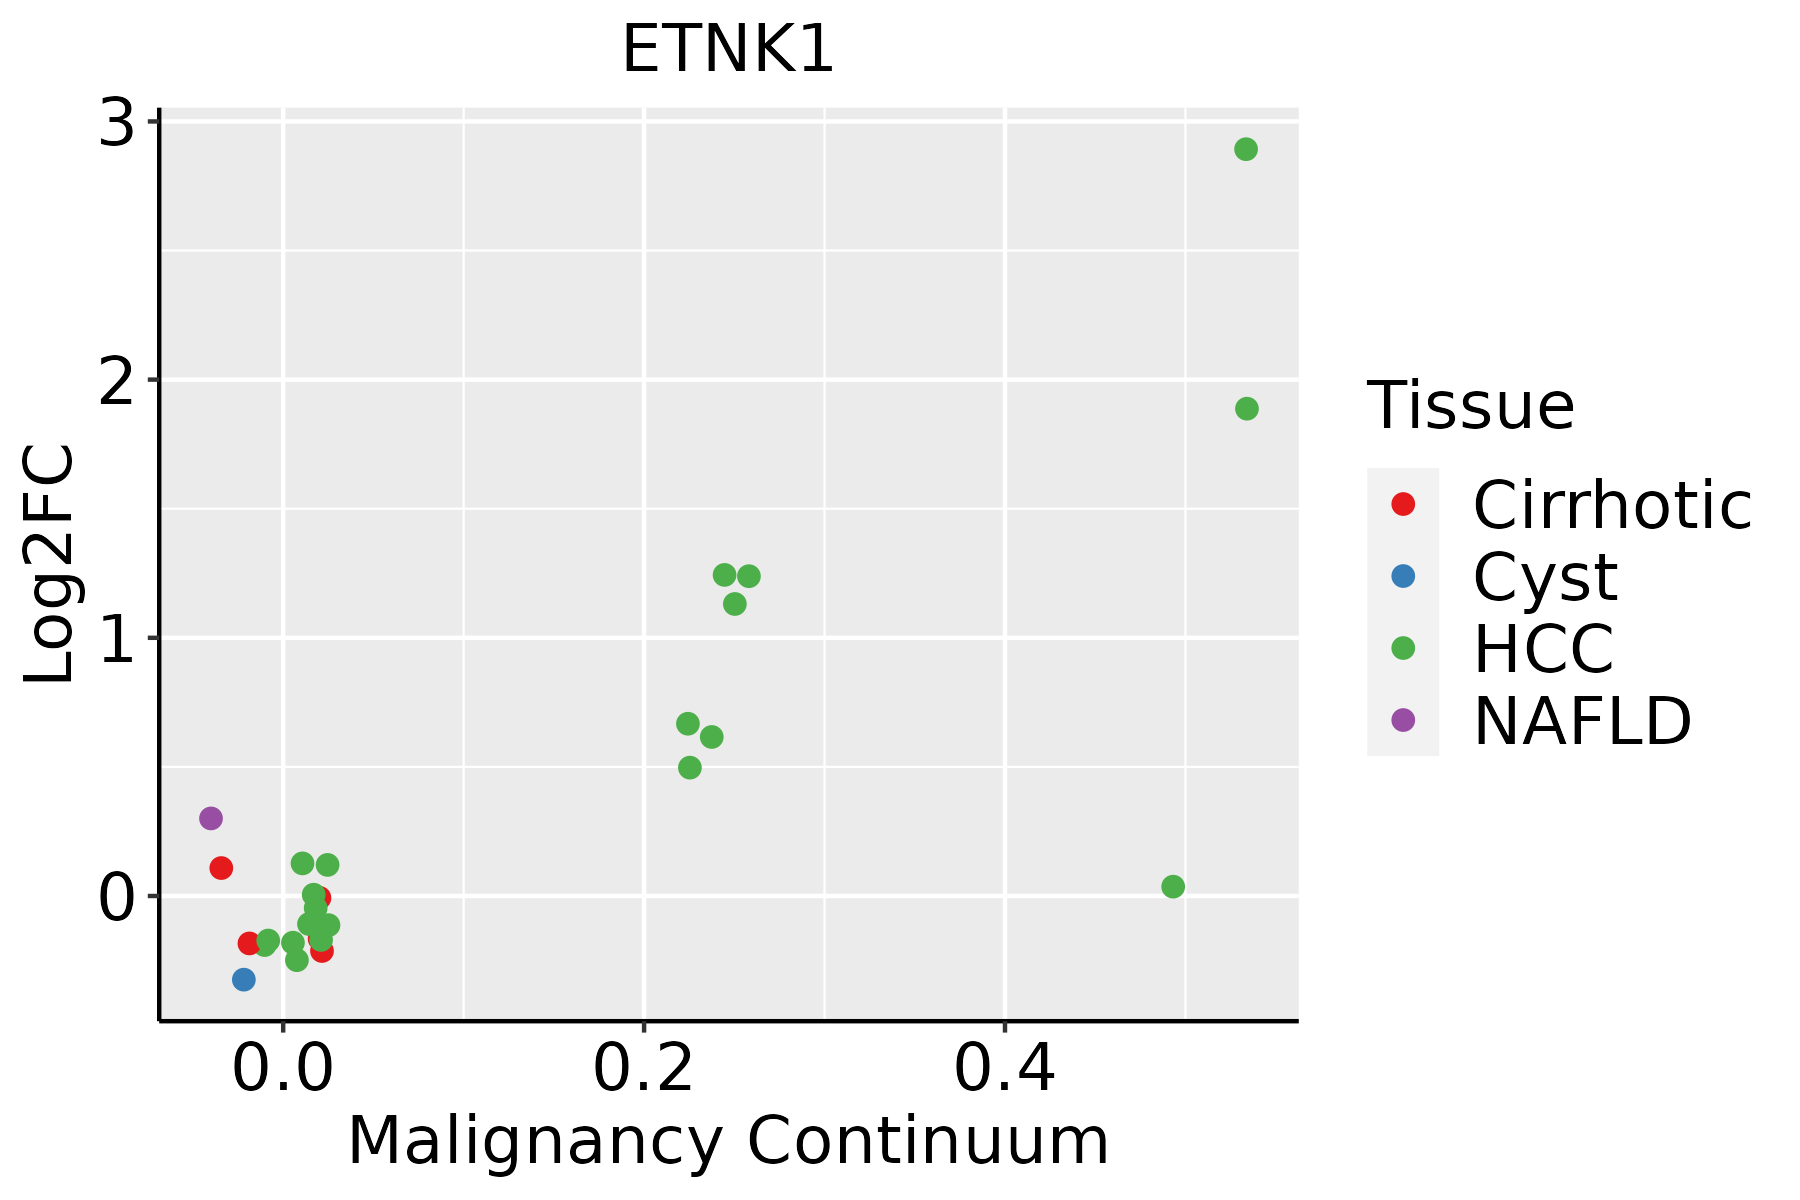
HCC: Hepatocellular carcinoma
NAFLD: Non-alcoholic fatty liver disease
LungThe image shows the transcriptomic changes along malignancy continuum.log2FC in expression of this searched gene in stem-like cells from each diseased tissue sample relative to stem-like cells in normal samples in each tissue plotted against the malignancy continuum. Samples are colored based on if they are from different disease stage.
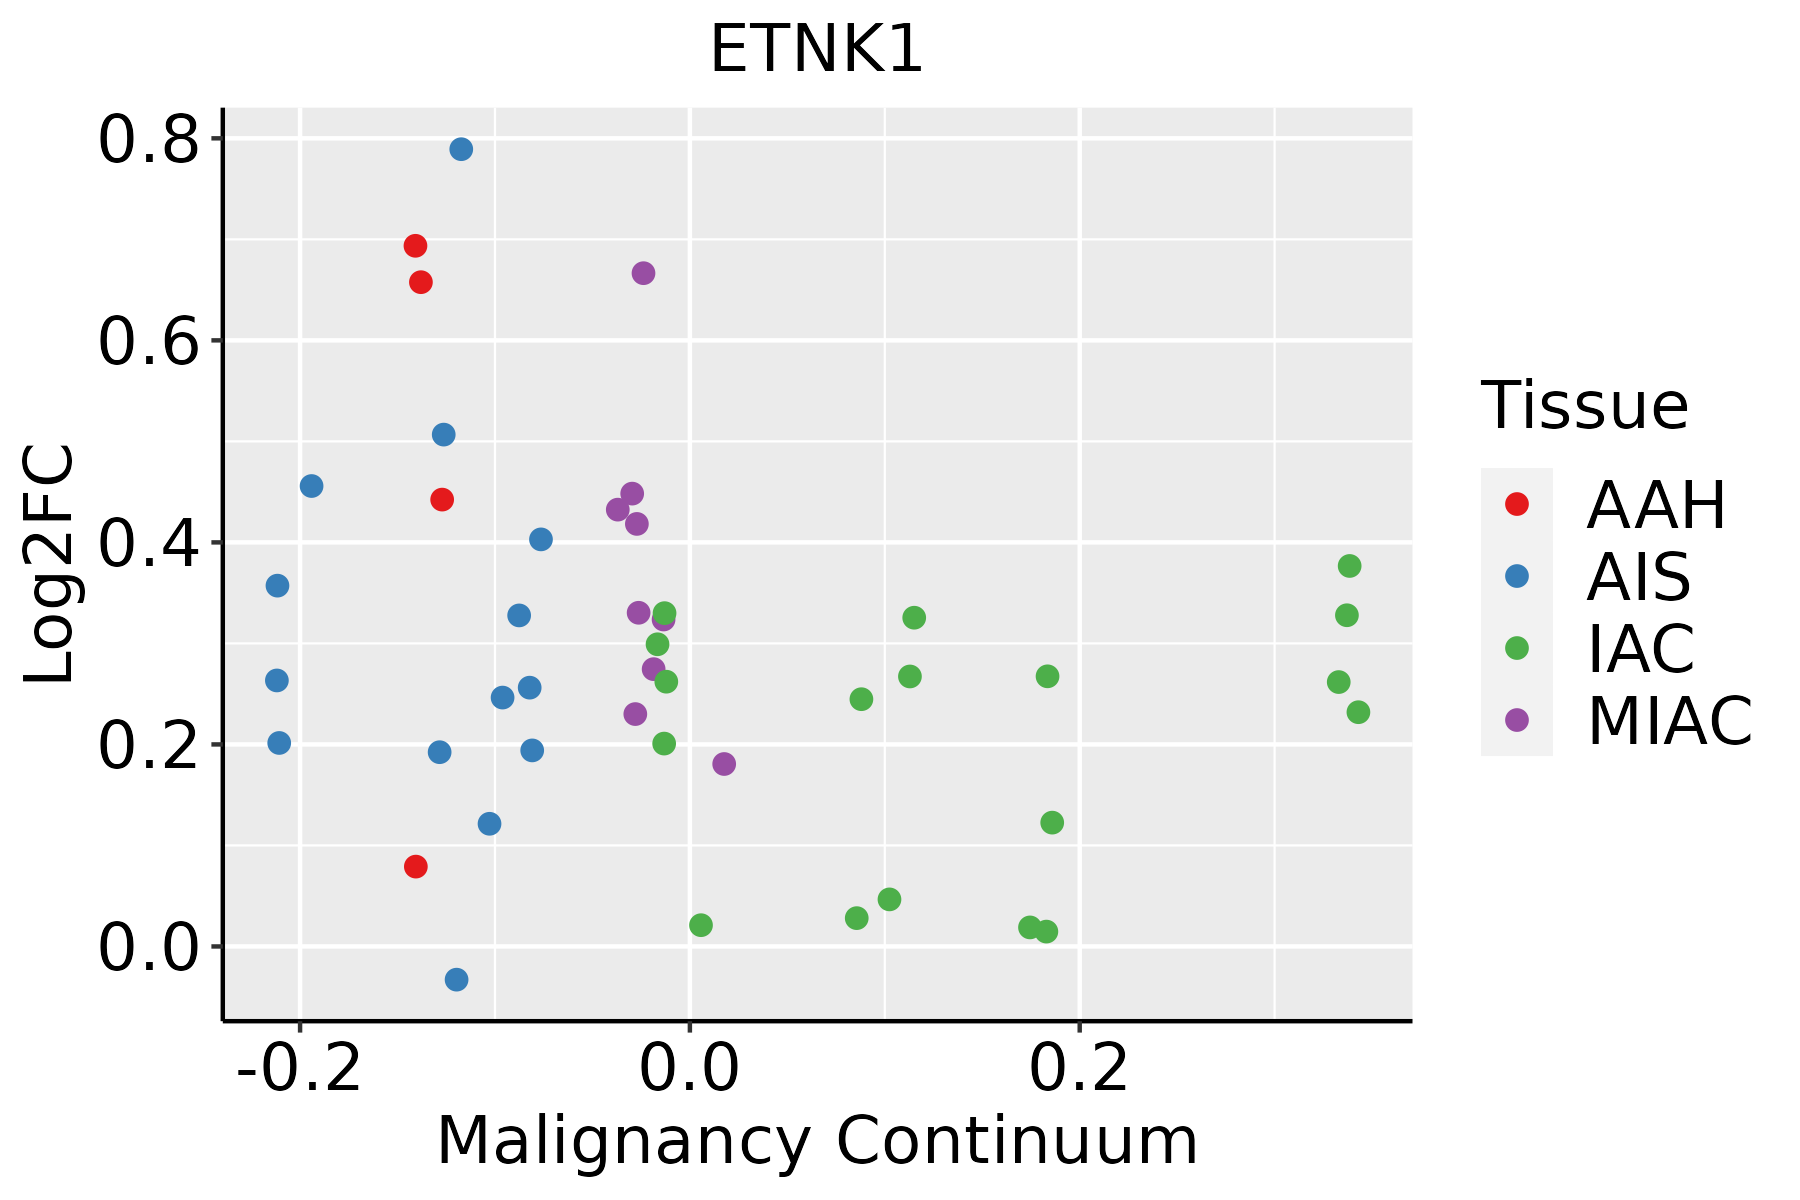
AAH: Atypical adenomatous hyperplasia
AIS: Adenocarcinoma in situ
IAC: Invasive lung adenocarcinoma
MIA: Minimally invasive adenocarcinoma
Oral CavityThe image shows the transcriptomic changes along malignancy continuum.log2FC in expression of this searched gene in stem-like cells from each diseased tissue sample relative to stem-like cells in normal samples in each tissue plotted against the malignancy continuum. Samples are colored based on if they are from different disease stage.EOLP: Erosive Oral lichen planus
LP: leukoplakia
NEOLP: Non-erosive oral lichen planus
OSCC: Oral squamous cell carcinoma
ThyroidThe image shows the transcriptomic changes along malignancy continuum.log2FC in expression of this searched gene in stem-like cells from each diseased tissue sample relative to stem-like cells in normal samples in each tissue plotted against the malignancy continuum. Samples are colored based on if they are from different disease stage.ATC: Anaplastic thyroid cancer
HT: Hashimoto's thyroiditis
PTC: Papillary thyroid cancer
∗log2FC in expression of this searched gene in stem-like cells from each diseased tissue sample relative to stem-like cells in normal samples in each tissue plotted against the malignancy continuum. Samples are colored based on if they are from different disease stage.

Top

Malignant transformation related pathway analysis

check buttonFind out the enriched GO biological processes and KEGG pathways involved in transition from healthy to precancer to cancer
check button Figure of enriched GO biological processes.
TissueDisease StageEnriched GO biological Processes
ColorectumADGO analysis - Figure of enriched GO biological processes: Top 15 enriched GO BP terms are showed in the bar plot of each disease state in each tissue. Each row represents a significant GO biological process which is colored according to the -log10(p.adjust).
ColorectumSERGO analysis - Figure of enriched GO biological processes: Top 15 enriched GO BP terms are showed in the bar plot of each disease state in each tissue. Each row represents a significant GO biological process which is colored according to the -log10(p.adjust).
ColorectumMSSGO analysis - Figure of enriched GO biological processes: Top 15 enriched GO BP terms are showed in the bar plot of each disease state in each tissue. Each row represents a significant GO biological process which is colored according to the -log10(p.adjust).
ColorectumMSI-HGO analysis - Figure of enriched GO biological processes: Top 15 enriched GO BP terms are showed in the bar plot of each disease state in each tissue. Each row represents a significant GO biological process which is colored according to the -log10(p.adjust).
ColorectumFAPGO analysis - Figure of enriched GO biological processes: Top 15 enriched GO BP terms are showed in the bar plot of each disease state in each tissue. Each row represents a significant GO biological process which is colored according to the -log10(p.adjust).
∗Top 15 enriched GO BP terms are showed in the bar plot of each disease state in each tissue. Each row represents a significant GO biological process which is colored according to the -log10(p.adjust).
Page: 1 2 3 4 5 6 7 8 9 

check button Enriched GO biological processes.
GO IDTissueDisease StageDescriptionGene RatioBg Ratiopvaluep.adjustCount
GO:0006650ColorectumADglycerophospholipid metabolic process83/3918306/187235.40e-033.55e-0283
GO:0006644ColorectumADphospholipid metabolic process101/3918383/187235.80e-033.67e-02101
GO:0045017ColorectumADglycerolipid biosynthetic process69/3918252/187238.33e-034.88e-0269
GO:0046486ColorectumSERglycerolipid metabolic process82/2897392/187232.26e-032.17e-0282
GO:00066441ColorectumSERphospholipid metabolic process79/2897383/187233.94e-033.24e-0279
GO:00450171ColorectumSERglycerolipid biosynthetic process55/2897252/187234.47e-033.56e-0255
GO:00066501ColorectumSERglycerophospholipid metabolic process64/2897306/187236.41e-034.60e-0264
GO:0008654ColorectumFAPphospholipid biosynthetic process54/2622253/187238.88e-049.08e-0354
GO:00066502ColorectumFAPglycerophospholipid metabolic process62/2622306/187231.54e-031.38e-0262
GO:00066442ColorectumFAPphospholipid metabolic process74/2622383/187232.24e-031.83e-0274
GO:0046474ColorectumFAPglycerophospholipid biosynthetic process44/2622211/187233.98e-032.76e-0244
GO:00450172ColorectumFAPglycerolipid biosynthetic process50/2622252/187236.32e-033.95e-0250
GO:00086541ColorectumCRCphospholipid biosynthetic process49/2078253/187237.07e-051.51e-0349
GO:00066503ColorectumCRCglycerophospholipid metabolic process55/2078306/187232.10e-043.55e-0355
GO:00450173ColorectumCRCglycerolipid biosynthetic process47/2078252/187232.47e-044.06e-0347
GO:00066443ColorectumCRCphospholipid metabolic process65/2078383/187233.21e-044.95e-0365
GO:00464741ColorectumCRCglycerophospholipid biosynthetic process40/2078211/187234.91e-047.02e-0340
GO:00464861ColorectumCRCglycerolipid metabolic process64/2078392/187231.01e-031.19e-0264
GO:00086544EsophagusESCCphospholipid biosynthetic process162/8552253/187232.59e-095.73e-08162
GO:00464744EsophagusESCCglycerophospholipid biosynthetic process135/8552211/187235.75e-081.02e-06135
Page: 1 2 

check button Enriched KEGG pathways.
Pathway IDTissueDisease StageDescriptionGene RatioBg Ratiopvaluep.adjustqvalueCount
Page: 1 

Top

Cell-cell communication analysis

check buttonIdentification of potential cell-cell interactions between two cell types and their ligand-receptor pairs for different disease states
LigandReceptorLRpairPathwayTissueDisease Stage
Page: 1 

Top

Single-cell gene regulatory network inference analysis

check buttonFind out the significant the regulons (TFs) and the target genes of each regulon across cell types for different disease states
TFCell TypeTissueDisease StageTarget GeneRSSRegulon Activity
∗The dot plots of a searched regulon are shown for all cell subpopulations in each disease state of each tissue based on the regulon specific score inferred using pySCENIC and by calculating the average expression.
Page: 1 

Top

Somatic mutation of malignant transformation related genes

check buttonAnnotation of somatic variants for genes involved in malignant transformation
Hugo SymbolVariant ClassVariant ClassificationdbSNP RSHGVScHGVSpHGVSp ShortSWISSPROTBIOTYPESIFTPolyPhenTumor Sample BarcodeTissueHistologySexAgeStageTherapy TypesDrugsOutcome
ETNK1SNVMissense_Mutationnovelc.765N>Tp.Lys255Asnp.K255NQ9HBU6protein_codingdeleterious(0.01)probably_damaging(0.985)TCGA-AN-A046-01Breastbreast invasive carcinomaFemale>=65I/IIUnknownUnknownSD
ETNK1SNVMissense_Mutationnovelc.649G>Ap.Asp217Asnp.D217NQ9HBU6protein_codingtolerated(0.22)benign(0.223)TCGA-BH-A18V-01Breastbreast invasive carcinomaFemale<65I/IIUnknownUnknownSD
ETNK1SNVMissense_Mutationnovelc.745A>Cp.Lys249Glnp.K249QQ9HBU6protein_codingtolerated(0.12)benign(0.145)TCGA-D8-A1JA-01Breastbreast invasive carcinomaFemale<65III/IVChemotherapyadriamycinPD
ETNK1insertionNonsense_Mutationnovelc.1338_1339insCAGCCAATTGGATGATACCAGCCGACATTGAGGGTGGp.Ala447GlnfsTer5p.A447Qfs*5Q9HBU6protein_codingTCGA-B6-A0IN-01Breastbreast invasive carcinomaFemale<65I/IIUnknownUnknownPD
ETNK1SNVMissense_Mutationc.721N>Tp.His241Tyrp.H241YQ9HBU6protein_codingdeleterious(0.03)benign(0.356)TCGA-LP-A4AV-01Cervixcervical & endocervical cancerFemale<65I/IIUnknownUnknownSD
ETNK1SNVMissense_Mutationnovelc.500N>Tp.Arg167Ilep.R167IQ9HBU6protein_codingdeleterious(0)probably_damaging(1)TCGA-AA-3984-01Colorectumcolon adenocarcinomaFemale<65I/IIUnknownUnknownSD
ETNK1SNVMissense_Mutationc.270G>Tp.Met90Ilep.M90IQ9HBU6protein_codingdeleterious_low_confidence(0.02)possibly_damaging(0.838)TCGA-DM-A288-01Colorectumcolon adenocarcinomaMale>=65III/IVUnknownUnknownPD
ETNK1deletionIn_Frame_Delc.28_30delTCCp.Ser10delp.S10delQ9HBU6protein_codingTCGA-F5-6810-01Colorectumrectum adenocarcinomaUnknownUnknownI/IIUnknownUnknownUnknown
ETNK1SNVMissense_Mutationnovelc.966N>Cp.Gln322Hisp.Q322HQ9HBU6protein_codingdeleterious(0.04)benign(0.14)TCGA-A5-A0G1-01Endometriumuterine corpus endometrioid carcinomaFemale>=65I/IIUnknownUnknownSD
ETNK1SNVMissense_Mutationc.593N>Cp.Leu198Prop.L198PQ9HBU6protein_codingdeleterious(0)probably_damaging(0.999)TCGA-AP-A059-01Endometriumuterine corpus endometrioid carcinomaFemale>=65I/IIUnknownUnknownSD
Page: 1 2 3 4 5 

Top

Related drugs of malignant transformation related genes

check buttonIdentification of chemicals and drugs interact with genes involved in malignant transfromation
(DGIdb 4.0)
Entrez IDSymbolCategoryInteraction TypesDrug Claim NameDrug NamePMIDs
Page: 1